Table of Contents
Looking to turn Google Sheets data into beautiful client-facing charts and graphs quickly, easily, and–best of all–automatically? Creating Google Charts that automatically update based on date ranges can be an arduous task. Google Sheets offers a powerful and convenient way to create dynamic charts, but getting them to update quickly and accurately with the right data can be challenging.
Google Sheets requires extensive knowledge of the underlying syntax in order to use the right filters and formulas to create dynamic charts that update in real-time. And what happens when that syntax is off slightly? Inaccurate client reports.
However, with the Google Sheets integration from AgencyAnalytics, easily create dynamic line charts, bar charts, pie charts, and sparkline charts using your Google Sheets data.
And, even better...the Google Sheets line and sparkline widgets are date range dependent!
Whether you're working with in-house or custom data sets, these charts give you the versatility you need to visualize and showcase your information to clients and stakeholders.
Leverage widgets that update in real-time, giving you full control over the data displayed and the presentation of that data. And with date range functionality, your line charts and sparkline widgets will automatically change the data they display simply by changing the date range in the AgencyAnalytics interface.

Why is Google Sheets such a useful tool for your agency's reports and dashboards?
With Google Sheets, you can import data from any data sources, enabling you to show all of the in-house data you have. It's the go-to solution for any custom data you need to share with your clients.
Here are a few examples of what you can do:
Grab sales and customer data from offline sources or from a payments platform like Stripe
Pull in lead metrics via your client's CRM
Report on email marketing if we don't yet integrate with your provider
Track incoming text messages via Twilio for an SMS campaign
Get total signups for an event (ex. through Eventbrite or Meetup)
As long as you can get the data into a Sheet, you can report on it on AgencyAnalytics.
Once you get your data into a Google Sheet, it's easy to pull it in. Importantly, it's easy to pull in the most recent Sheets' data automatically whenever a dashboard or report is opened, so you can be assured that your clients are always seeing up-to-the-minute data.
You've probably been using Google Sheets with AgencyAnalytics to create table and stat widgets for a while now (if you haven't, what are you waiting for!).
This additional functionality takes the Google Sheets integration to the next level, and opens up a huge range of new reporting possibilities for your agency's reporting.
Google Sheets Widgets
The Google Sheets integration includes six different widget types for visualizing data, including two widgets that are date range dependent.
Let's take a closer look at what's available.
Google Sheets Line Chart Widgets
The Google Sheets line charts allow you to show data over time. And, of course, these line charts will change with your report or dashboard's date range.
Great, right?! Here's one in action:
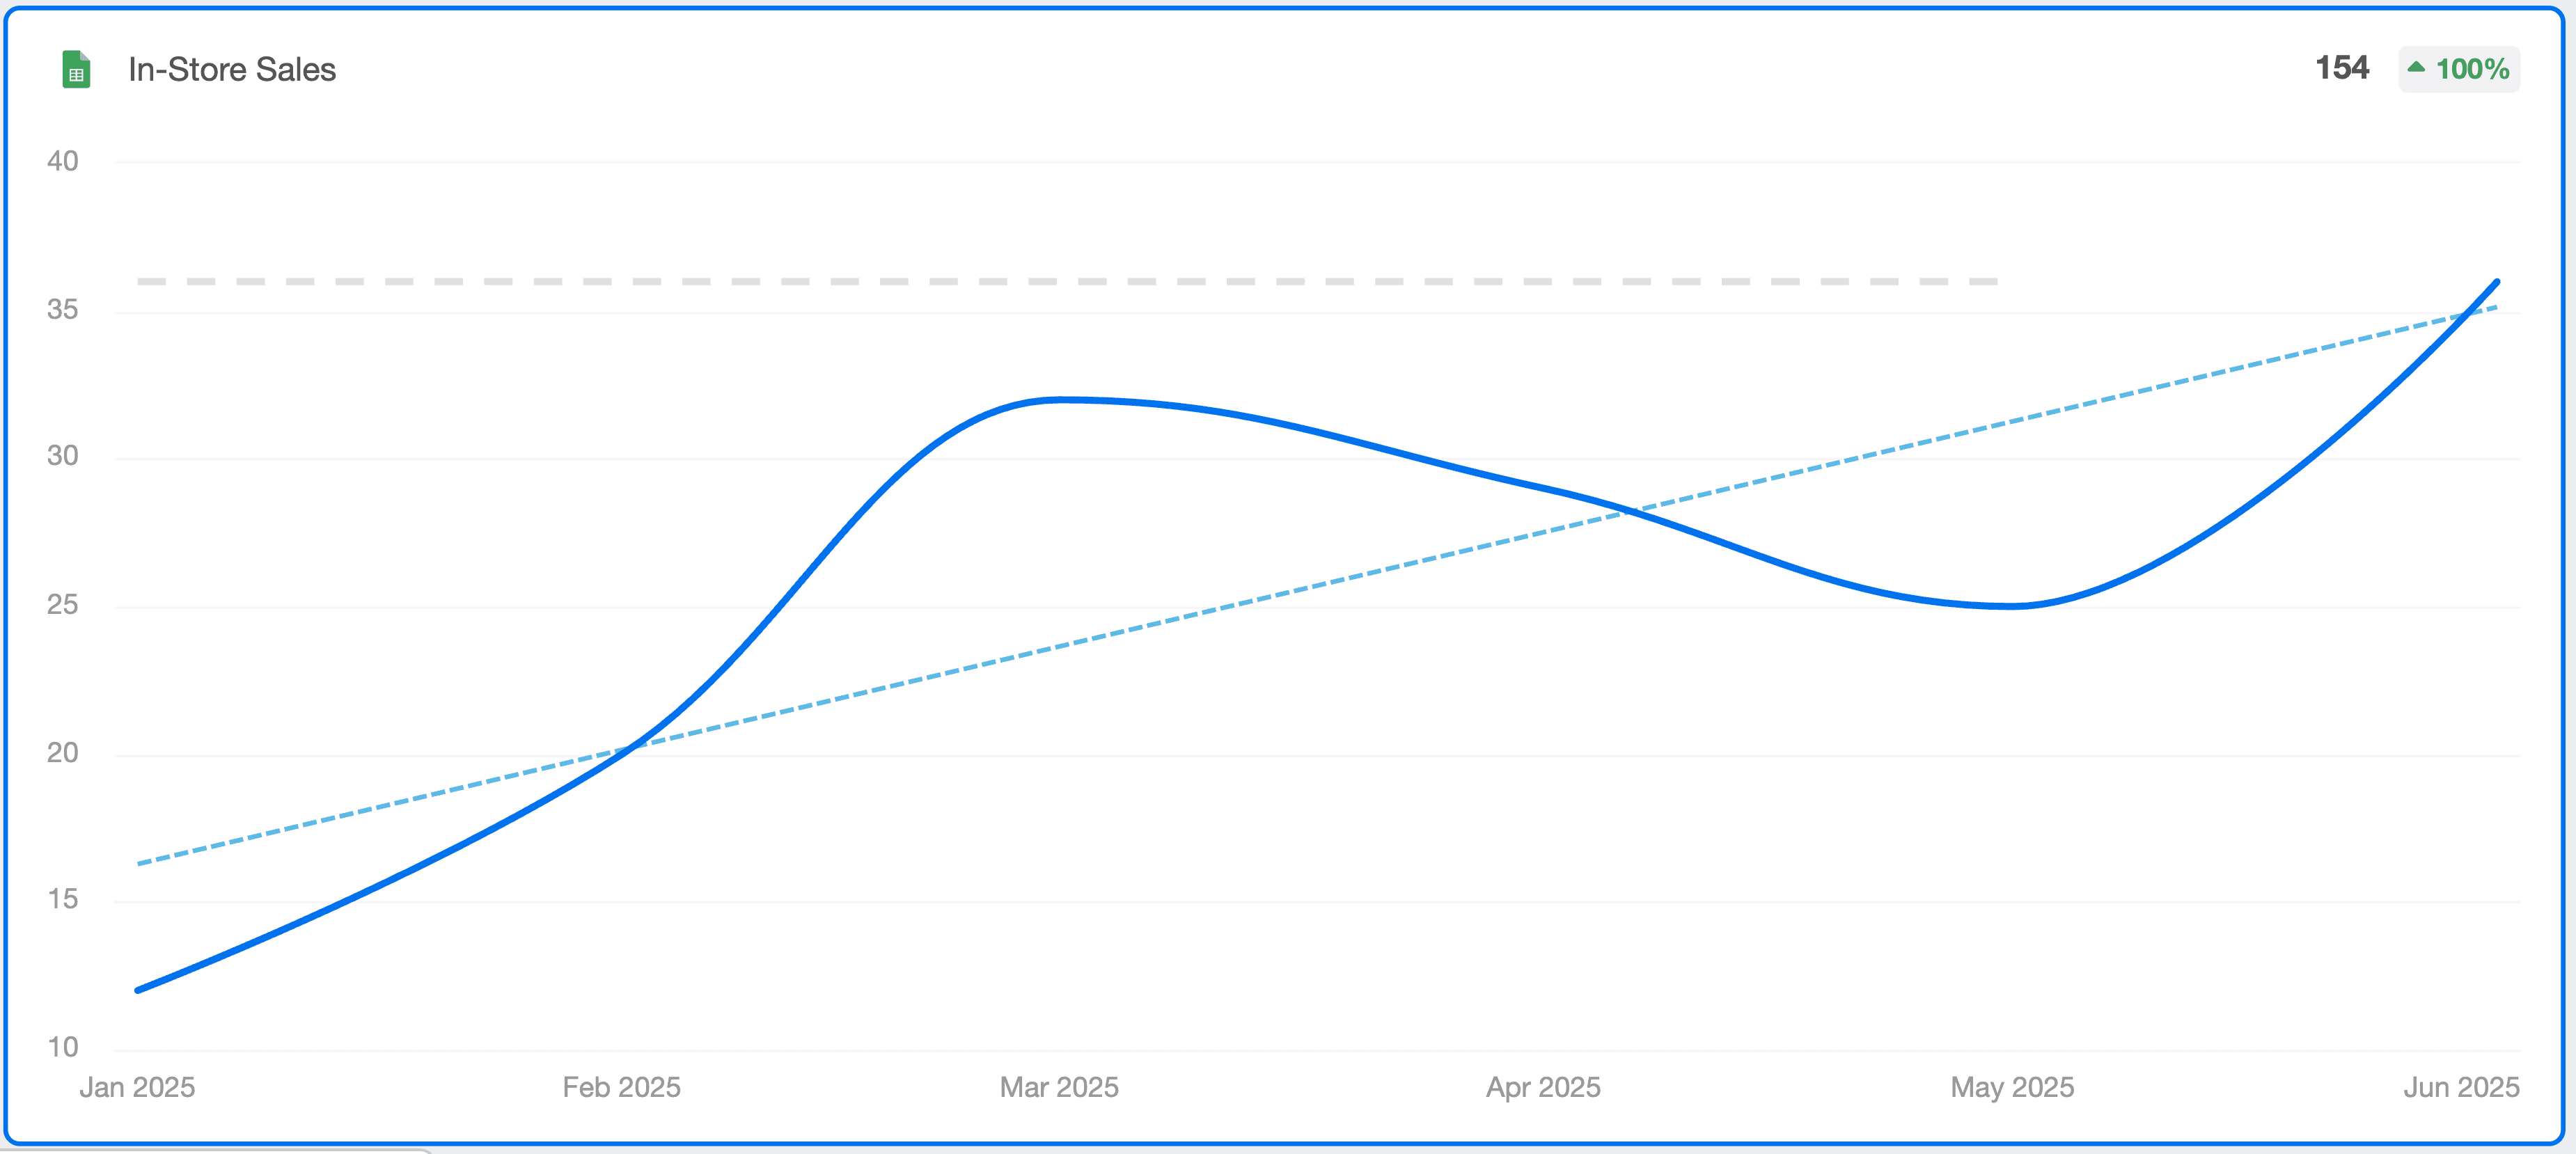
To set up a line chart widget, you'll just need a Google Sheet with dates in one column (in mm-dd-yyyy format, or one of our other date format options), and your data in another column. Then, you'll indicate where those two columns are in the widget's settings. Simple! Here's how the data is set out for the widget above:
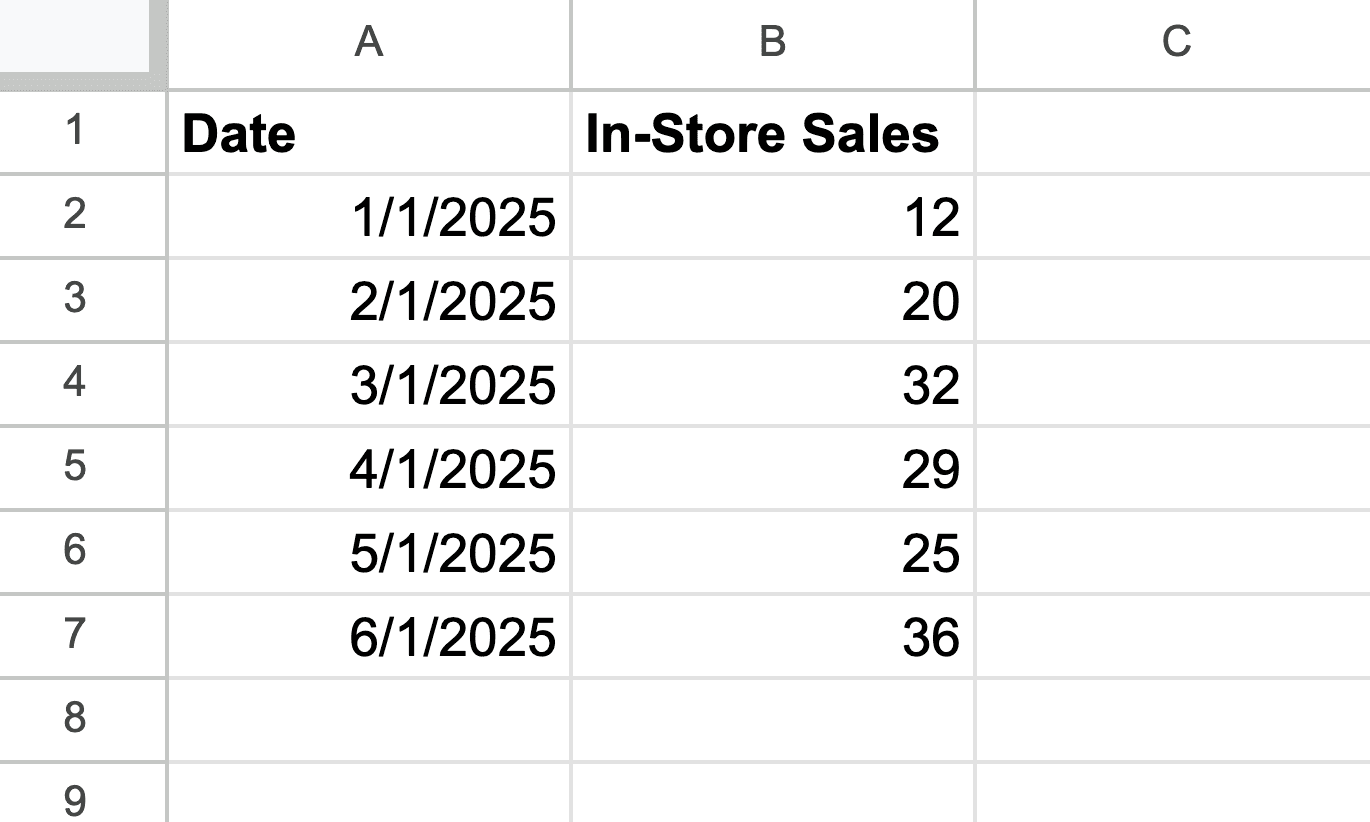
If there's any missing information in your Sheet, we'll simply show zero on the charts for those dates.
Google Sheets Sparkline Chart Widgets
Sparkline widgets give you a small curved line showing your data trend across time, along with a total for that time period and period-over-period change.
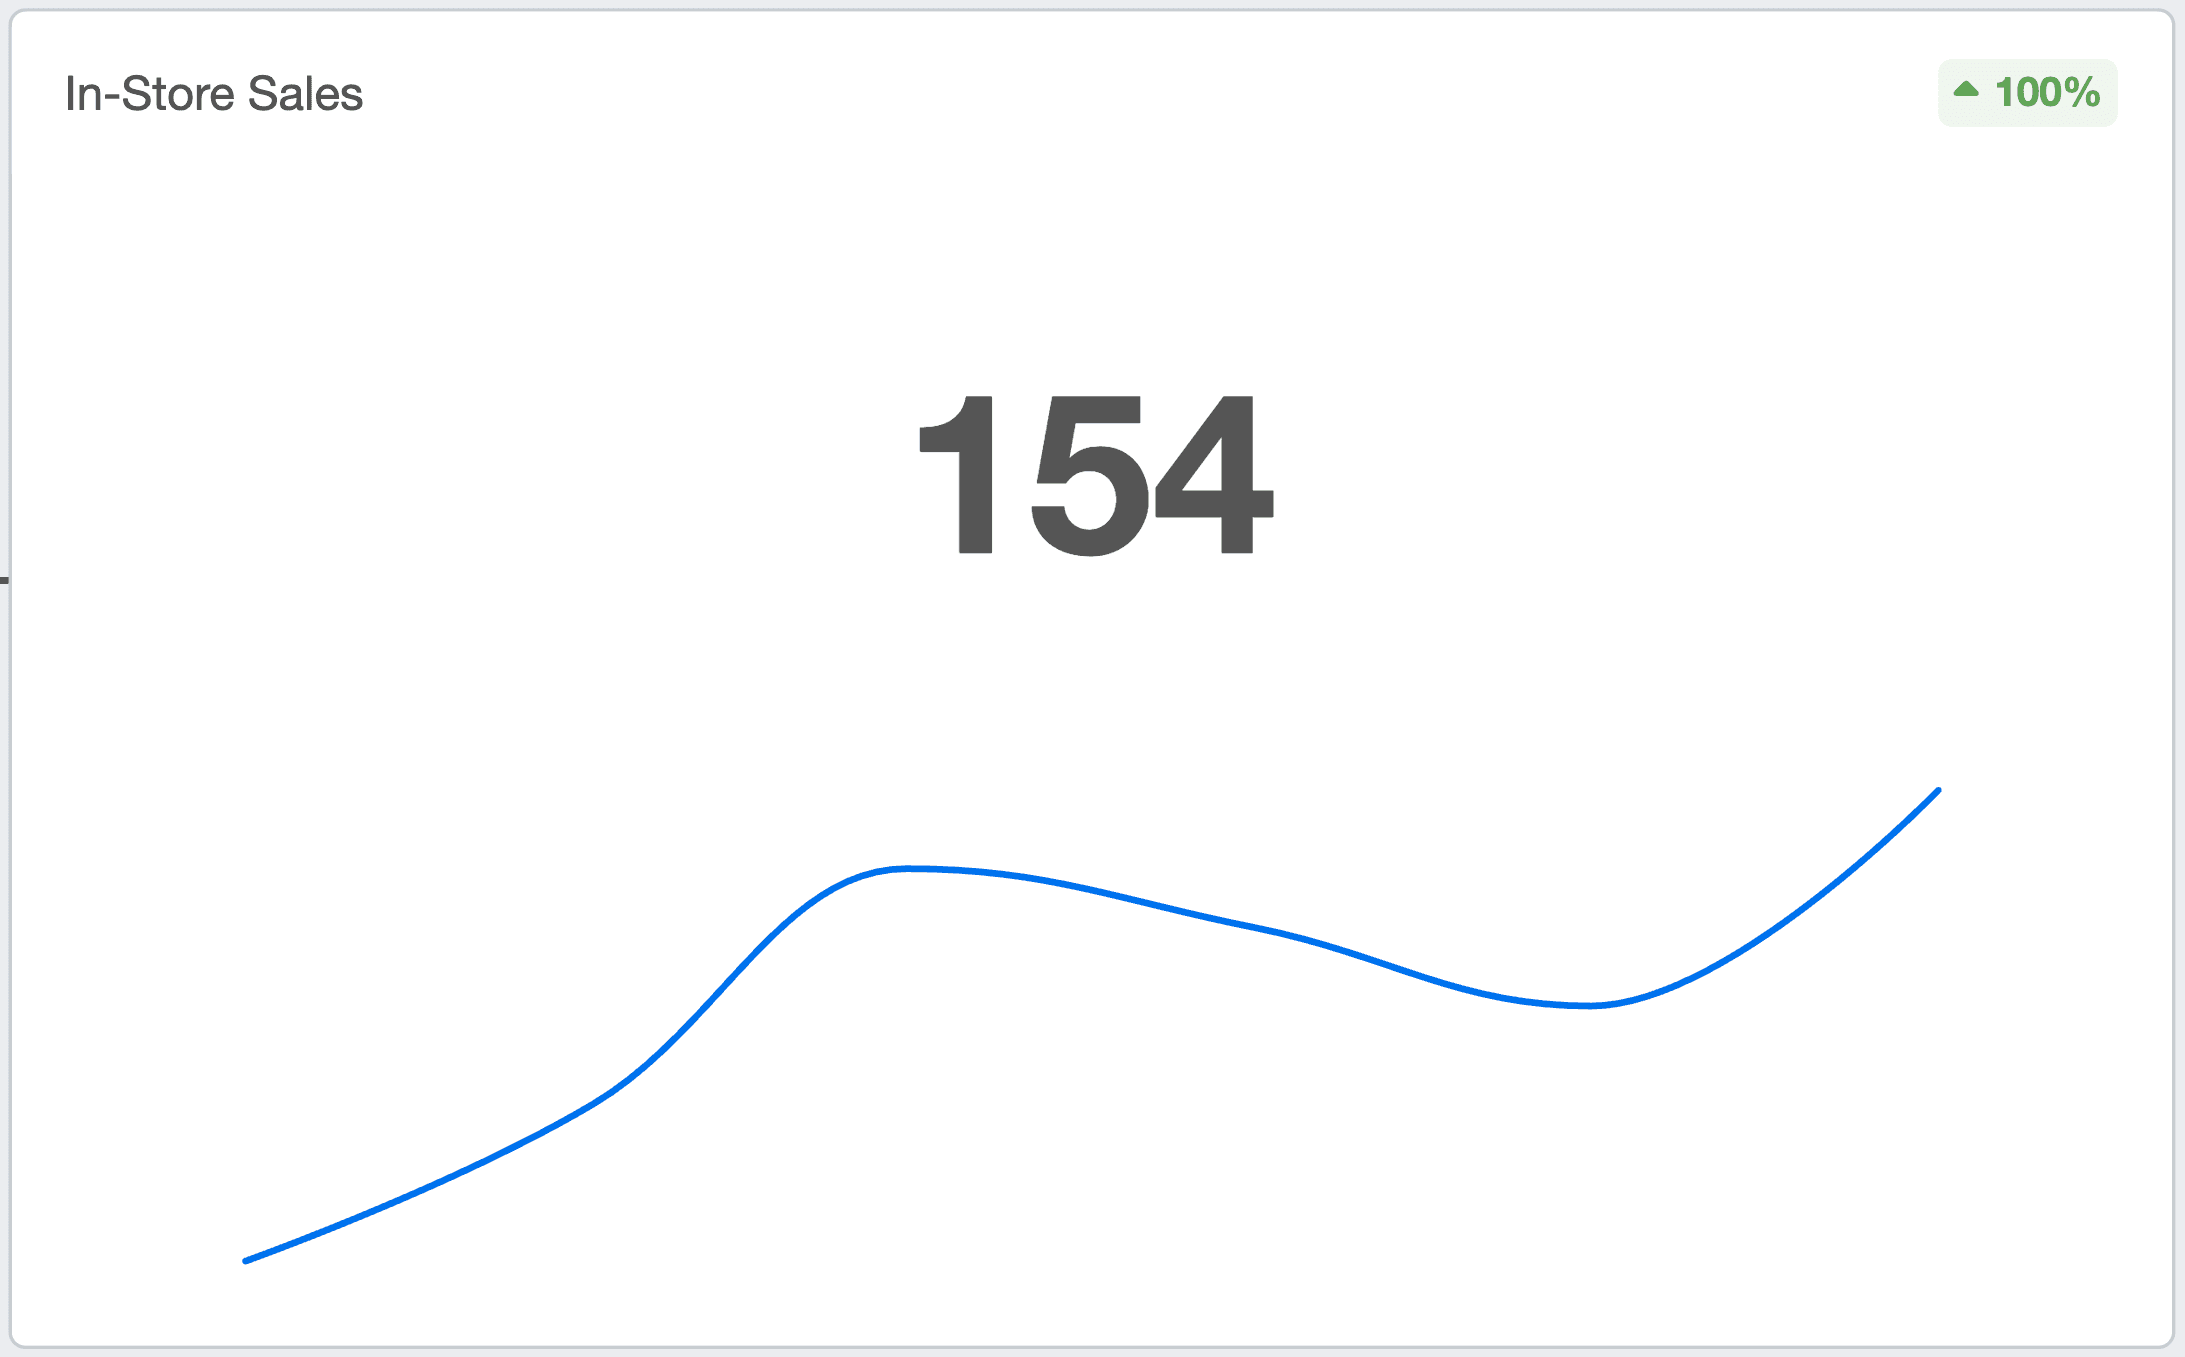
The sparkline widget above is displaying the same data as the line chart widget we just looked at, but this time we've got the sum of that data (154) shown more prominently.
Just like our line charts, these sparkline widgets are date range dependent: The sum (and the small sparkline) will change depending on your selected date range in our platform, so ensure you've got a column in your Sheet with date ranges (in mm-dd-yyyy format, or one of our other date format options) when adding these widgets.
Google Sheets Bar Chart Widgets
The bar charts allow you to show categorical data. These charts are not date range dependent, so you won't need a date column in your Google Sheet.
Here's an example of a bar chart:
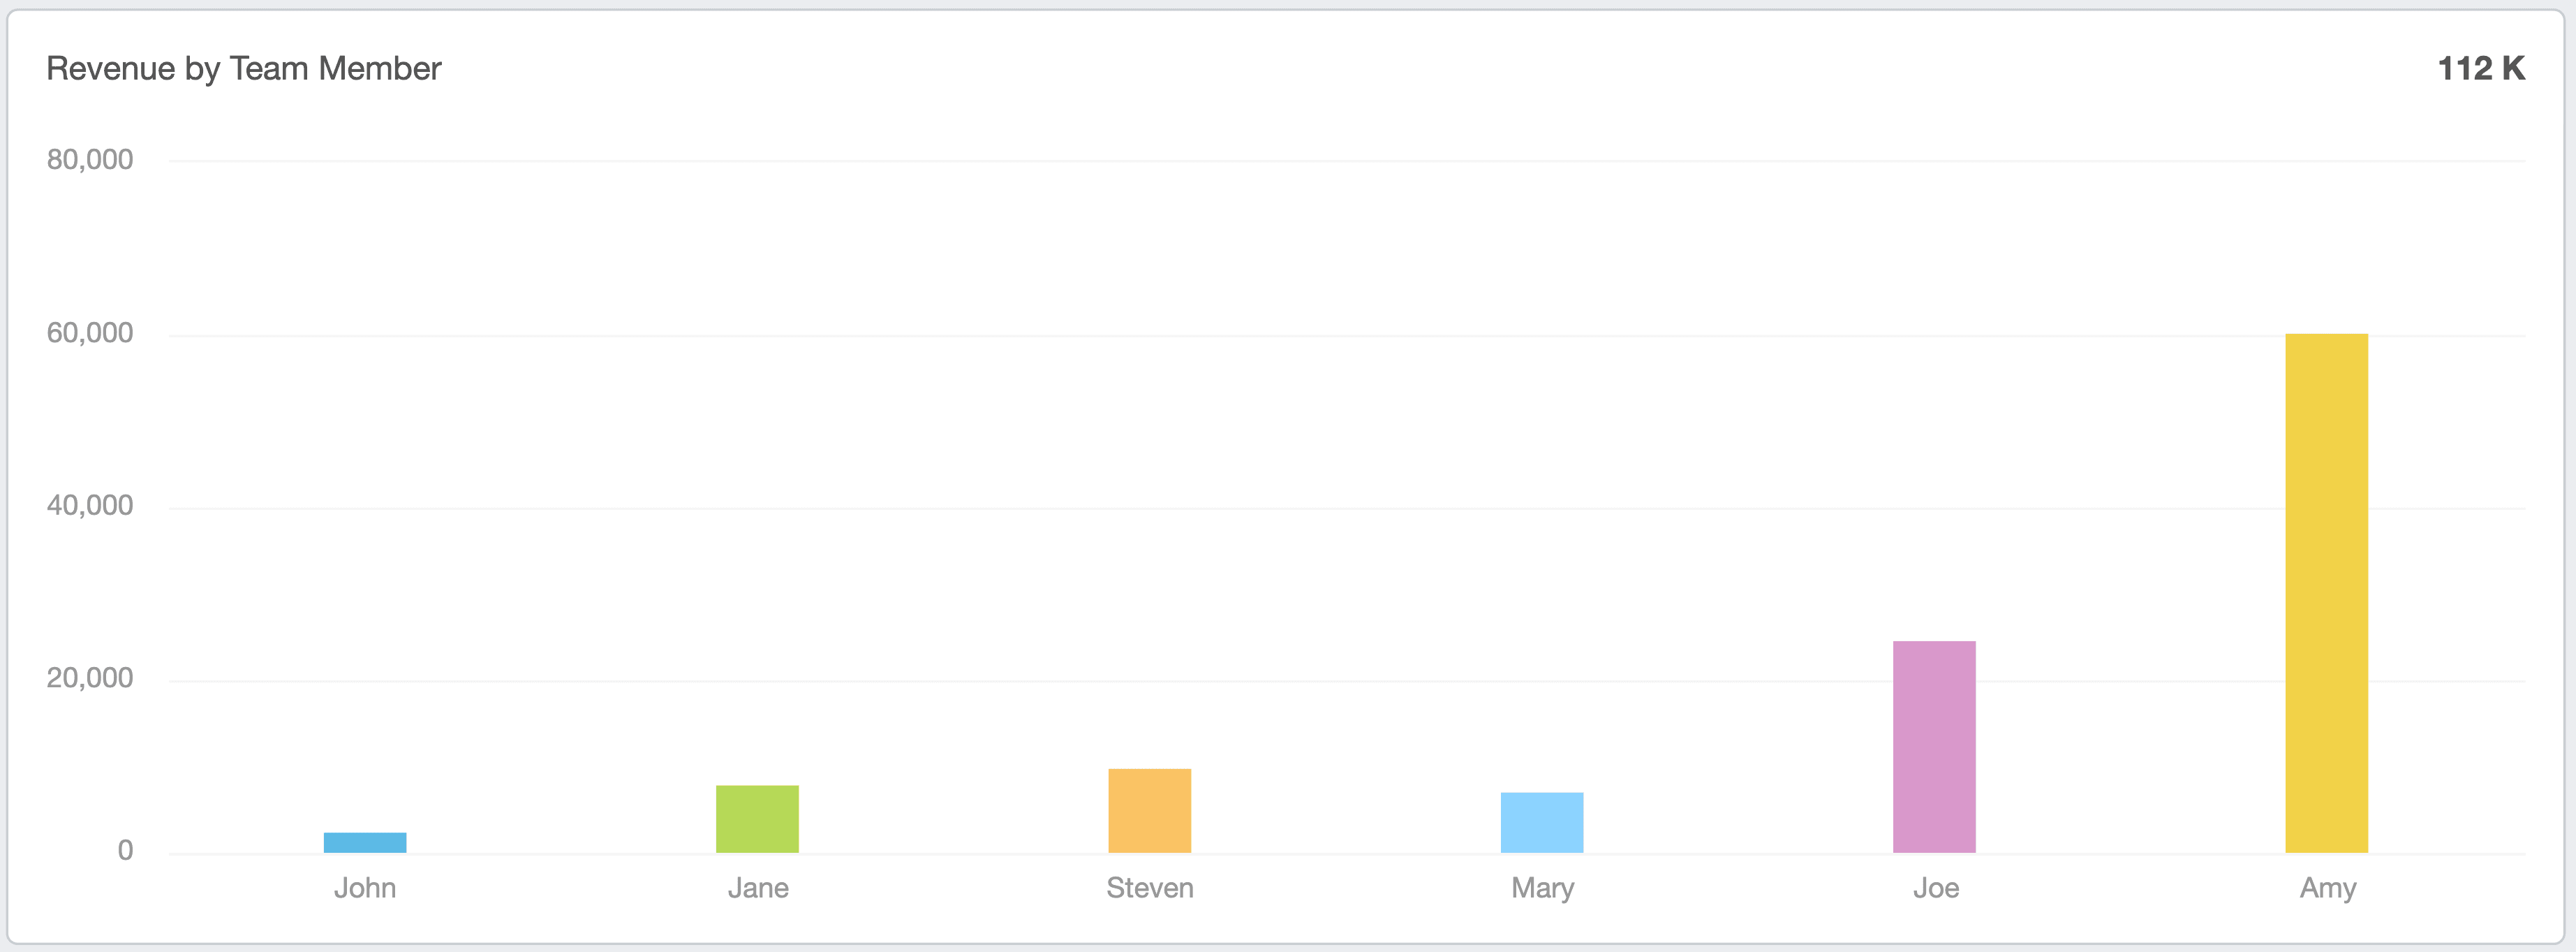
If you hover over any bar in the chart, you'll also see its exact value.
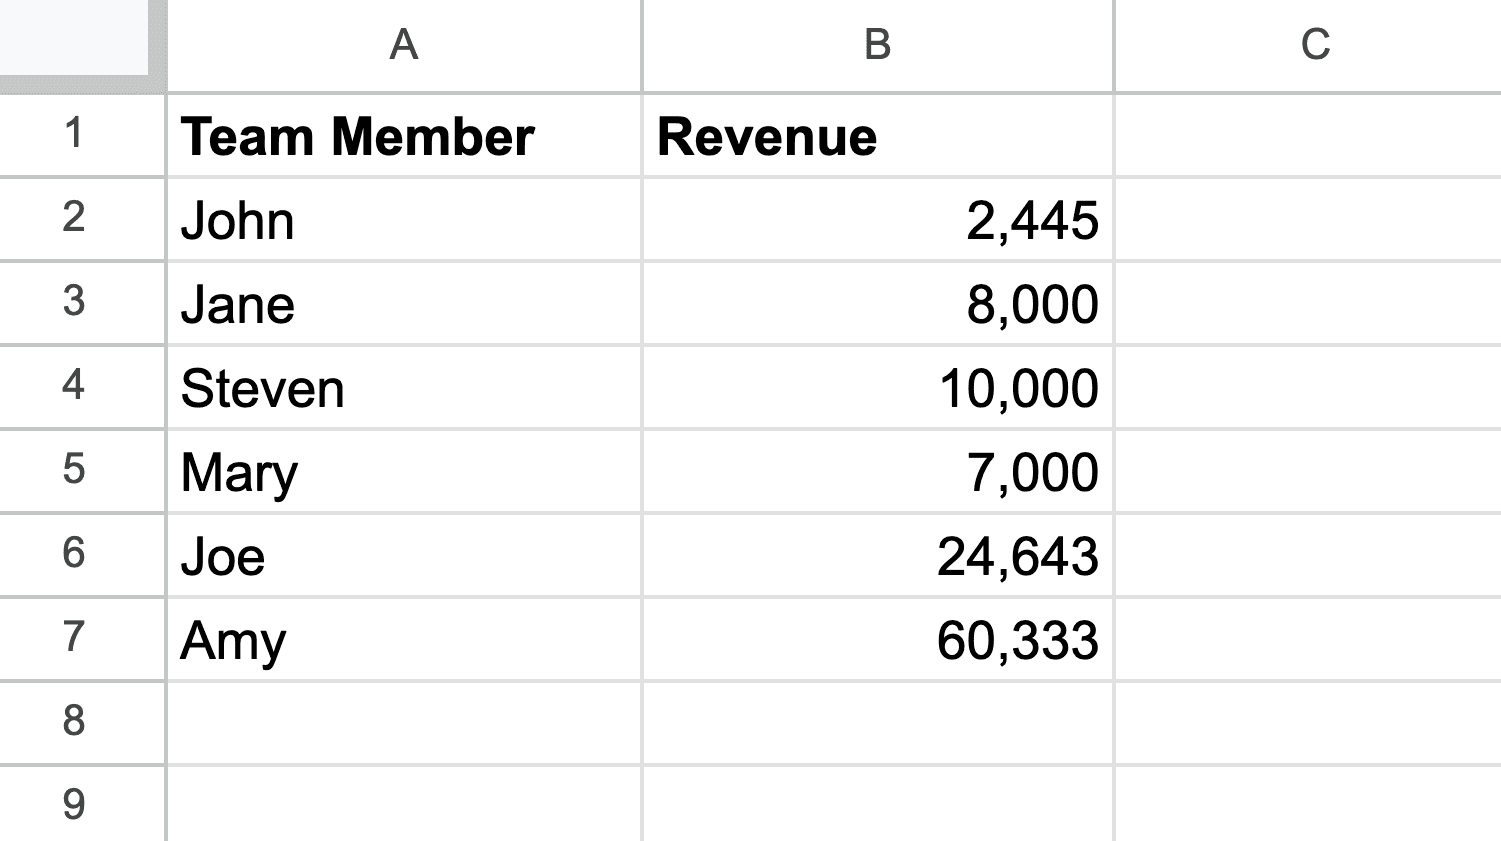
The above example is set up by putting team members' names in one column and their revenue in another. Here's what it looks like in the Google Sheet:
Google Sheets Pie Chart Widgets
The pie chart widgets let you show how each part contributes to the whole. Like bar charts, pie charts are not dated range dependent.
Let's look at the same data as the bar chart example above, but this time in a pie chart:
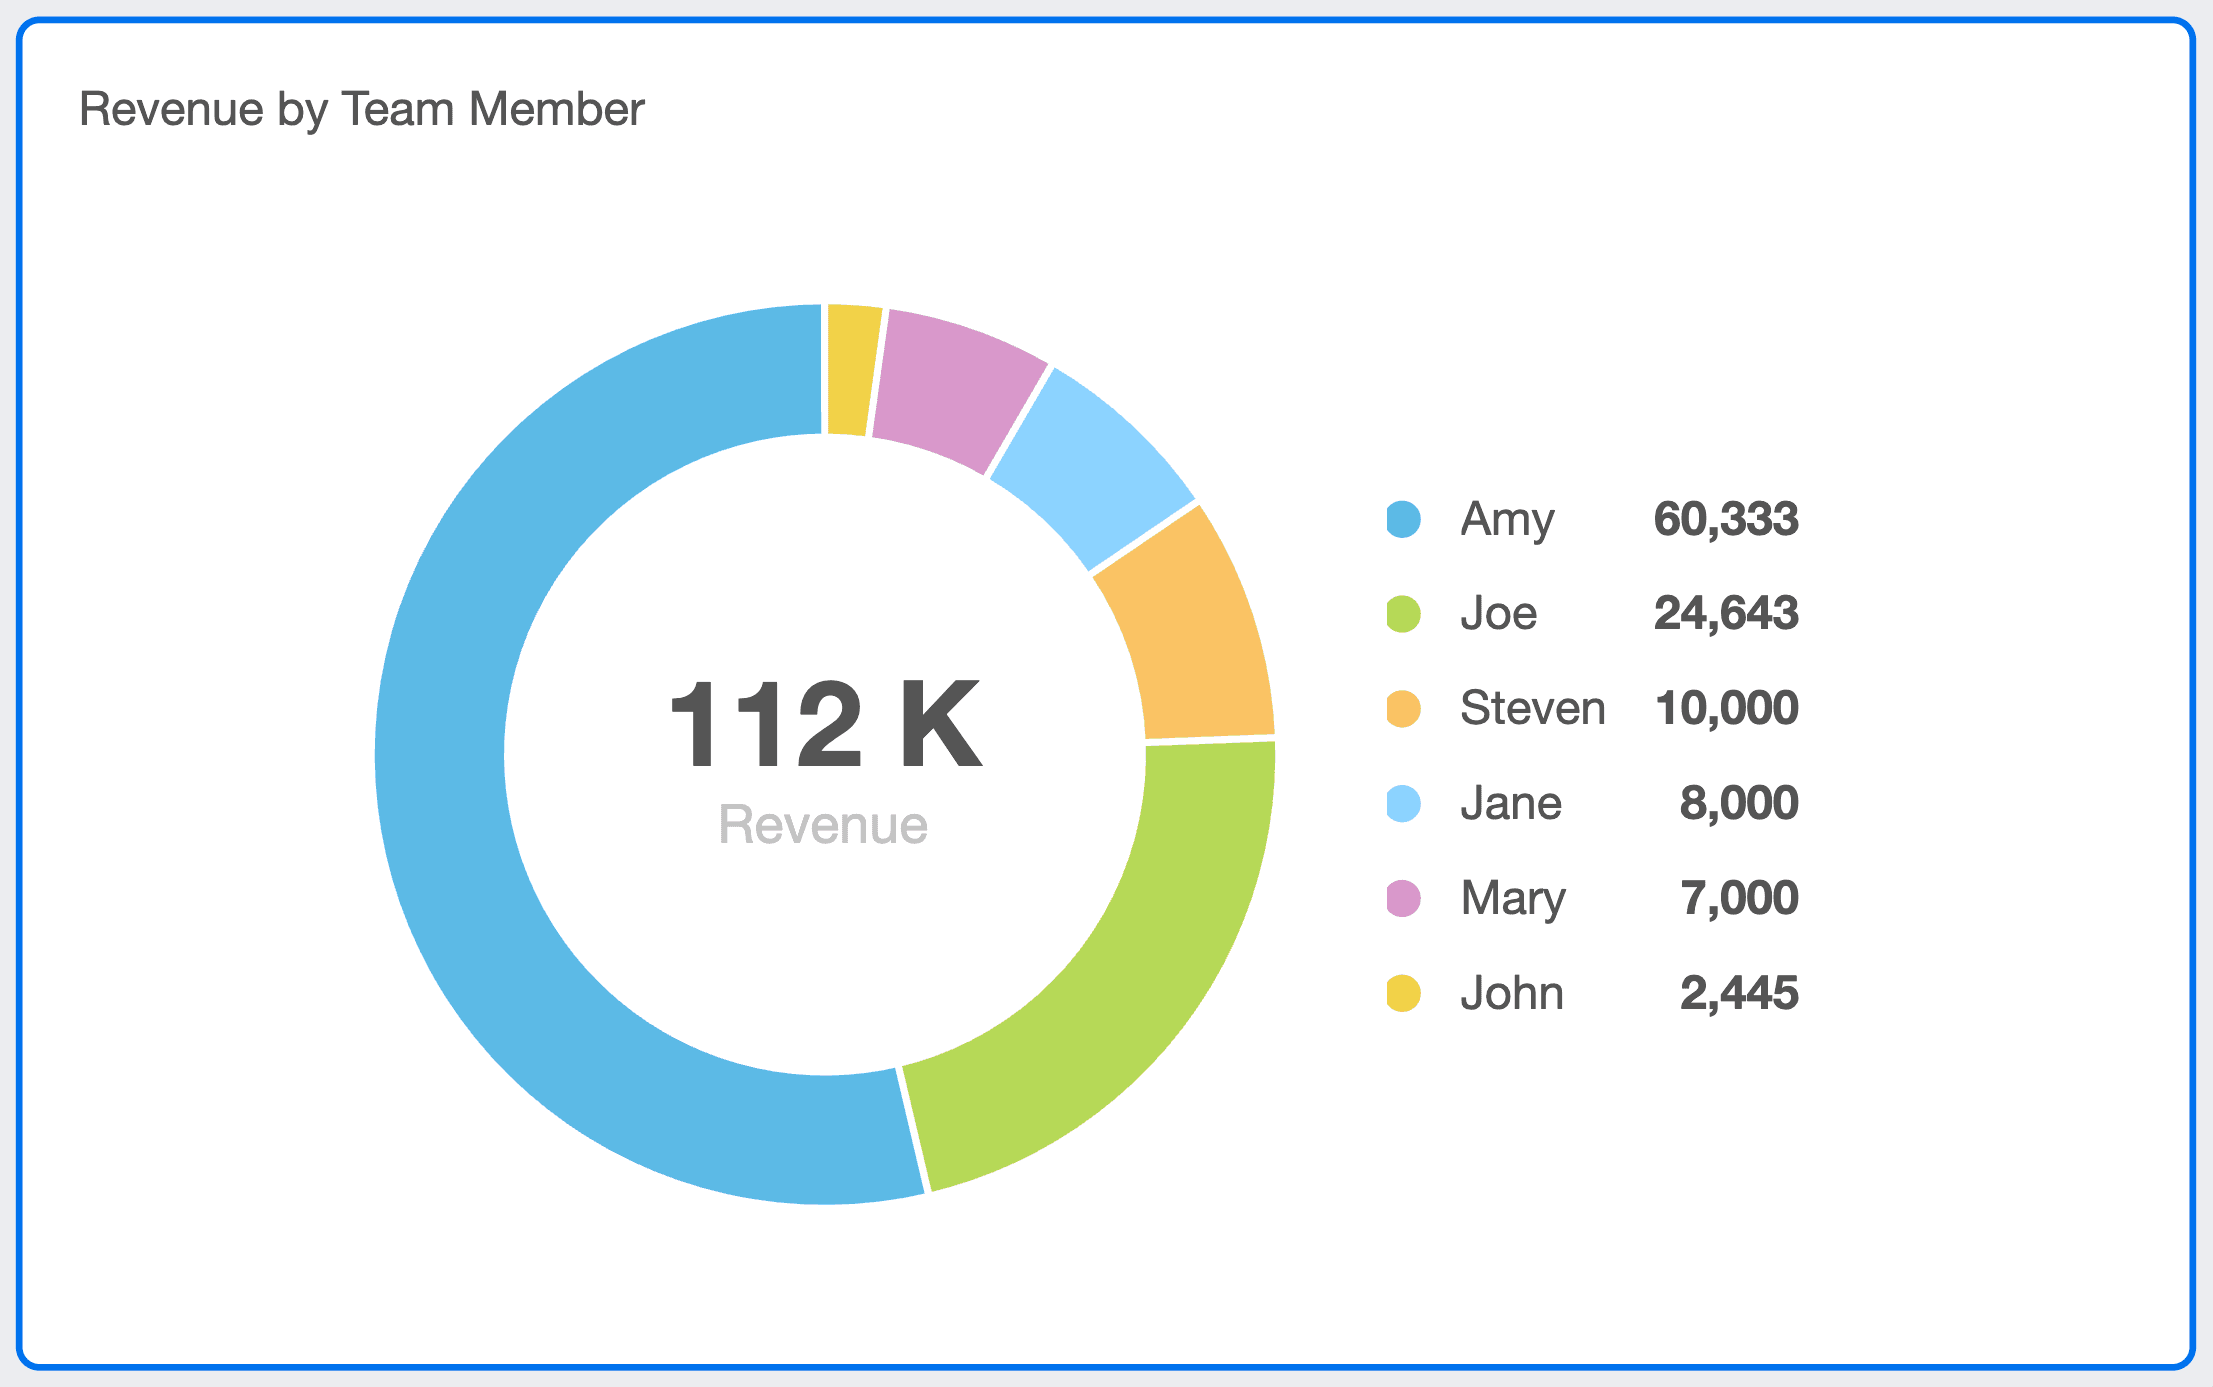
You'll see the sum total in the middle of the pie chart and a clear indication of how that data is split.
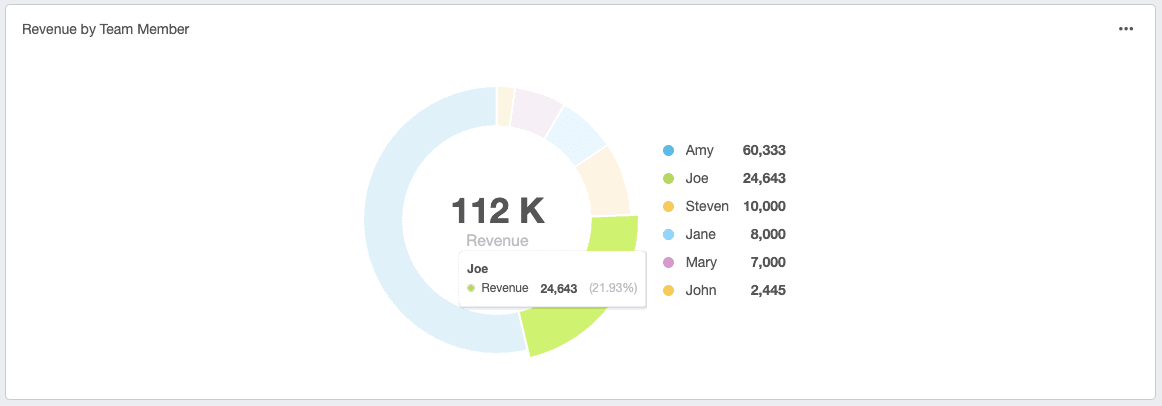
Just like with the bar charts, you can also hover over any part of the pie chart to see the exact amount that each piece is contributing (and the percentage):
Google Sheets Table and Stat Widgets
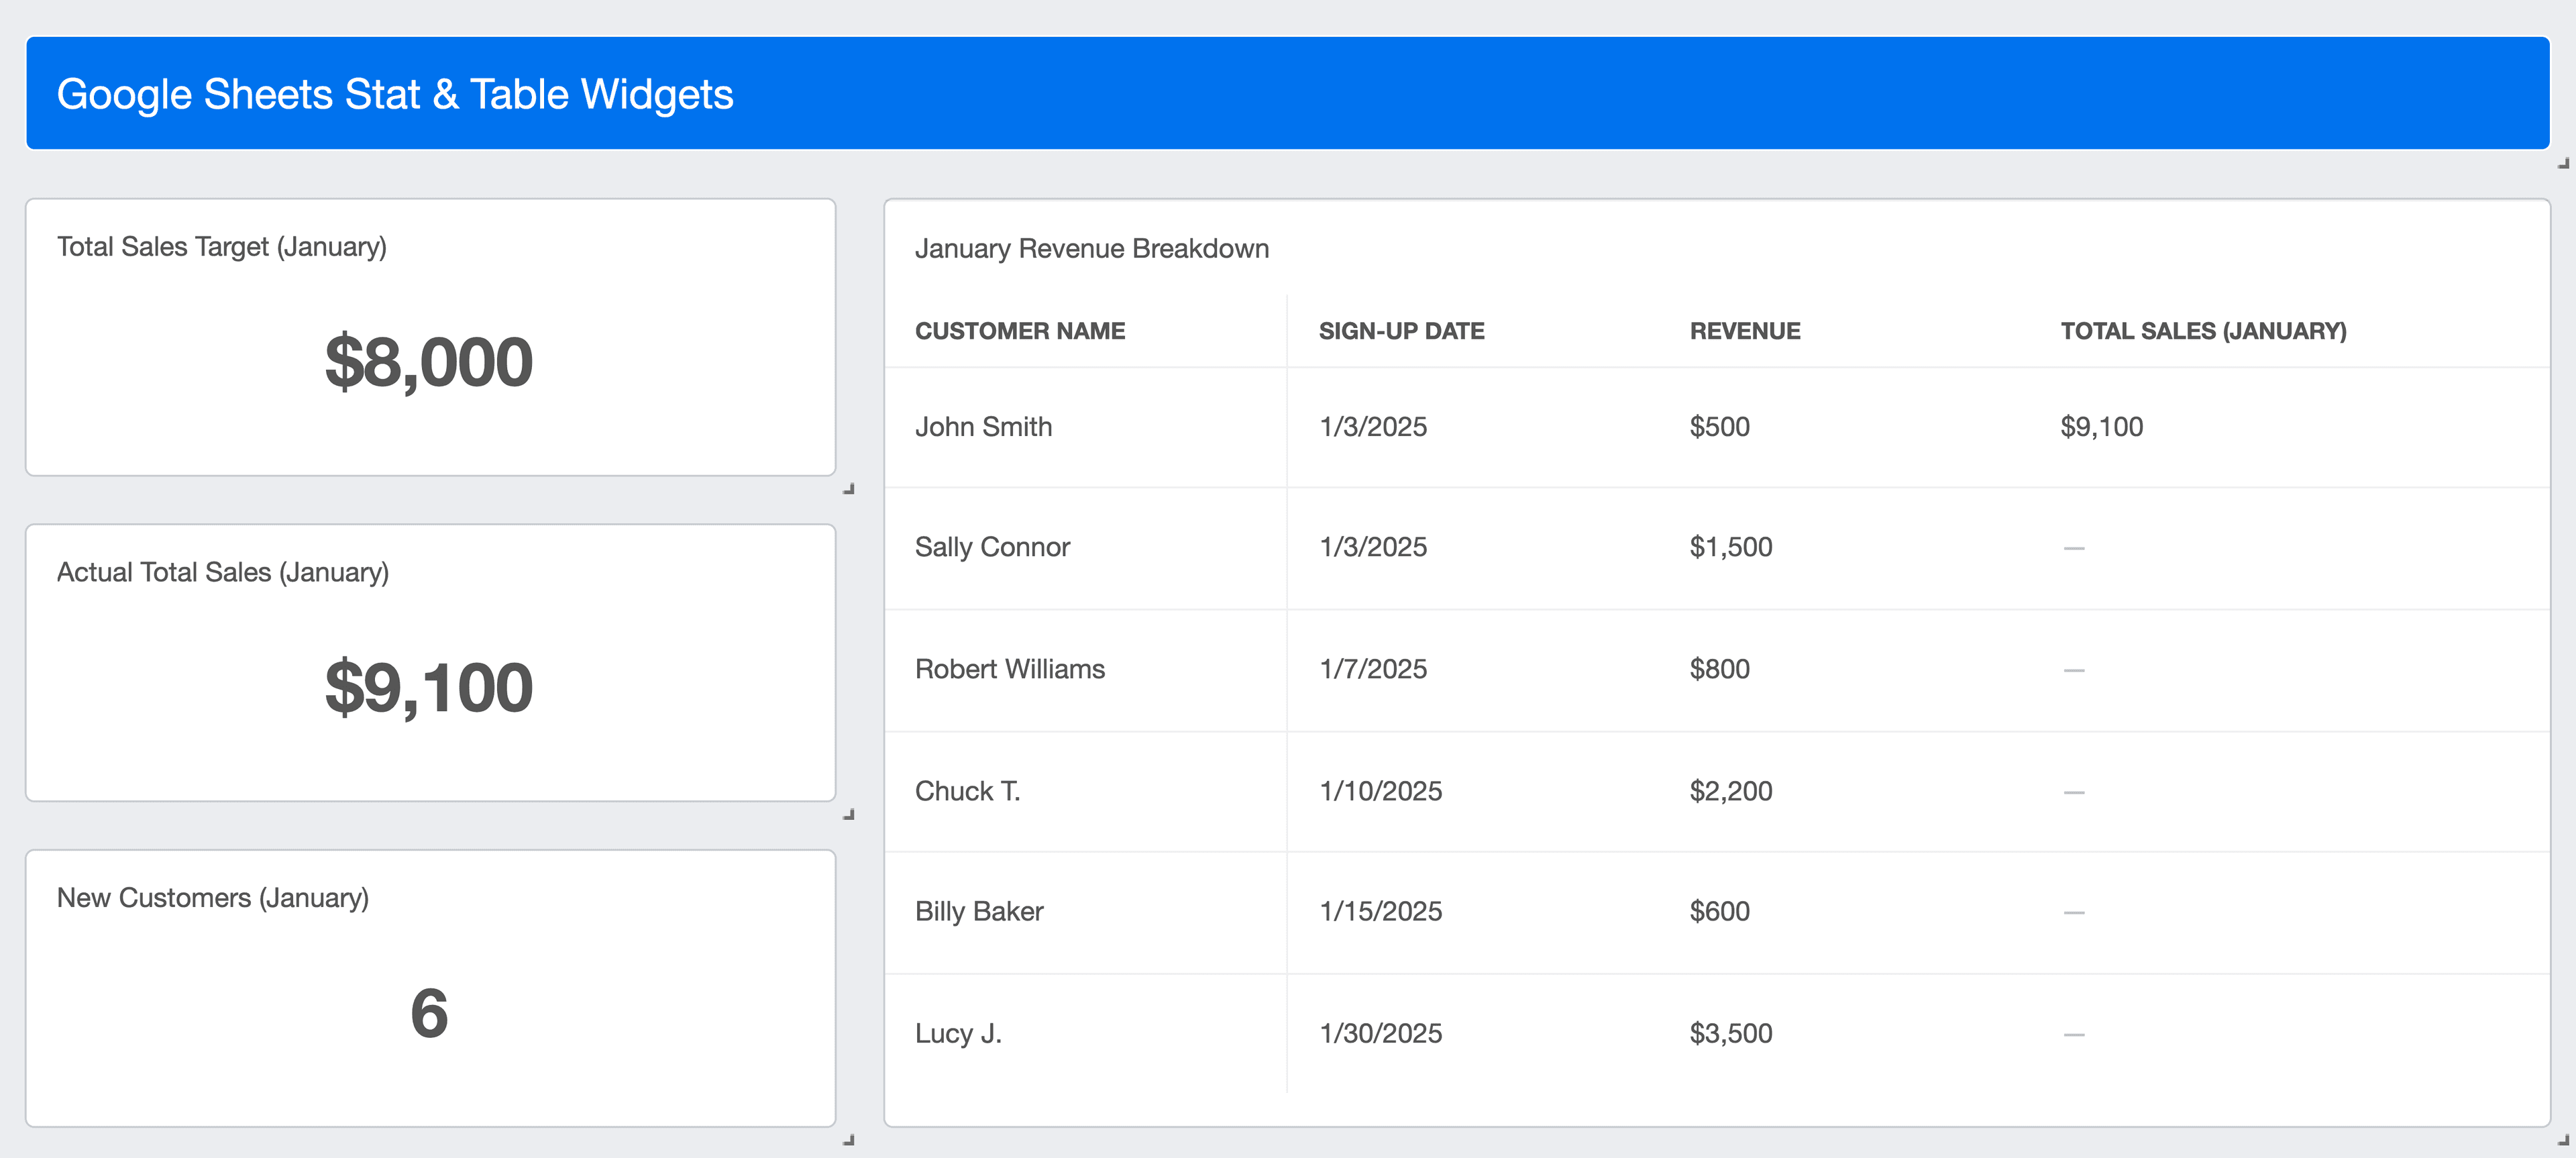
Show the full contents of a Google Sheet via table widgets. Table widgets are perfect for giving highly detailed information, like a competitor analysis or sales data from a CRM tool.
You can also show data from one specific cell within a Google Sheet via stat widgets. These are great for giving easy-to-digest totals, targets, or a few words of written information.
Here's what the table and stat widgets look like:
Setting Up Google Sheets
If you haven't been using Google Sheets with AgencyAnalytics yet, it's super easy to get started.
Step 1: Get your data into a Google Sheet (either by entering it manually or via an automation tool like Zapier).
Step 2: Integrate your Google Sheets account with AgencyAnalytics.
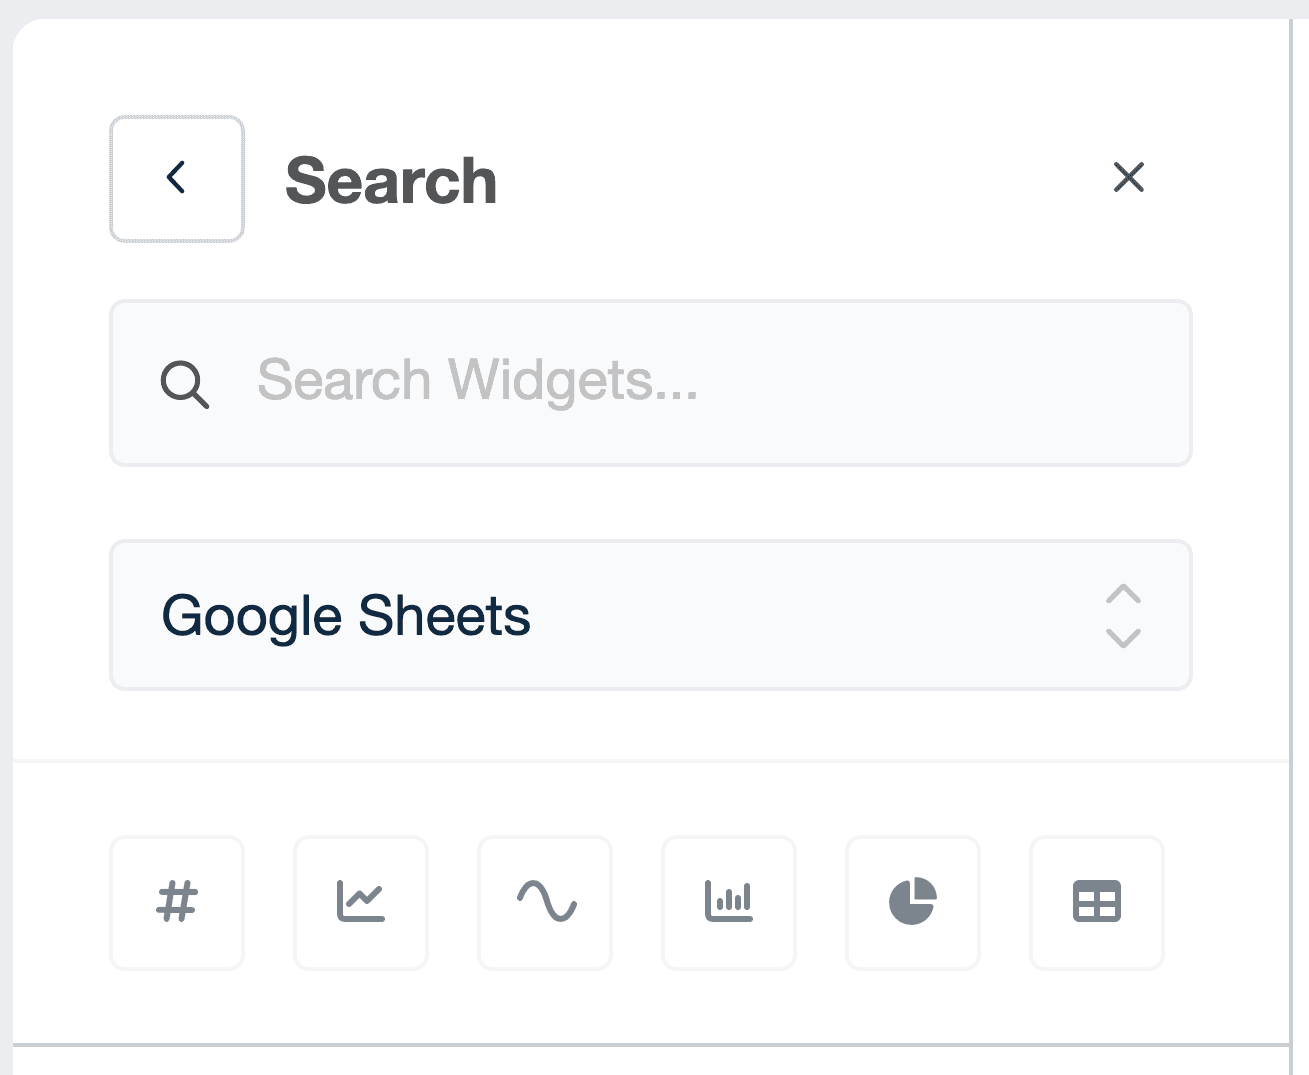
Step 3: Create stunning charts, tables, and other widgets with your data, then share this with clients! Add Google Sheets widgets to custom dashboards or automated marketing reports. Search for "Google Sheets" (or even just "sheets") when adding a widget to quickly find them.
Need More Help Setting Up Your Google Sheets Integration?
We've got some detailed knowledge base articles covering our Google Sheets integrations. To set up a date range in your widgets, see here. Also, here's a full overview of our Google Sheets integration.
Export Data to Google Sheets
Need to send your client's marketing data to Google Sheets for extra handling and analysis? Checkout out the Google Sheets Export Extension: The easiest way to get your marketing data from over 80 top marketing platforms into Google Sheets.
More Exciting Updates Coming Soon!
Our team is hard at work on some more big features and new integrations, so keep an eye out over the next few months.
If there's anything you would like to see (or if you have any questions about today's updates), don't hesitate to contact our friendly customer support department. Let us know what you think of our Sheets update in the comments below!
Impress clients and save hours with custom, automated reporting.
Join 7,000+ agencies that create reports in minutes instead of hours using AgencyAnalytics. Get started for free. No credit card required.

Written by
Matt brings over a decade of experience managing customer-facing teams, projects, and research across a wide range of industries. He now leads the customer support and customer success departments within AgencyAnalytics.
Read more posts by Matthew DavisSee how 7,000+ marketing agencies help clients win
Free 14-day trial. No credit card required.


