YouTube Dashboard
Why You Need to Use a YouTube Dashboard
Every agency owner knows how time-consuming generating social media reports or changing from one account to another can be, spending hours trying to ensure the performance data you are about to present to your clients is correct.
Don't waste precious time with tedious manual reporting, create social media dashboards in minutes. Simply connect your clients' YouTube accounts and manage multiple accounts with just one interface!
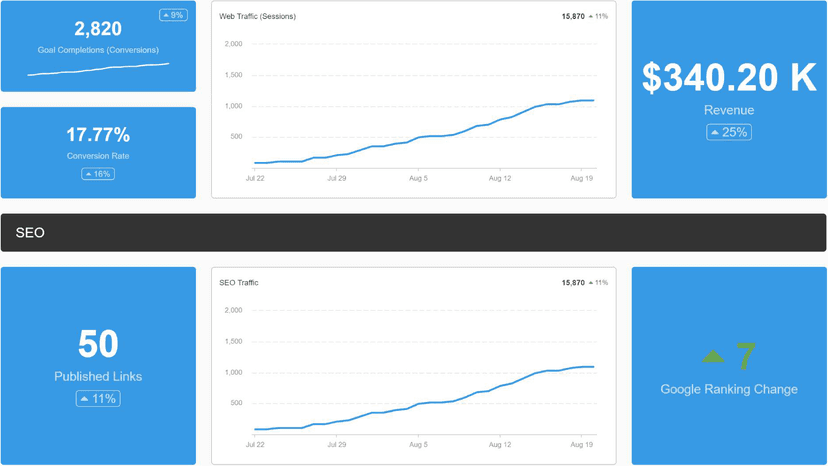
The customizable YouTube Dashboard gives you the ability to measure key metrics, and create reports based on the performance of your campaigns. It also gives your clients the ability to see the performance of your campaigns in real-time, allowing them to see their video marketing performance on the fly.
Easily Track All Your Client’s YouTube Metrics
Start Your Free Trial Today!Monitoring and analyzing the right YouTube video metrics is a necessity for the success of your campaign and overall video strategy. You need to be able to identify key metrics to measure the performance of your client's YouTube account and the videos featured on the accounts.
What are the YouTube metrics you need to focus on to ensure effective analysis of your campaign performance?
Let's have a look at them.
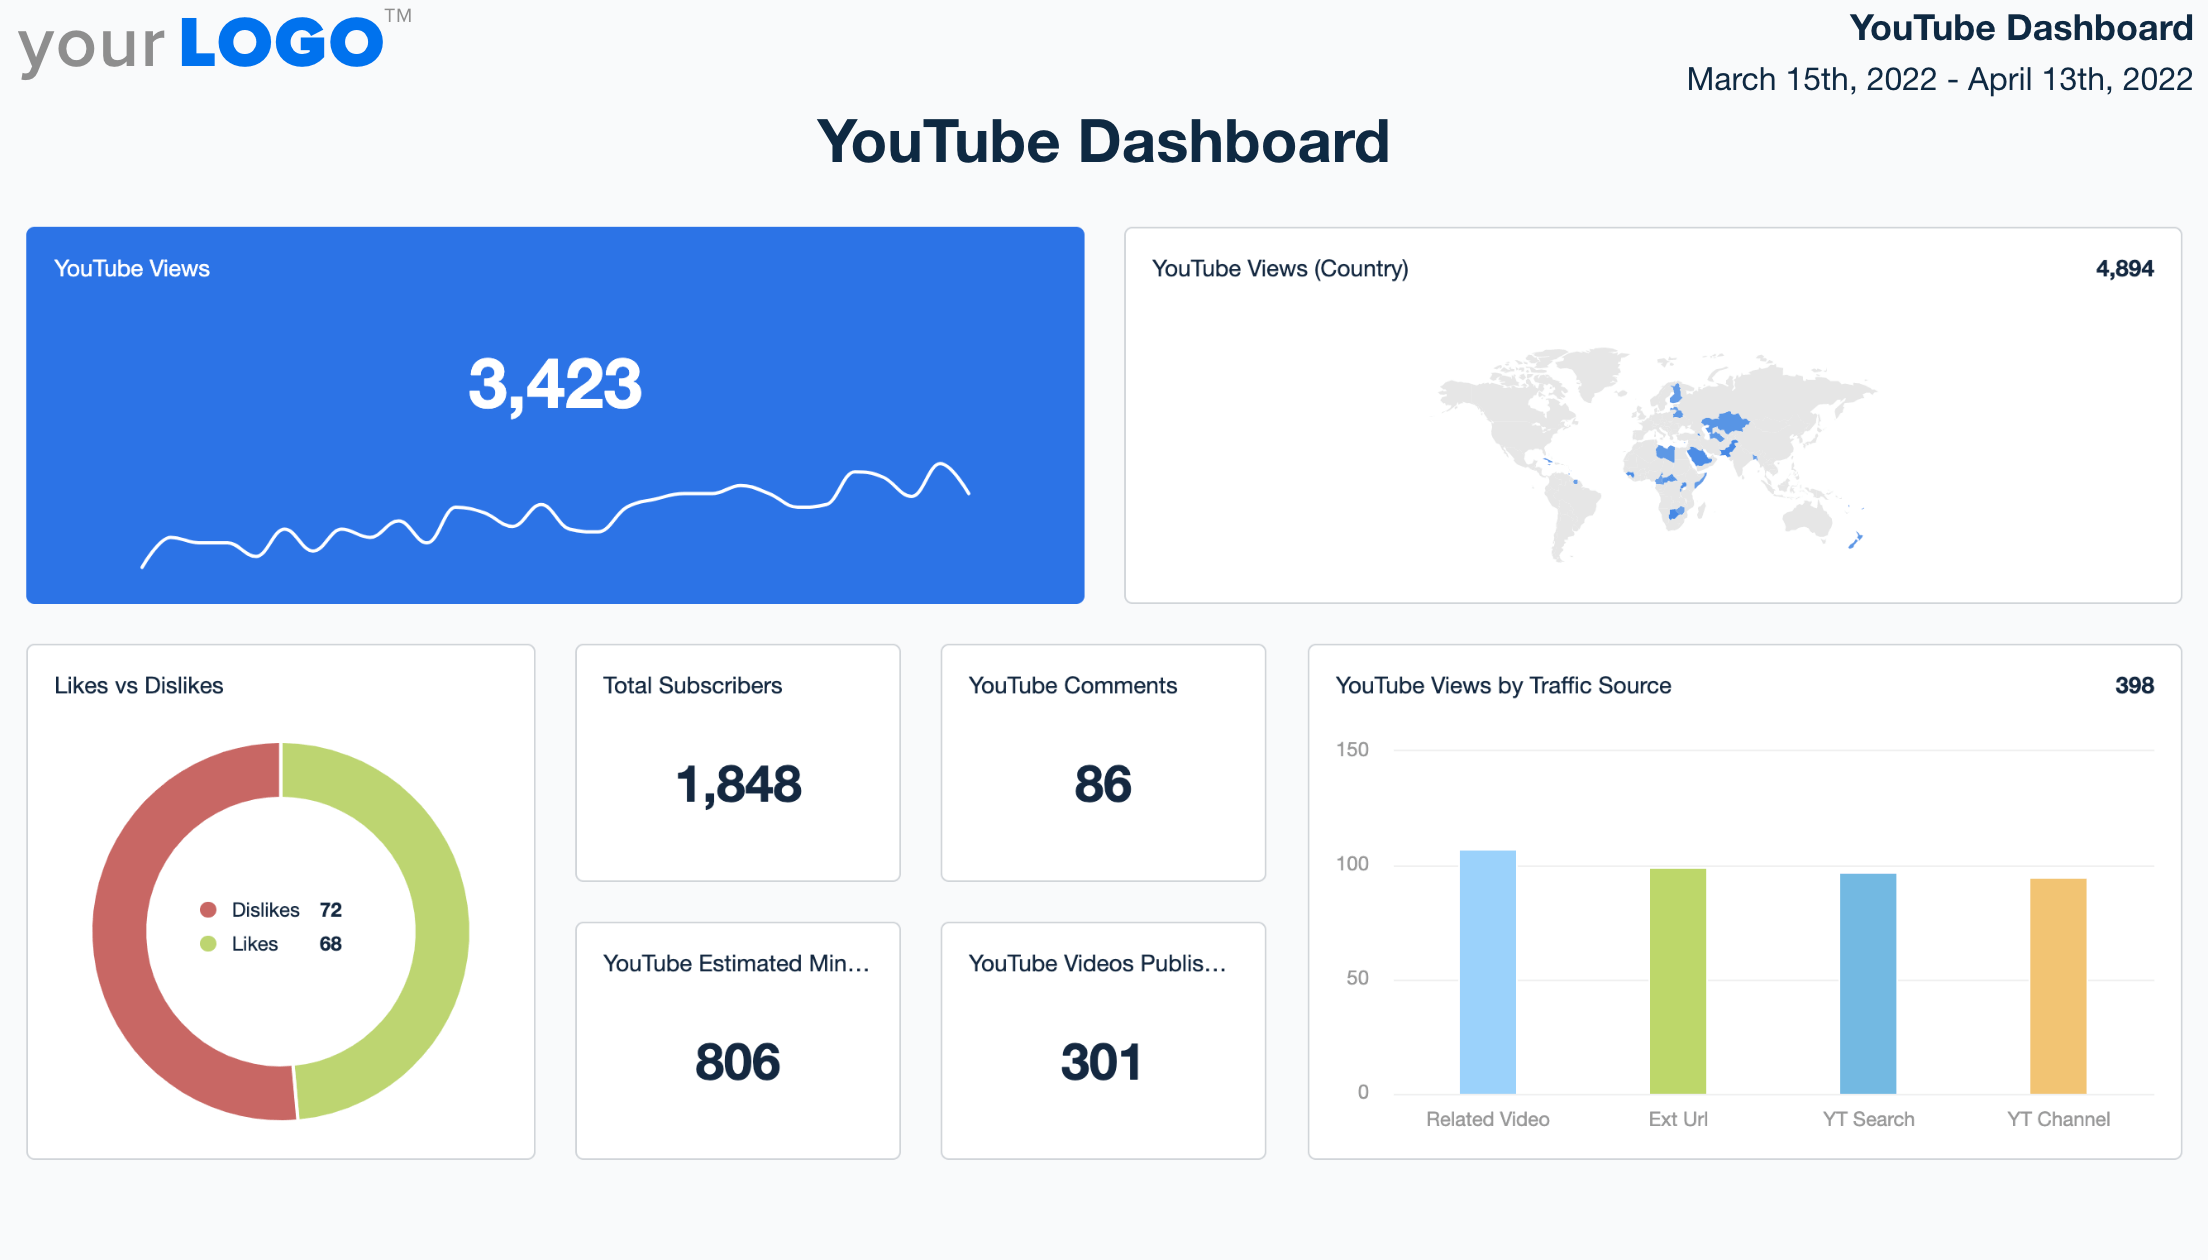
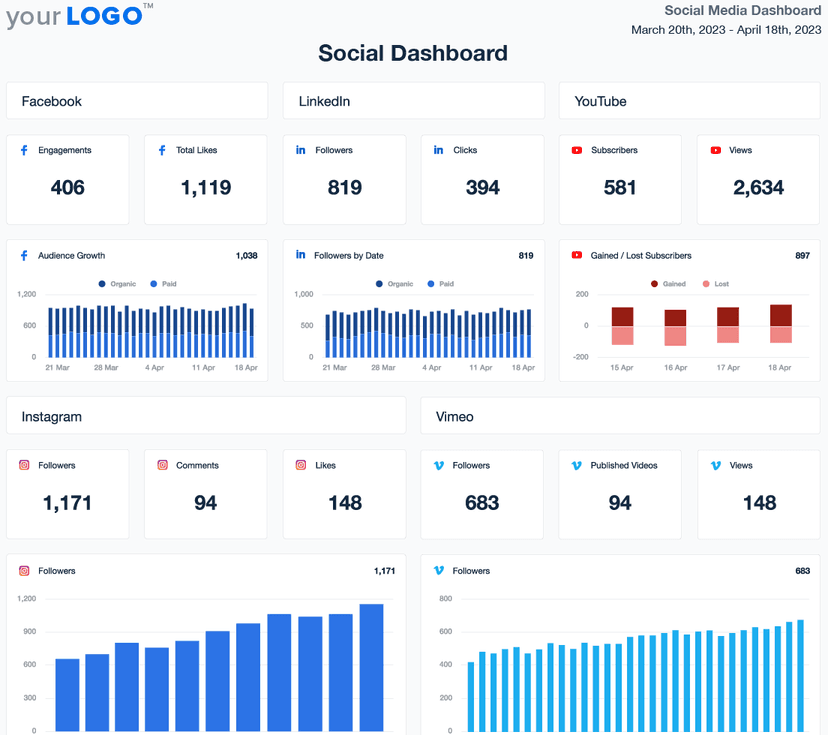
What's Included In the Customizable YouTube Dashboard Template
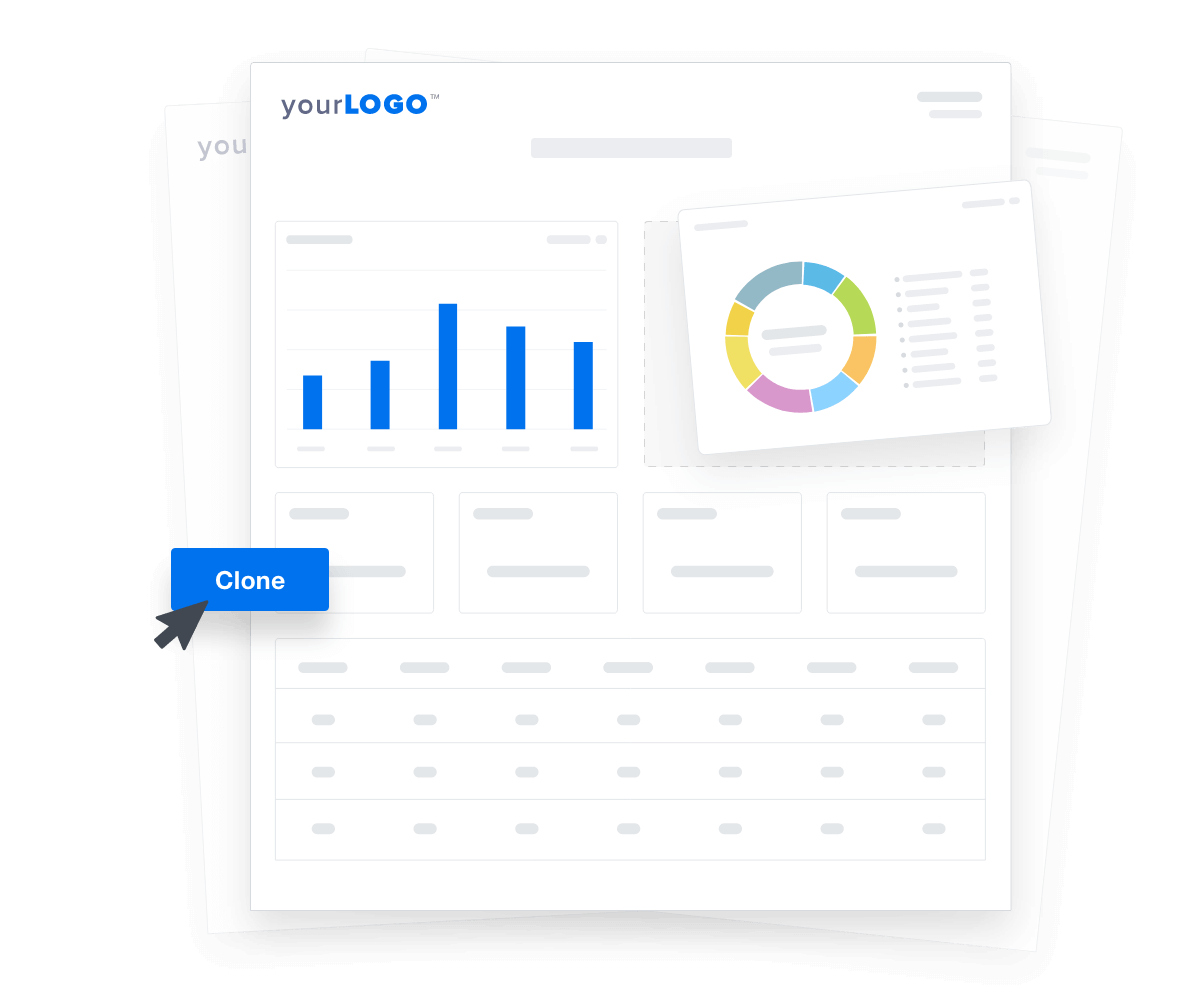
Think of the YouTube dashboard template as a launchpad for your client reporting. It provides a solid structure that easily adapts to fit each client's specific needs. No more building reports from scratch!
The customizable template includes some of the most important YouTube metrics to track, including:
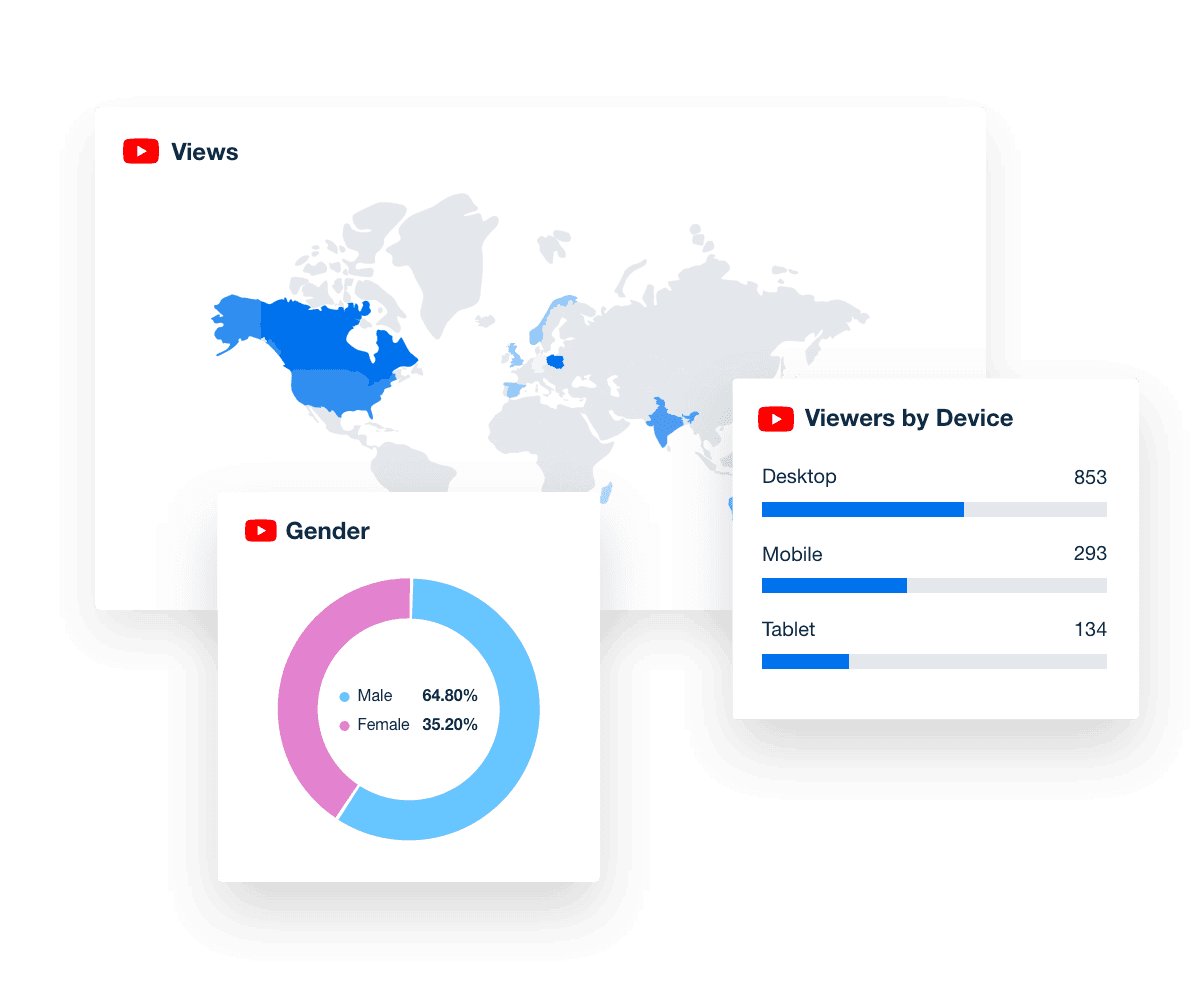
1. Views
The view metric is a self-evident one. It measures the number of times web users have watched your videos. However, with YouTube, it's a bit more complicated.
YouTube counts a view only when it considers it a legitimate one based on its algorithm. This means that the platform only records views of YouTube content when a user intentionally plays a video.

The only problem with this metric is that it can be misleading without other video performance metrics. Creating a video content strategy solely around which types of videos are generating views can be short-sighted.
After all, YouTube views do not mean that users interacted with the video or retained its content. All it shows you is that they chose to click play. While it should be a key metric you look at, pair it with others to get a better picture of what's going on.
Engagement metrics are also critical: imagine one of your videos has 100,000 views with likes or comments of just 0.1%. It would tell you that while users are watching your videos because of an initial attraction to the subject, or perhaps the video title caught their attention, but the content wasn't strong enough to encourage them to engage.
2. Subscribers
When you generate reports for your clients, one of the metrics they are interested in is subscribers. This is because the subscriber metric is one that measures the YouTube channel performance, audience retention, and growth rate. If your subscribers are not increasing it means people are not finding your content relevant or entertaining enough.

When a user subscribes to your channel, it means they have gone beyond just liking or commenting on your videos but have committed themselves to the content you produce.
This metric also helps you to predict future engagement rates as subscribers will engage with the content you put out.
3. Likes
The likes metric in your YouTube Dashboard is another engagement metric. It shows that your audience approves of your content and enjoyed it.

It's crucial to understand that likes help to boost the visibility of your video and rank your videos on search engine results. This will end up being extremely beneficial if you monetize your clients’ videos as visibility increases views.
Monitoring this metric will also help you understand what your audience is looking out for. More likes mean that a lot of users are looking for that kind of content.
4. Dislikes
The dislike metric is one you would not want to see in high numbers. It means one thing; users do not approve of the content delivered to them. While the dislike count has gone private on YouTube, the button remains there so it’s still a key metric to track.

When measuring this metric, you need to consider the number of likes on the video as well. If you have 200,000 likes and 20 dislikes, it wouldn't make sense to try to change the content delivered because of such few dislikes. Also, keep in mind that most videos will get a certain number of dislikes so this piece of YouTube data should be taken with a grain of salt.
5. Comments
Comments are a high-level engagement metric as they go beyond just clicking the like button or simply hitting play. They tell you that users found the content you delivered to them engaging enough to talk about.

In analyzing comments, you also want to keep an eye on this one to get a feel of what the consensus of your audience is about the content. When a video has a lot of positive comments, try to replicate the content in a unique way as it's a clue that your users want more of it
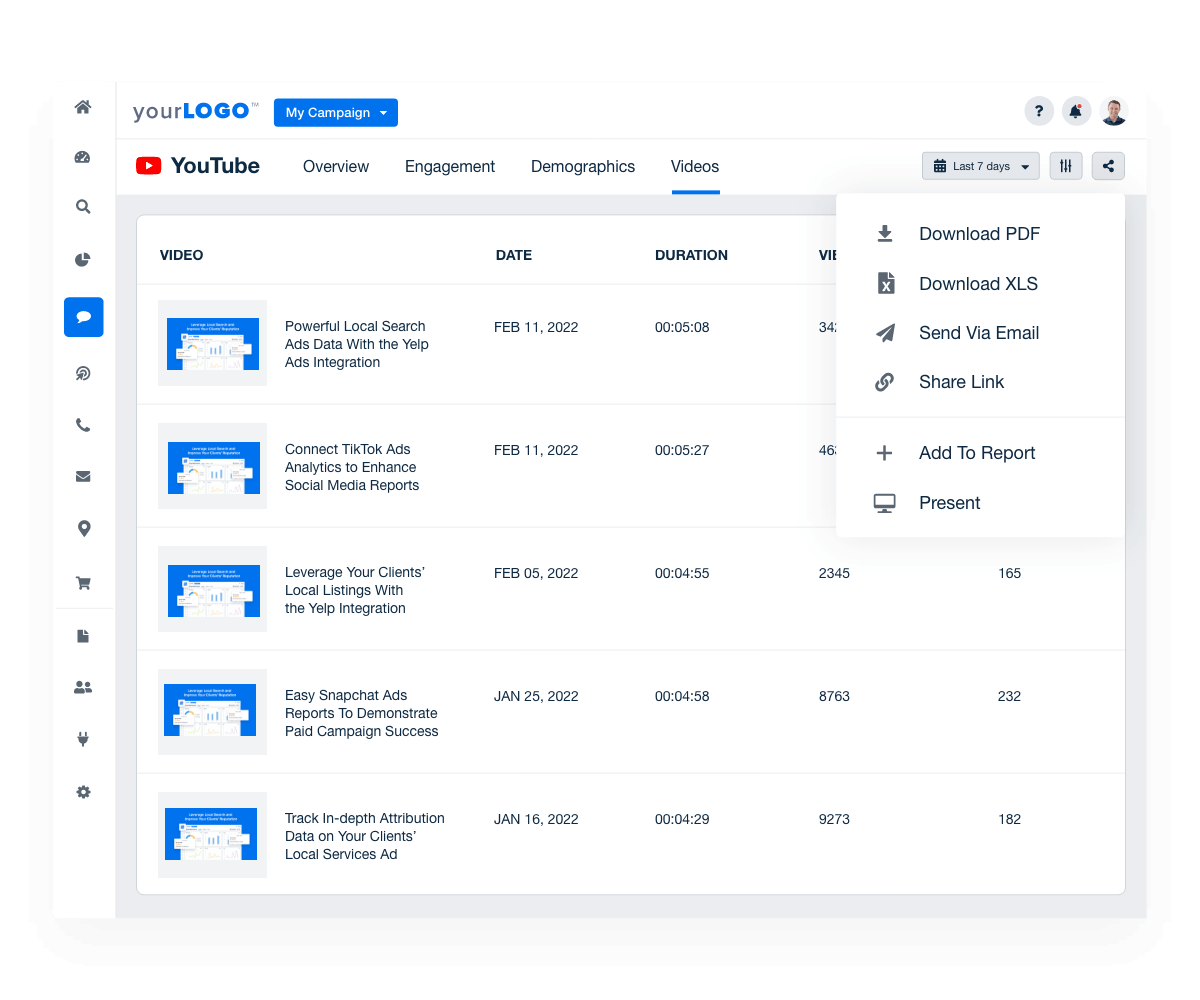
6. Videos Published
When generating a social media or YouTube report for clients, one of the main deliverables will usually be videos published. This should be a key number that you show your clients and allow them to delve further in via the dashboard to see exactly what videos were put up.

It's important to show the publishing frequency and monitor how many videos are being put out on a monthly basis. To dig into the performance of specific videos, head over to the Videos tab to see the top metrics for each published video, including publication date, views, likes, and dislikes.

7. Estimated Minutes Watched
If your goal is to rank your videos high on search engines, then the estimated minutes watched should be of prime importance. This watch time metric measures the average time web users spend watching the videos.

When videos accumulate a high number of minutes watched, they are more likely to be recommended to new viewers and appear in organic search results. This metric also reflects the overall consumption of video content, indicating how engaging and effective it is at retaining viewers' attention.
8. Shares
Shares are another critical metric to focus on in order for you to understand if your audience is interested in engaging with your content. Users watching your content is one thing but sharing your videos with other users is a whole new level of engagement

Use your customizable YouTube dashboard to monitor this metric and get a clear understanding of your campaign’s engagement level.
Streamline Your Agency’s YouTube Reporting
Start Your Free 14-day TrialWhy AgencyAnalytics is the YouTube Dashboard Reporting Software Preferred by 6,500+ Marketing Agencies
INSTANT DATA RETRIEVAL
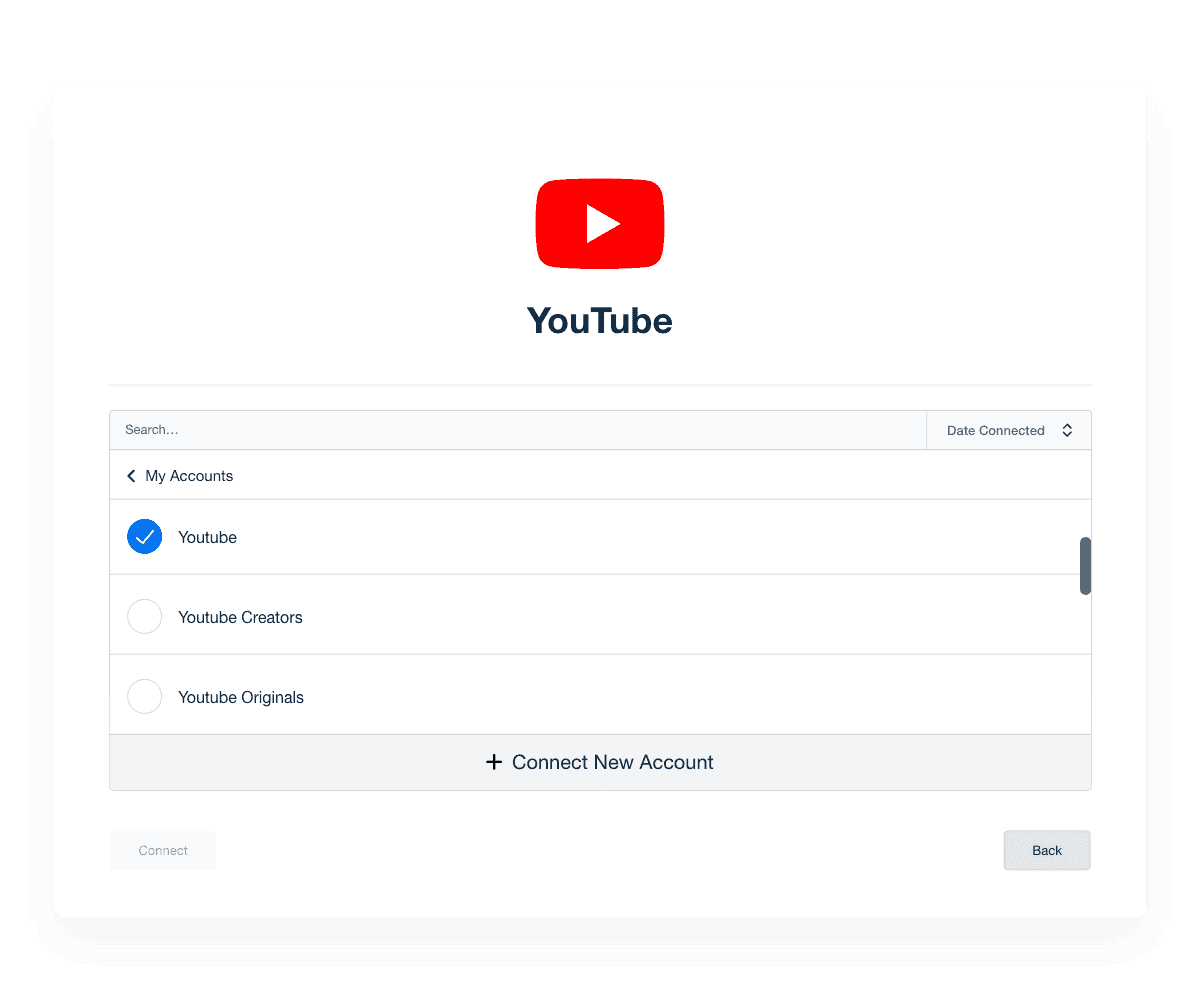
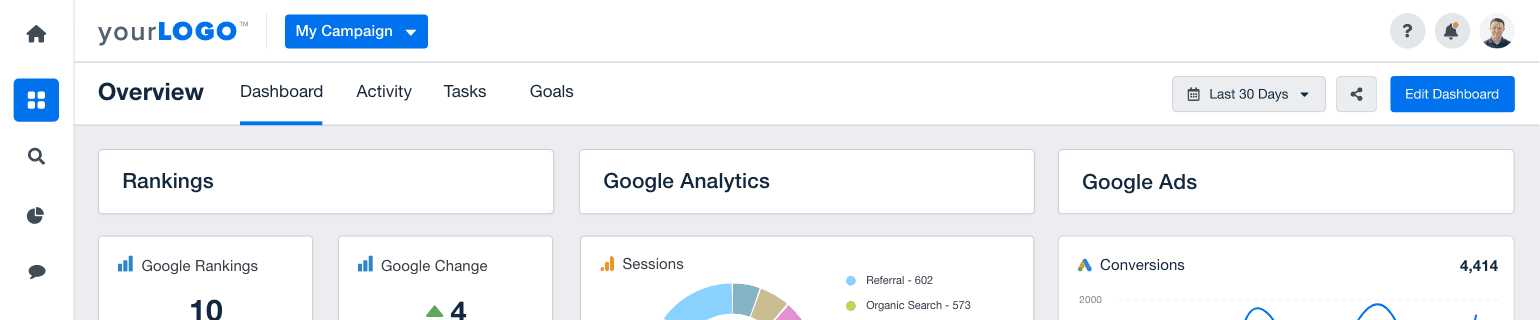
Manage All Your Client YouTube Accounts From One Place
Stop logging in and out of multiple accounts and manage all your clients’ accounts from one streamlined platform. The intuitive YouTube analytics integration automatically retrieves your clients’ YouTube key metrics in real-time and puts them into a visual format that’s easy to analyze. Flip your YouTube dashboard into a comprehensive report in minutes.
FULL-PICTURE REPORTING
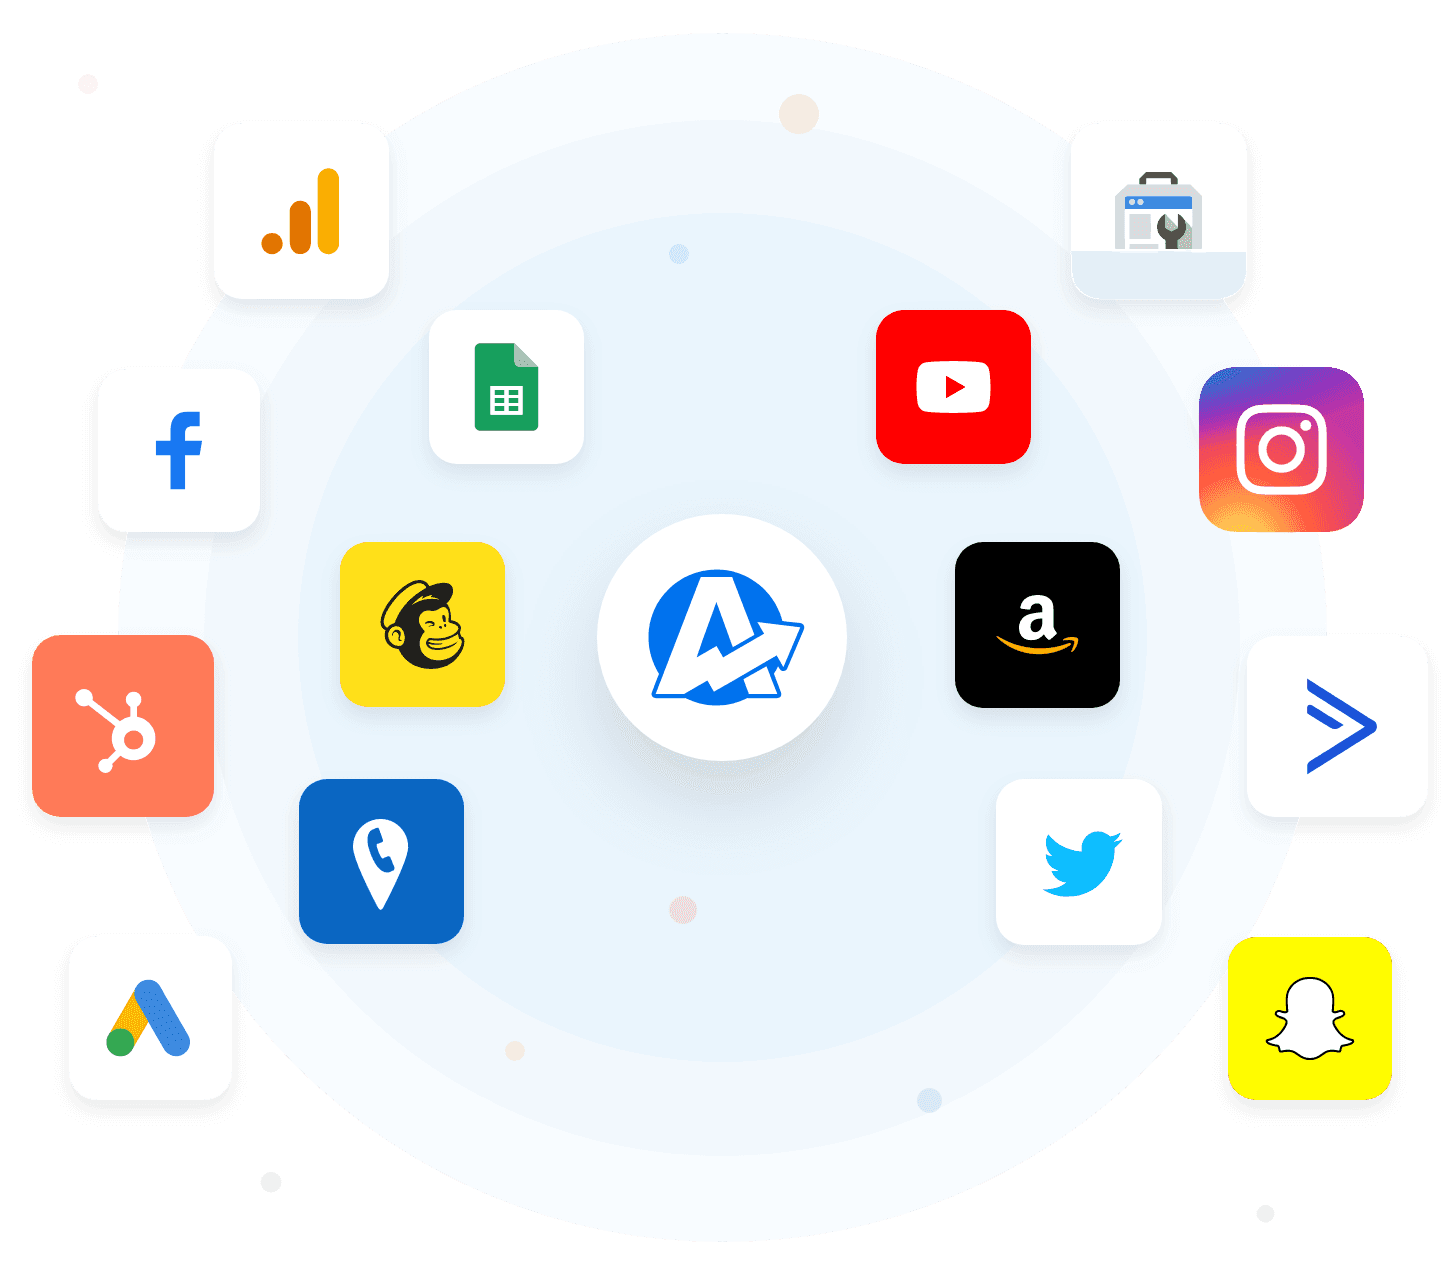
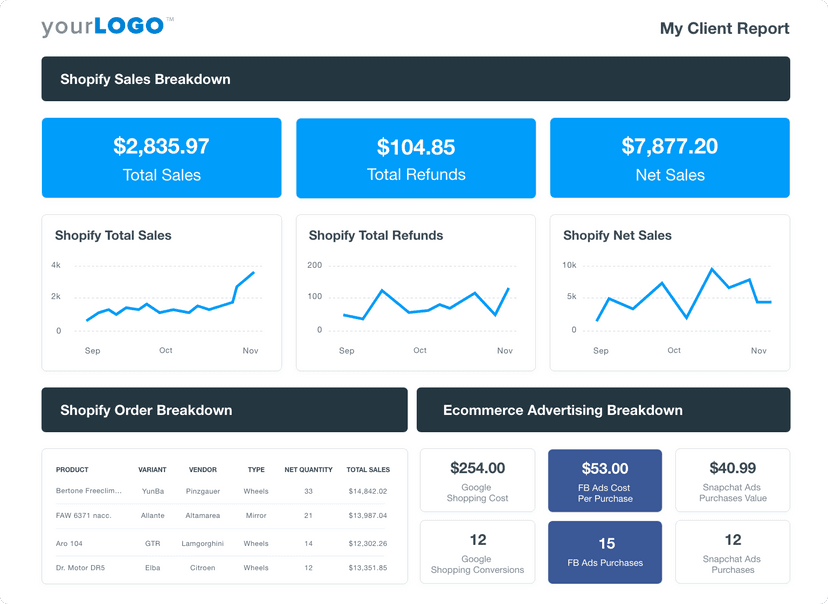
Combine Clients’ YouTube Data With Their Other Marketing Channels
Tired of endless spreadsheets and screenshots? With over 80 integrations to choose from, create comprehensive, customizable reports in minutes that show the combined efforts of your agency’s marketing activities.
Measure YouTube Channel Growth
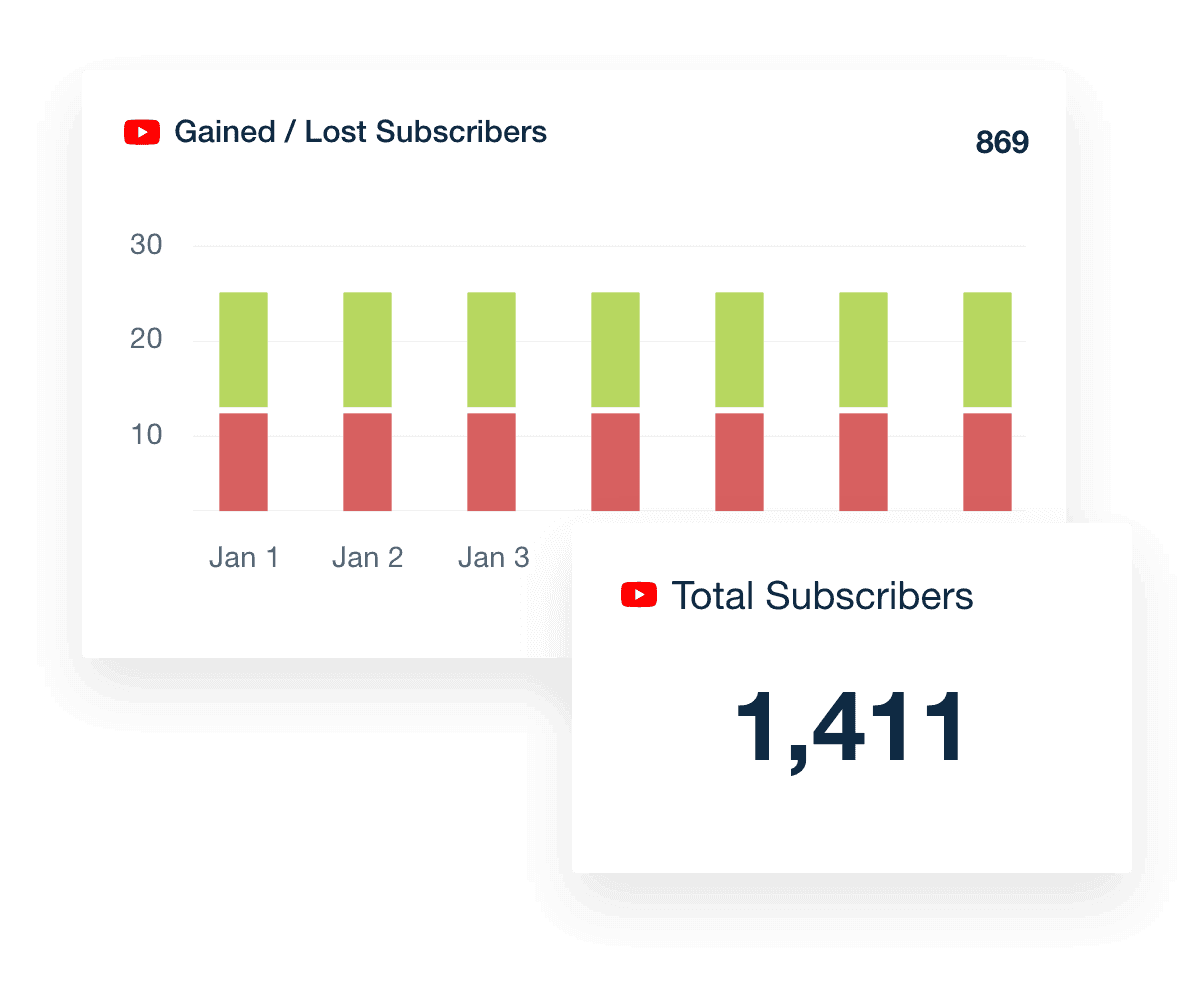
Track New & Lost Subscribers
Delight clients with beautiful reports showing their channel's success. Monitor new and lost subscribers month-over-month. Include intuitive graphs in your monthly report, so clients can view their channel history in a single glance.
Age, Gender, Location & Device
Know Your Client’s Audience
Gain insight into where subscribers are located and what devices they're using. Create content that targets average subscribers' age and gender. With a better understanding of who makes up the YouTube audience, you can continue to deliver engaging content.
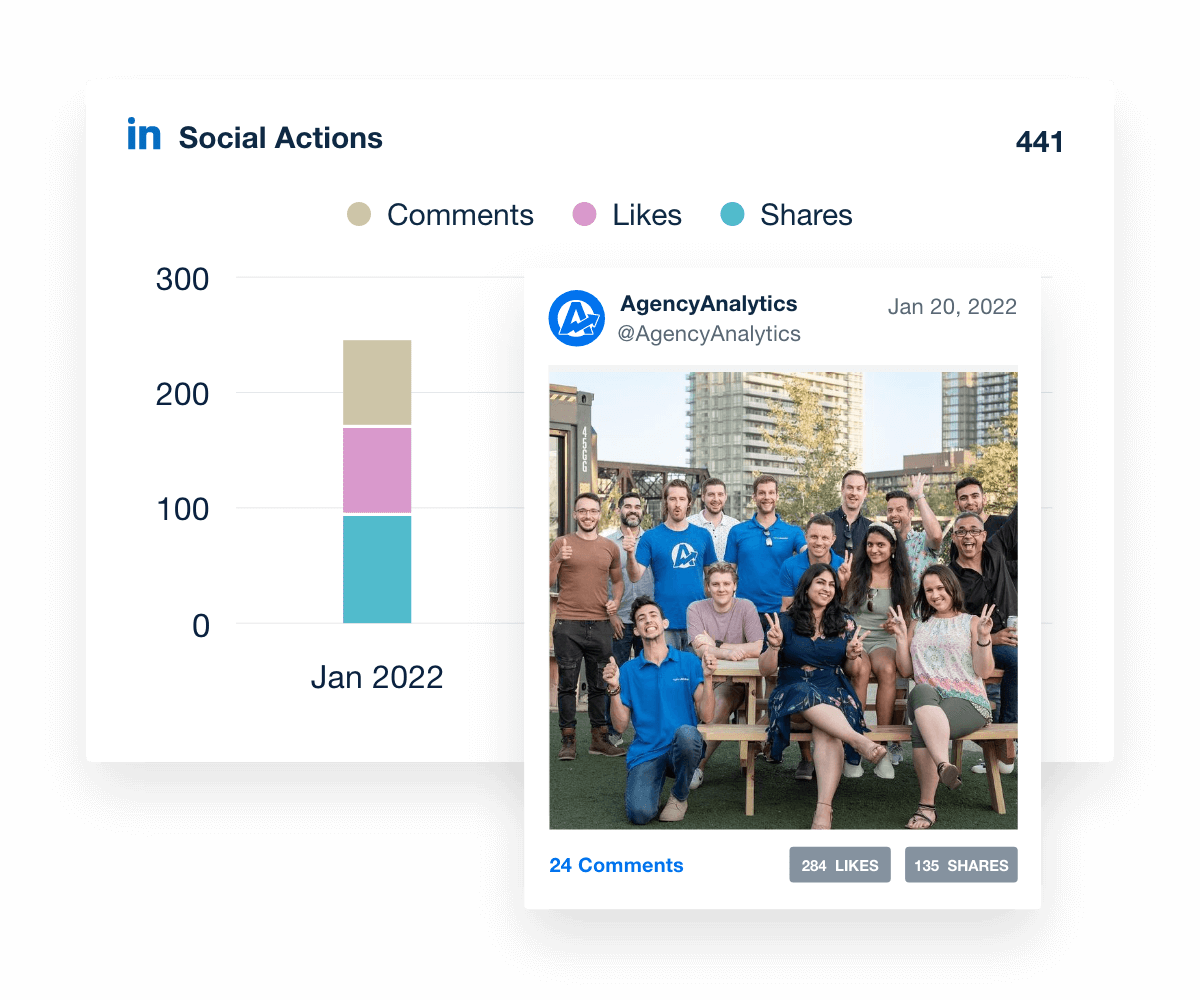
Likes, Dislikes, Comments & Shares
Monitor Engagement
Clients love to see their videos gaining traction. Easily share live engagement metrics with clients in their custom dashboard. You can show off your success using gorgeous graphs measuring likes, comments, and shares so clients know exactly when they get the most engagement.
YouTube Analytics for Every Video
Share YouTube Updates with Clients
The YouTube analytics dashboard includes more than just channel trends — it includes insights for every video. Sort the video feed by key metrics to see exactly which videos people engage with.
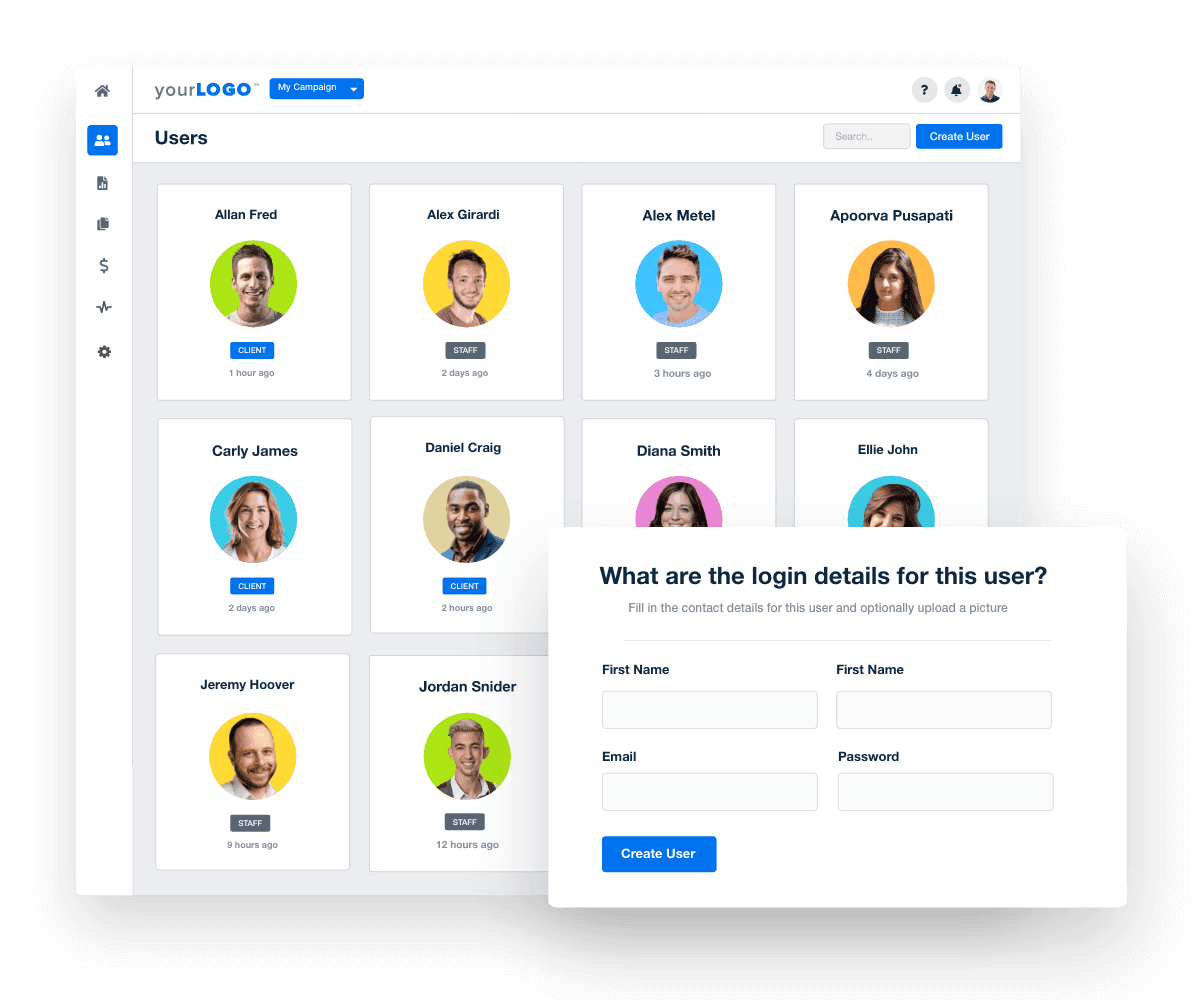
24/7 Client Data Access
Give Clients Their Own Login
Always keep your clients in the loop about marketing campaigns with a YouTube dashboard that is updated in real-time. Give clients their own login, so they can view live results and analytics whenever they choose.
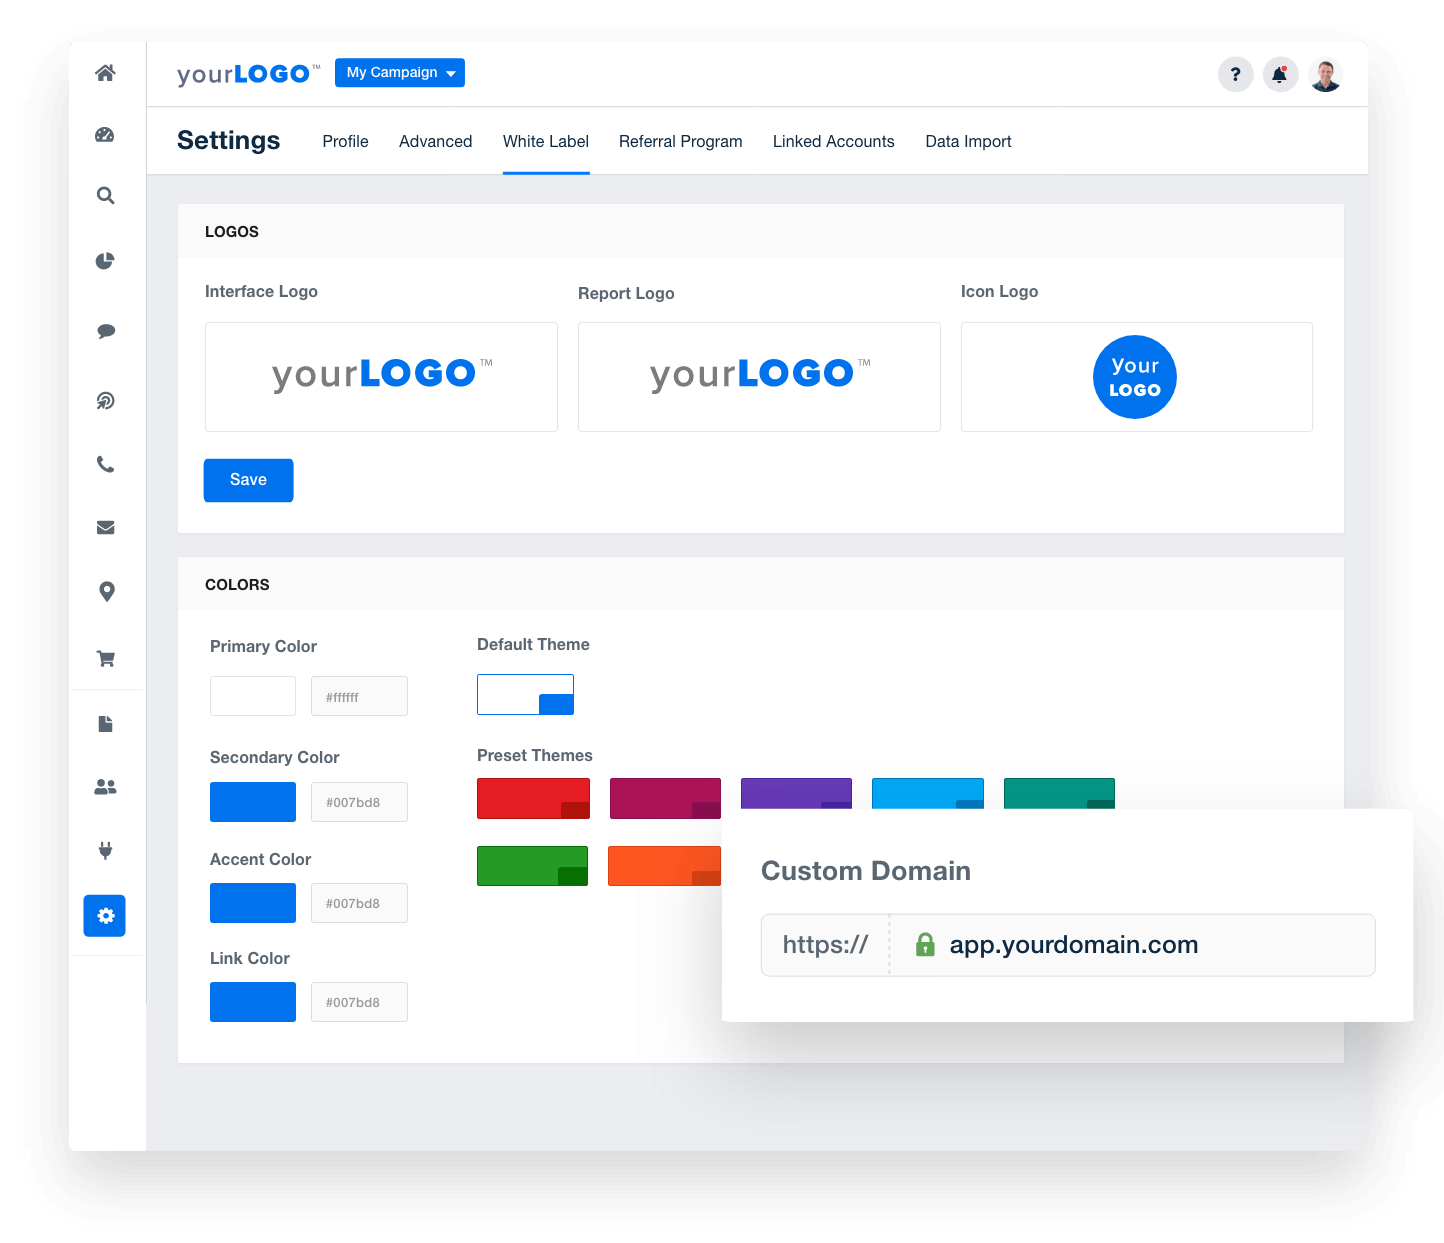
Powerful White Label Options
Add Your Agency Logo & Brand Colors
Take control of your branding with fully white-labeled YouTube dashboards that match your agency’s brand. Upload your agency logo, add your brand’s color palette, and more. With AgencyAnalytics, you have everything you need to call these dashboards your own.
data-driven results, not data headaches
Report Smarter. Not Harder.
Leave complex spreadsheets and tedious data entry in the past. An automated client reporting platform seamlessly integrates your essential marketing channels, crafting visually appealing reports in minutes.
Transform your reporting process and spend that time creating and executing video campaigns that truly impress clients.
We have improved workload efficiency, lowered business costs, and improved client retention rate - everything our business looks to achieve.

Tom McVey
More Templates
Get Started for Free
Try AgencyAnalytics risk-free for 14 days. No credit card required.
Check out the White Label YouTube Dashboard