Weekly Active Users (WAU)
User Engagement
Determine how many users engage with clients on a weekly basis.
User Behavior
Gain insights into how new and existing users interact with a website or app and uncover patterns of user behavior.
Retention
Track customer retention trends on a weekly basis and monitor for sudden spikes or dips.
Content Creation
Schedule content calendars with optimized content for each step in the customer lifecycle.
Why Weekly Active Users Is Important
Weekly Active Users (WAU) provides critical insights into user engagement, satisfaction, and behavior. WAU also reflects customer retention on a weekly basis and helps identify seasonal peaks or lulls.
Weekly Active Users also inform your targeting and segmentation strategy. Use WAU and the related Monthly Active Users (MAU) and Daily Active Users (DAU) to segment customers around usage frequency, as GA-4 tracks DAU and MAU automatically as well. Next, cross-reference this data and combine with other metrics that may uncover deeper audience insights.
Stop Wasting Time on Manual Reports... Get Insights Faster With AgencyAnalytics
Active Users in Google Analytics 4
In Google Analytics 4, the concept of a "Weekly Active User" is predefined and doesn't require manual setup for basic tracking. When someone interacts with a tracked website or app by initiating a session or triggering an event, GA-4 automatically considers them an active user. This includes standard interactions by existing users like page views, clicks, or form submissions.
For more nuanced tracking, setting up custom events in GA-4 contributes to the active user count. For instance, if watching a video on a site is a significant user interaction that a marketer wants to measure, a custom event is set up to trigger when a user plays the video. Once set, these interactions are added to the standard active user metrics.

How Weekly Active Users Relate To Other KPIs
The KPIs most closely related to WAU are Daily Active Users (DAU) and Monthly Active Users (MAU), which measure the number of active users for different periods of time. For example, the The WAU-to-MAU ratio (also known as Wau Per Mau) provides valuable insight into user retention and engagement trends. If WAU numbers are consistently high relative to monthly active user data, it often indicates a stickier, more engaging platform.
As Weekly Active Users reflect customer loyalty and satisfaction, it is also closely related to Churn Rate. For example, if the number of Weekly Active Users suddenly drops, it could be a sign that the Churn Rate may increase (i.e., the business will lose customers) if steps aren’t taken to get WAU back up.

GA4 helps measure engagement more accurately than UA. This is the biggest difference we have found this far. We are excited to see how we can expand our GA4 reporting by identifying and reporting on a slew of new KPIs.
How To Measure WAU
Analyzing active users, including WAU data, is easy with Google Analytics 4. Simply log into the GA4 dashboard, navigate to the 'Life Cycle' menu, and from there, select 'Engagement.' The WAU ratio metrics are shown within the ‘User Stickiness’ section. Although WAU can be found on its own, since it is the number of users during a set week based on the preset or default active user criteria. It is most valuable as a ratio in relation to Daily Active Users or Monthly Active Users. The most common comparisons for Weekly Active Users include DAU / WAU, and WAU to MAU, providing a user stickiness factor that guides website optimization.
What Is a Good DAU per WAU?
When setting WAU goals, factor in the platform type—be it a website or an app—and its purpose, such as news or eCommerce. A DAU to WAU ratio above 10% could be considered very strong for an eCommerce site, but could be seen as weak for a fitness app.
What Is a Good WAU Per MAU?
The WAU to MAU ratio also varies by industry, but a good range is typically around 30-50%. This ratio indicates that a significant portion of monthly users are engaging with the platform in any given week, pointing to positive retention over a longer time period.
How To Set Weekly Active Users Benchmarks and Goals
If standard benchmarks are unclear, turn to historical data. Review past user activity and unique user counts over various time frames to set reliable benchmarks. This provides a tailored understanding of what good performance means for specific campaigns.
The goal is not just to boost the number of active users but also the frequency of their engagement.
Why Weekly Active Users Matters to Clients
Weekly Active Users is a window into customer engagement and brand interest. If WAU numbers are rising, that usually means the website or app is resonating with its audience. It shows that marketing strategies are effective in attracting and retaining current and potential customers.
A stable or growing WAU instills confidence that investment in digital assets is paying off, converting one-time visits into recurring engagements. It also serves as an early indicator of brand loyalty, which is essential for any client aiming for longevity in the market.

Why WAU Matters to Agencies
From an agency's standpoint, WAU serves as a critical gauge for content and campaign efficacy. Unlike metrics that focus solely on reach or impressions, WAU provides actionable insights into the behavior of a single user over a longer time span. Agencies examine fluctuations in this metric to fine-tune campaign elements in real time.
If WAU ratios dip, it's a red flag to look into other metrics and optimize accordingly. But if WAU is on the upswing, it's a green light to double down on what's working.

Save Time and Money by Automating Your Client Reporting
Best Practices When Analyzing and Reporting Active User Data
Thorough analysis of Weekly Active Users provides data for targeted and efficient advertising campaigns. It's not just about using analytics tools to track a number; it's about understanding what that number signifies.
WAU Ratios Over Time
Examining WAU ratios over set time periods pinpoints growth or stagnation. A declining WAU warrants investigation, while an increasing trend suggests successful customer engagement and retention. The temporal lens is vital for strategic adaptability.
WAU Ratios by Channel
Don't limit WAU analysis to a single channel. Look at app usage, website visits, and other interactions based on the traffic source. Channel-specific WAU data highlights which platforms drive the most engagement and deserve further investment.
Anomalies in WAU
Sudden changes in WAU, either spikes or dips, should prompt immediate inquiry. Understand the root causes of these changes, as they often hint at the effectiveness of recent campaigns, customer satisfaction levels, website updates, or feature releases.
Contextualize With Other Metrics
Compare WAU with other critical metrics like conversion rate, time on page, churn rates, and revenue to understand the larger picture behind customer acquisition and retention paths.
Align With Client Objectives
Wrap up the reporting by linking WAU to client-specific goals like increased customer satisfaction or higher Customer Lifetime Value (CLV).
Visualize WAU Performance
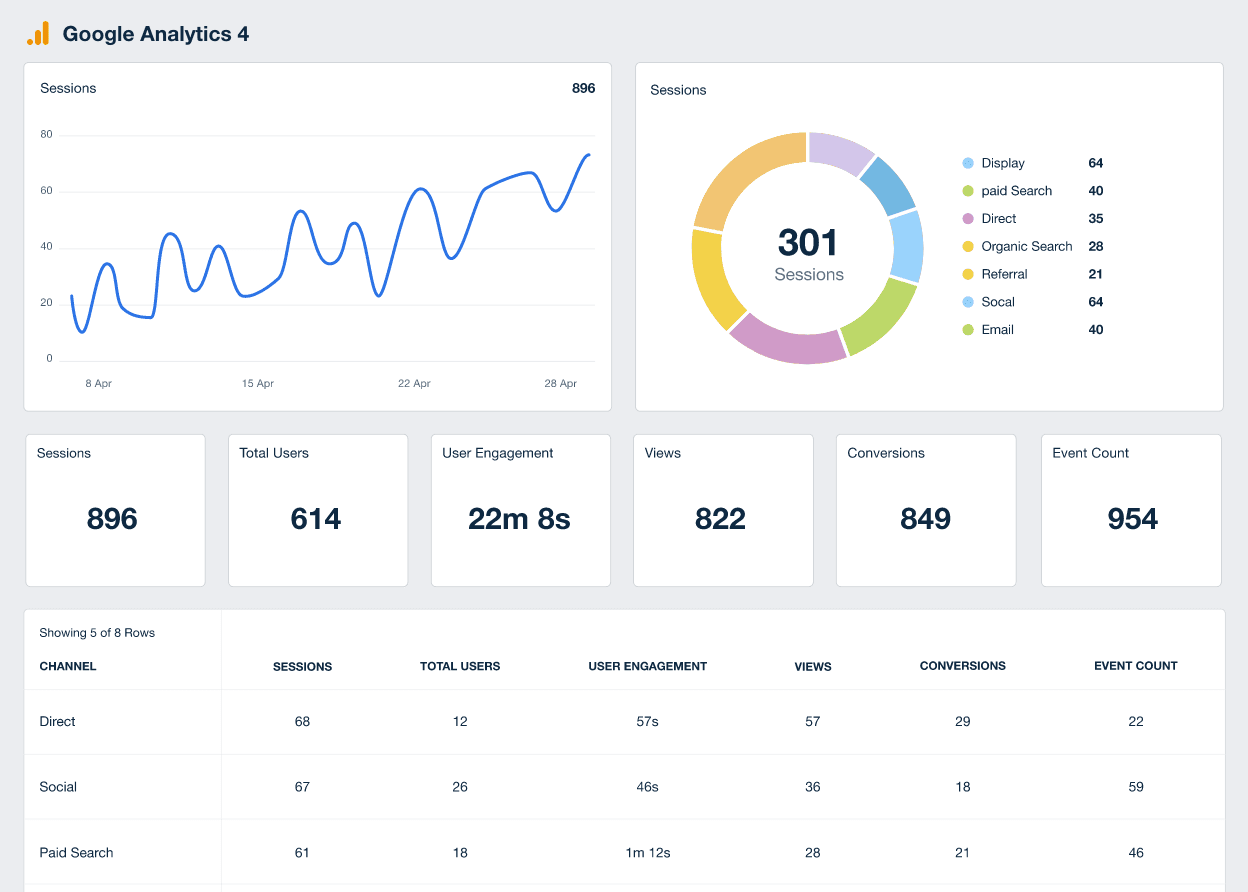
Use data visualization to translate WAU numbers into impactful visuals. A line graph succinctly illustrates WAU trends, making the data more understandable and actionable for agencies and clients alike.
GA4 Dashboard Example
Related Integrations
How To Improve Weekly Active Users
Improving Weekly Active Users results in greater customer satisfaction, increased Customer Lifetime Value, and improved customer retention. Here are 3 tips for improving WAU.
Gamification
Gamification is a common tactic used by many apps, SaaS, and tech companies to make their platforms more engaging and keep users coming back. Offer rewards, leaderboards, and badges to make using the platform more fun.
Regular Updates
Listen to customer feedback and make regular updates and improvements to the product, service, or level of customer support. Keep the content fresh to encourage repeat visits and regularly introduce new features or fixes.
Mobile Optimized
You never know what device your users could be on, whether it’s their smartphone, tablet, laptop, or even desktop computer. Follow mobile-friendly best practices to ensure they have the best experience possible, on every device.
Related Blog Posts
See how 7,000+ marketing agencies help clients win
Free 14-day trial. No credit card required.


