MQL to SQL Conversion Rate
Track Progress
Gauge the effectiveness of lead nurture efforts by monitoring changes in the conversion rate over time.
Align Teams
Ensure marketing and sales teams coordinate closely to qualify leads efficiently, using shared data and insights.
Showcase Value
Highlight the conversion rate in reports to underscore the ROI of marketing strategies and campaigns.
Refine Targets
Adjust marketing tactics based on which leads are more likely to become SQLs, enhancing targeting precision.
Why MQL to SQL Conversion Rate Matters
The MQL to SQL Conversion Rate shines a light on how well marketing efforts attract quality leads and how effectively these leads are nurtured to become sales-ready. A high conversion rate from marketing to sales-qualified lead signals that marketing and sales are in sync, targeting the right audience with messages that resonate and moving them down the sales funnel.
Whether it’s refining the criteria for a sales-ready lead or enhancing lead nurturing tactics, understanding this metric leads to more efficient sales processes and higher revenue. This metric reflects the health of the sales funnel and a guide for strategic decisions across marketing and sales departments.

Stop Wasting Time on Reports. Get Marketing Insights Faster & Drive Results.
MQL to SQL Conversion Rate in the Bigger Picture
The journey from a marketing-qualified lead to a sales-qualified lead is a crucial phase in the sales and marketing funnel. When marketing efforts are finely tuned to generate a high volume of leads that are a good fit for the business, the quality of MQLs improves. This, in turn, makes it easier for sales teams to convert these MQLs into SQLs.
This conversion rate impacts other KPIs such as the acceptable Cost Per Lead (CPL), sales cycle length, customer acquisition cost, and ultimately, the return on investment (ROI) for marketing campaigns. A high MQL to SQL conversion rate suggests that marketing is successfully identifying leads ready and willing to engage with sales, thereby increasing efficiency and effectiveness across the board.
Key Factors that Impact Marketing Qualified Lead to Sales Qualified Lead Conversion Rates
The alignment between sales and marketing teams is pivotal. When both teams share a unified understanding of what qualifies a lead at each stage, the efficiency of the sales process improves. This alignment involves clear communication, shared goals, and mutual feedback mechanisms that allow for continuous refinement of criteria defining MQLs and SQLs.
The effectiveness of the marketing team's efforts in nurturing leads plays a significant role. Marketing initiatives must be designed to educate and engage potential customers, moving them smoothly along the buyer's journey. The content and messaging strategy should address the needs and pain points of leads, making them more receptive to sales conversations.
Similarly, the sales team's responsiveness and follow-up strategies are crucial. Prompt, personalized engagement with MQLs increases the likelihood of conversion to SQLs. The sales process must be adaptable, allowing sales professionals to tailor their approach based on the lead's behavior and preferences.

It’s tough to say which part of the funnel is most important. With that being said, if I had to choose one stage that is particularly important, I would say that increasing sales conversion rates is the most critical. If we can improve our messaging, streamline our process, and provide social proof, we can increase the number of customers obtained with the same number of leads, essentially creating money out of thin air.
How To Calculate MQL to SQL Conversion Rate
To calculate the MQL to SQL conversion rate, divide the number of leads that become sales qualified by the total number of marketing qualified leads, then multiply by 100 to get the percentage. This simple formula gives a clear picture of how effective the marketing team is at generating leads ready for the sales team to take over.
MQL to SQL Conversion Rate Formula
What Is a Good MQL to SQL Conversion Rate?
As of 2023, industry benchmarks suggested that the average MQL to SQL conversion rate across all industries typically ranged from 10% to 20%. This rate signifies that a substantial portion of leads identified by marketing as potential customers are confirmed by sales as ready for engagement. Achieving or surpassing this benchmark indicates effective alignment between marketing and sales, efficient lead scoring, and strong lead nurturing practices.
What Is a Bad MQL to SQL Conversion Rate?
A bad average MQL to SQL conversion rate consistently falls below 10%. This low conversion rate suggests challenges in the marketing-to-sales handover process, possibly due to lower-quality leads, poor lead qualification processes, misalignment between marketing and sales teams, or inadequate lead nurturing. It signals the need for immediate review and improvement of lead management strategies to enhance conversion efficiency.
How To Set Lead Qualification Benchmarks and Goals
While industry averages provide a benchmark, the truth is that a "good" conversion rate varies widely depending on factors like industry, business model, and the complexity of the sales cycle.
A strong conversion rate indicates that the marketing and sales alignment is effective, with marketing efforts generating high-quality leads and the sales team successfully converting them. On the other hand, a lower rate may highlight areas for improvement in either lead quality, sales follow-up strategies, or both.
To set realistic benchmarks, companies should start by analyzing their own historical conversion data, looking for trends, patterns, and opportunities for improvement. This approach allows for setting specific, attainable goals tailored to the business's unique context. For instance, if historical data shows a conversion rate of 10%, aiming for a gradual improvement to 15% or 20% would be a realistic target.
Report Smarter, Not Harder.
Better, Faster & Easier Client Reports Are Just a Few Clicks Away
Start Your Free Trial TodayWhy MQL to SQL Conversion Rates Matter to Clients
For clients, this rate is a direct indicator of how well a marketing team or agency's efforts are paying off in terms of delivering high-quality leads that are genuinely interested in the product or service. It's evidence that the marketing strategies in place are not just generating a high volume of leads but attracting the right kind of leads with a real potential to convert into paying customers.
The MQL to SQL Conversion Rate also provides insight into the effectiveness of the lead scoring system. It highlights the precision with which leads are evaluated and categorized, ensuring that the sales team's time and resources are focused on leads with the highest likelihood of conversion.

Why MQL to SQL Conversion Rates Matter to Agencies
For agencies, the MQL to SQL Conversion Rate showcases how effectively potential leads become sales-ready, making it a beacon that guides top-of-funnel lead generation activities, reshaping the campaigns that are used to attract and nurture prospects.
Analyzing this conversion rate thoughtfully reveals much about the quality of leads generated at the top of the funnel. If the rate is low, it suggests that the initial lead generation efforts are casting too wide a net, bringing in leads that are not a good fit for the business. On the other hand, a high conversion rate indicates that marketing efforts are well-targeted, attracting genuinely interested prospects ready to engage further.

Enhancing MQL to SQL Conversion Rate
To truly grasp and improve the MQL to SQL Conversion Rate, it's crucial to understand the nuances contributing to effective lead conversion. First, analyzing historical data plays a pivotal role. By examining past performance, a business can identify patterns, such as periods of high efficiency or potential bottlenecks. This analysis helps set realistic yet ambitious benchmarks tailored to the business's unique context and goals. Always remember that what works for one sector or business model might not translate directly to another due to differences in sales cycles, product complexity, and customer behavior.
To further refine the MQL to SQL Conversion Rate, consider the impact of various marketing strategies and sales processes. For instance, shifting marketing tactics or introducing a new sales tool can significantly affect conversion rates. Regularly review and adjust these strategies to ensure that marketing and sales efforts remain aligned and focused on the same objectives.

Automatically Pull Data From 80+ Marketing Platforms To Create Client Reports in Minutes.
Best Practices When Analyzing and Reporting on MQL to SQL Conversion Rates
An in-depth analysis of the MQL to SQL Conversion Rate sheds light on the effectiveness of marketing and sales strategies, the health of lead generation activities, and how efficiently the sales pipeline converts high-quality leads.
Ensure Data Accuracy
Reliable data forms the backbone of any analysis, ensuring that decisions are based on facts, not assumptions. This means regularly cleaning and updating CRM data and ensuring that the criteria for MQLs and SQLs are clearly defined and consistently applied.
Analyze Over Time
Examine the conversion rate over time to uncover insights into trends, patterns, seasonal variations, the impact of specific marketing campaigns, or changes in the sales process that have influenced this rate.
Compare Across Channels and Campaigns
Identify which marketing channels and campaigns are most effective at generating quality leads. Use these insights to allocate resources more efficiently, focusing on high-performing channels and optimizing or reevaluating underperforming ones.
Segment the Sales Pipeline
Measure the conversion rate across different segments of the sales pipeline. This granular analysis reveals specific stages where leads tend to stall or drop off, providing targeted opportunities for intervention and improvement.
Align to Client Goals
Align this metric with business growth goals to ensure that analysis and reporting are directly tied to strategic objectives.
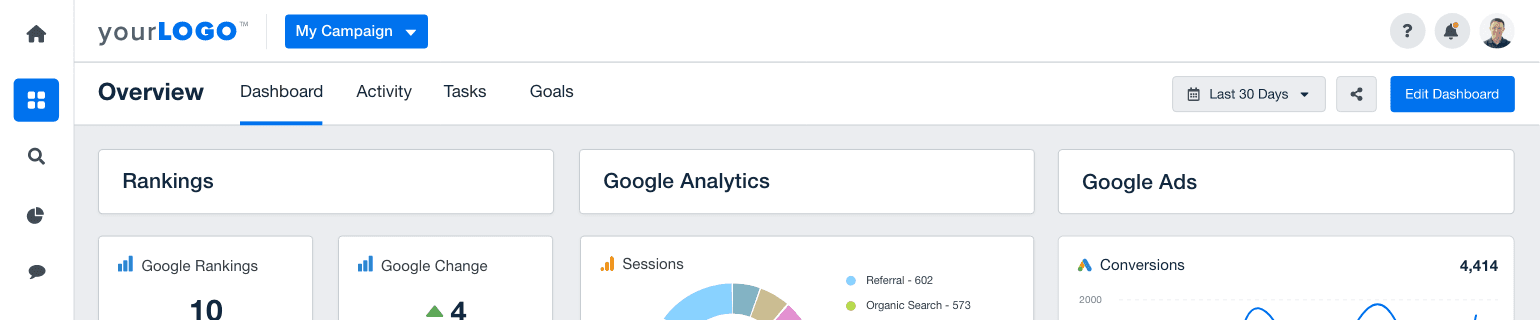
Visualize Performance
Use visually appealing dashboards and reports to make the data accessible and actionable. Clear, intuitive visualizations help communicate complex information effectively, enabling stakeholders to grasp key insights at a glance.
The most predominant metrics are cost per lead and cost per acquisition. We’ll help set up the flow of leads into the CRM and mark the leads with the channel and even the campaign source. Once those leads are closed, we can roll up to a cost-per-acquisition figure. Now, we can see what levers we can pull across the entire MQL-SQL journey, whether better landing pages, conversion rates, or better close ratios on SQLs.
Salesforce Dashboard Example

Related Integrations


How To Improve the MQL to SQL Conversion Rate
Improving the conversion rate from marketing-qualified leads to sales-qualified leads makes the most of marketing and sales efforts. Here are three actionable tips to help enhance this process.
Refine Lead Scoring
Adjust lead scoring criteria to better reflect the qualities of leads that successfully convert to SQLs. This involves analyzing past conversions to identify common characteristics and behaviors of leads that become customers.
Align Sales and Marketing Teams
Ensure that both teams have a shared understanding of what qualifies as an MQL and an SQL. Regular meetings to discuss lead quality and conversion success help maintain this alignment.
Enhance Lead Nurture Streams
Develop targeted content and communication strategies for different stages of the lead funnel. Personalized emails, informative content, and timely follow-ups increase the chances of conversion.
Related Blog Posts

Salesforce Analytics: Top 12 Metrics & KPIs Your Agency Should Track
Salesforce metrics are essential for monitoring campaign effectiveness, revenue projections, and ROI. Here are the top insights to monitor and report to clients.

Mapping your Sales & Marketing Funnel in HubSpot: Lifecycle Stages, Lead Statuses, and Deal Stages
In this guide, we’ll discuss mapping your sales and marketing funnel in HubSport—including lifecycle stages, lead statuses, and deal stages.

How To Handle Common Marketing Agency Sales Objections
The best way to get past a sales objection at a marketing agency is to address it head-on. Understand what is holding your potential clients back will help your agency move forward with the sale.
The dashboard setup is intuitive, easy, and looks great once it’s set up. Managing multiple clients gets tricky but having a dashboard for each client where you can easily see a snapshot of almost all analytics, rankings, social performance, growth, etc. AND be able to dig deeper is exactly what I’ve been looking for.

The Nunnely Group
AgencyAnalytics has been an integral part of Clearwater since the agency was founded almost 7 years ago. It’s supported us through the journey through its highly scaleable platform and regular addition of new features, exceeding our growing requirements for both our clients and agency. Hands down, It’s the best reporting tool available.

Clearwater Agency
Great feature set. Ranking, analytics, and social tracking are very helpful. It gives you all the details you need for a very reasonable cost.

Orange Frog Creative
With AgencyAnalytics we’re able to pull in PPC, social, call, and SEO data into the same platform allowing our clients a single sign-on to view their entire marketing efforts with us.

Healthcare Success
See More KPI Examples
Get Started for Free