Sales Accepted Lead (SAL)
Performance Tracking
Measure how well marketing campaigns target the right prospects.
Engagement & Nurture
Tailor follow-up activities that move leads closer to a sale.
Feedback Loop
Use sales team feedback to refine lead-generation strategies.
Client Reports
Highlight the quality of leads delivered to sales in client updates.
Why Sales Accepted Leads Are Important
Sales Accepted Leads are a vital piece of the puzzle that connects marketing efforts with sales results. When a lead becomes a Sales Accepted Lead, it's a clear sign that the prospect is seriously considering making a purchase. This moment is crucial because it marks the transition from interest to potential action.
Marketing teams work hard to attract a lot of interest, but not all of it leads to sales. SALs have passed the initial quality test, showing they're interested and a good fit for the product or service being offered.
Sales Accepted Leads also help businesses determine how well the marketing strategies are working, providing a measure of success beyond impressions and clicks. With a focus on sales potential, the SAL KPI helps marketers refine campaign tactics, aiming more precisely at the right targets.
Stop Wasting Time on Reports. Get Marketing Insights Faster & Drive Results.
How SALs Relate to Other KPIs
Sales Accepted Leads start their journey as Marketing Qualified Leads. This is the stage where potential customers have shown interest and meet certain criteria set by marketing teams. Once a lead is accepted by sales, it moves closer to becoming a Sales Qualified Lead. This is where the lead's potential to become a customer is confirmed, and they enter the final stages of the sales process.
Cost Per Lead is another critical metric that benefits from the SAL process. Marketers optimize the campaign spend by focusing on leads that are more likely to convert, ensuring that marketing budgets are used more effectively.
Lastly, Conversion Rate is closely tied to the quality of Sales Accepted Leads. A higher quality of SALs typically leads to a higher Conversion Rate, which is the ultimate goal of any sales and marketing effort.
Factors that Impact Lead Acceptance
The lead qualification process acts as a bridge, ensuring that only the most promising leads are handed over from marketing to sales. This process is influenced by a few critical factors.
First, the alignment between marketing and sales teams is paramount. Both teams need to agree on what qualifies a lead as "sales accepted." This agreement involves shared criteria that might include specific actions a lead has taken, such as downloading a white paper, attending a webinar, or requesting a demo. When both teams are on the same page, the transition of leads becomes smoother, and the quality of leads improves.
Another key factor is the clarity and consistency of communication between the sales and marketing teams. Regular meetings to review lead quality and discuss potential improvements to the qualification criteria help refine the process over time.

It’s tough to say which part of the funnel is most important. With that being said, if I had to choose one stage that is particularly important, I would say that increasing sales conversion rates is the most critical. if we can improve our messaging, streamline our process and provide social proofs, we can increase the number of customers obtained with the same number of leads, essentially creating money out of thin air.
How To Calculate Sales Accepted Lead Rates
Understanding how to measure Sales Accepted Leads is straightforward but essential. The calculation involves tracking the number of leads that marketing hands over to sales and which leads sales agree to take forward. This simple formula clearly shows how well marketing efforts align with sales objectives.
SAL Formula Example
What Is a Good SAL Conversion Rate?
Typically, industries with shorter sales cycles and less complex products or services show higher MQL to SAL conversion rates, often in the range of 20% to 30%, while those with longer sales cycles and more complex solutions, such as B2B technology or industrial sectors, see lower rates, hovering around 5% to 15%. Achieving rates within this bracket indicates that the leads being generated are well-targeted and that the criteria for MQLs are accurately defined
What Is a Bad SAL Conversion Rate?
A bad average MQL to SQL conversion rate is generally considered to be below 10% for most businesses. This low conversion rate signals key issues, such as poor lead quality, inadequate lead nurturing strategies, or misalignment between marketing and sales on what constitutes a qualified lead. It may also reflect overly broad or imprecise targeting in marketing campaigns, resulting in a high volume of leads with low conversion potential.
How To Set SAL Benchmarks and Goals
For businesses looking to benchmark their MQL to SAL conversion rates against industry averages, it is advisable to consult industry-specific reports or surveys from reputable marketing and sales organizations or research firms. These sources typically provide more tailored insights and benchmarks that reflect the nuances of different sectors.
Additionally, focusing on historical data provides a way for marketers to focus on improving internal processes, such as lead-scoring accuracy and marketing-sales alignment. This approach is often far more beneficial than relying solely on industry averages for setting performance targets.
Back-Calculating SAL Rates for Revenue Targets
Back-calculating the required SAL numbers is a strategic approach to align marketing and sales efforts with overall business objectives. This involves starting with the end goal, such as a specific revenue target, and working backward to determine how many Sales Accepted Leads are necessary to achieve that goal, considering the average deal size and conversion rates.
For example, if the target is $1 million in revenue, with an average deal size of $10,000 and a conversion rate of 10% from SAL to sale, the company would need 1,000 SALs to meet its revenue target. This calculation sets a clear benchmark for the number of SALs needed and also helps in allocating marketing and sales resources more effectively.
In addition to benchmarks and historical data, it's also useful to dig deeper into the quality of Sales Accepted Leads and Sales Qualified Leads. Analyzing factors such as lead source, industry, job title, and actions taken after being acquired as a Marketing Qualified Lead but before reaching SAL status provides more granular insights. This level of detail helps refine the lead acquisition and qualification processes.
Report Smarter, Not Harder.
Better, Faster & Easier Client Reports Are Just a Few Clicks Away
Start Your Free Trial TodayWhy SAL Data Matters to Clients
The moment a lead is acknowledged by sales reps as worthy of pursuit, the true sales process begins. This transition is not just a step; it's a significant leap toward converting initial interest into actual sales.
Sales reps play a crucial role in the sales journey. Their expertise in understanding customer needs, addressing concerns, and guiding potential customers through decision-making is invaluable. This is what makes Sales Accepted Lead important to clients, as it serves as a green light for sales reps to dedicate their time and resources to closing the deal.

Why Sales Accepted Leads Matter to Agencies
Marketing agencies use SAL data to assess the quality of the lead funnel, distinguishing high-quality leads from low-quality ones. High-quality leads, vetted and approved by sales teams, indicate a successful lead generation strategy, promising a higher conversion rate.
Conversely, analyzing lost leads reveals critical gaps in the lead nurturing process, offering insights for improvement. By focusing on enhancing the SAL rate, agencies refine their strategies, effectively reducing low-quality leads and optimizing resources toward engaging leads with a genuine interest in progressing through the sales funnel.

Turn Data Chaos into Client Success Stories with AgencyAnalytics.
Best Practices When Analyzing and Reporting on SAL
To make smart decisions in marketing, understanding Sales Accepted Leads (SAL) is important. This involves looking closely at which leads are making it through the funnel and why.
Ensure Data Accuracy
Start by making sure the data is clean and accurate. This means checking that every lead marked as SAL meets the agreed criteria. Incorrect data leads to incorrect conclusions, wasting time and resources.
Analyze Over Time
Track how SAL rates change over time. This shows the trends to watch for, like whether certain campaigns are improving lead quality or if there are times of the year when leads are more likely to convert.
Compare Across Channels and Campaigns
Not all marketing channels perform the same. Compare MQL to SAL rates by channel to see where the most qualified leads are coming from. This helps identify where to focus marketing efforts.
Put in Context
Always consider the context around SALs. For example, when launching a new product, it might take time for MQL to SAL rates to stabilize.
Align to Client Goals
Make sure that SAL goals align with the client’s broader business objectives. If the aim is to increase sales, don’t just focus on generating more leads, instead focus on improving the quality of those leads.
Visualize Performance
Charts and graphs help make sense of SAL data, showing how well the lead qualification process is working at a glance.
We report on the basic KPIs such as clicks, impressions, spend, leads etc., however we also take that one step further report on qualified leads, offers made and deals closed. Ultimately, we know our clients hire us to help them close more deals, so the most important KPI we can track for them is how many deals we are helping them close. Everything else is secondary to that.
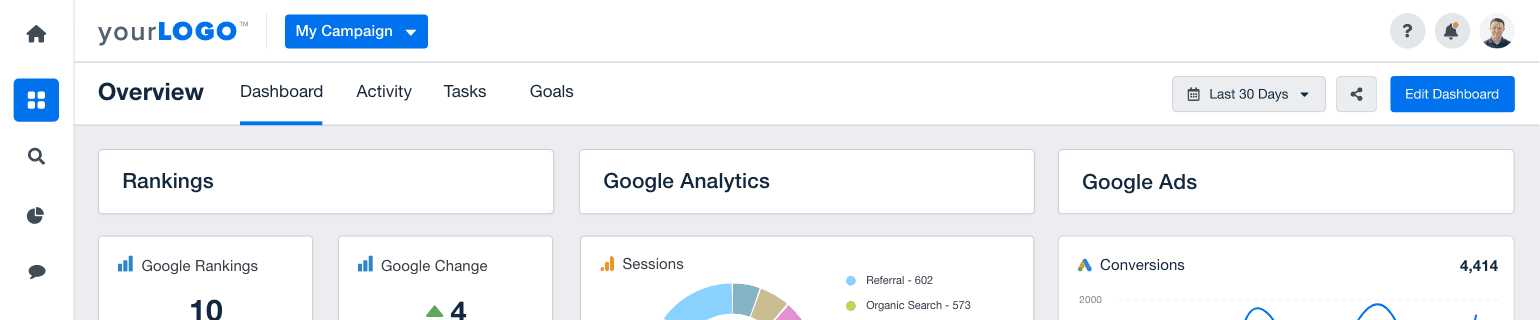
HubSpot Reporting Dashboard Example

Related Integrations


How To Improve Sales Accepted Lead Rates
Improving the quality and quantity of Sales Accepted Leads is crucial for turning potential interest into actual sales. Here are three actionable tips to enhance SAL rates:
Refine Targeting
Focus on identifying and reaching the ideal customer profile more accurately. Use data to understand who is most likely to buy and tailor marketing efforts to attract these individuals.
Enhance Lead Scoring
Update lead scoring models to better reflect the characteristics of leads that convert. Incorporate ongoing feedback from sales on which leads tend to be the most valuable.
Leverage Automation
Use marketing automation tools to nurture leads efficiently. Automated email sequences, for example, keep potential customers engaged until they are ready to be handed off to sales.
Related Blog Posts

How To Handle Common Marketing Agency Sales Objections
The best way to get past a sales objection at a marketing agency is to address it head-on. Understand what is holding your potential clients back will help your agency move forward with the sale.

Salesforce Analytics: Top 12 Metrics & KPIs Your Agency Should Track
Salesforce metrics are essential for monitoring campaign effectiveness, revenue projections, and ROI. Here are the top insights to monitor and report to clients.

Mapping your Sales & Marketing Funnel in HubSpot: Lifecycle Stages, Lead Statuses, and Deal Stages
In this guide, we’ll discuss mapping your sales and marketing funnel in HubSport—including lifecycle stages, lead statuses, and deal stages.
Creating, generating, and sharing reports has never been easier, and our clients love the fact they can follow our activity and their stats in real time. Everything is simplified, accessible, and beautifully presented.

Victory Digital
By consolidating all of our tools into dashboards, we have saved so much time and money—it’s truly been invaluable.

Clix
Very happy with the overall tool, which gives you very accurate data. We chose AgencyAnalytics as its providing complete solutions for what we are after, giving us time to focus on performance-driven work.

Zib Digital
The dashboard setup is intuitive, easy, and looks great once it’s set up. Managing multiple clients gets tricky but having a dashboard for each client where you can easily see a snapshot of almost all analytics, rankings, social performance, growth, etc. AND be able to dig deeper is exactly what I’ve been looking for.

The Nunnely Group
See More KPI Examples
Get Started for Free