The official marketing reporting guide: Best KPIs, templates, tools & strategies for 2026


Table of Contents
- Key takeaways
- What is marketing reporting?
- What is a marketing report?
- Why marketing reporting is changing fast
- What manual reporting actually costs your agency
- What every great marketing report includes
- The 5 key marketing reporting KPIs and metrics
- Types of marketing reports (examples and templates)
- The marketing reporting dashboards you need
- How to build a marketing report in 15 minutes
- How to automate your marketing reporting workflow
- Google Sheets vs. automated reporting software
- Best marketing reporting software and tools
- Best practices for marketing reporting
- Why some agencies stick with manual reporting (even though they shouldn’t)
- Future trends in marketing reporting
- Building a smarter marketing reporting system
7,000+ agencies have ditched manual reports. You can too.
Free 14-Day TrialTable of Contents
- Key takeaways
- What is marketing reporting?
- What is a marketing report?
- Why marketing reporting is changing fast
- What manual reporting actually costs your agency
- What every great marketing report includes
- The 5 key marketing reporting KPIs and metrics
- Types of marketing reports (examples and templates)
- The marketing reporting dashboards you need
- How to build a marketing report in 15 minutes
- How to automate your marketing reporting workflow
- Google Sheets vs. automated reporting software
- Best marketing reporting software and tools
- Best practices for marketing reporting
- Why some agencies stick with manual reporting (even though they shouldn’t)
- Future trends in marketing reporting
- Building a smarter marketing reporting system
7,000+ agencies have ditched manual reports. You can too.
Free 14-Day TrialYour agency is growing exponentially. Business is booming. And while it’s what you’ve always wanted, you and your team are coming apart at the seams. The systems you put in place for 10 clients aren’t sustainable at 50, or 75, or 100+.
Reporting is usually the first system to buckle. Agencies with 20 clients spend 30 hours on manual client reporting every month. For an employee to handle reporting at $40 per hour, that’s a loss of $1200/month–before you count the campaign work that didn’t get done.
Reporting pays off in dividends once an efficient, automated system is in place. It’s no longer about throwing numbers into a spreadsheet–it extends to how you predict trends, surface insights, and improve client outcomes.
This guide covers what goes into a good marketing report, the templates agencies use most, the KPIs worth tracking, how to build a client-ready report in under 15 minutes, and the platforms that make it repeatable.
Key takeaways
Clients want reports that go beyond metrics to explain what changed, what it means, and what happens next.
Most agencies run a mix of weekly, monthly, quarterly, and platform-specific reports, with 65% sending client reports monthly.
Manual reporting costs agencies 1.5 to 4 hours per client, per cycle—time taken straight out of campaign work.
Automation and centralized dashboards connect data across platforms and turn a multi-hour build into a 15-minute review.
The agencies that stand out pair automated data with their own context and recommendations.
What is marketing reporting?
Marketing reporting is how you track key performance indicators (KPIs) and measure how your clients’ marketing efforts are performing. When your reporting is dialed in, it gives you the insight you need to advise clients and make decisions that actually move the needle.
What is a marketing report?
A marketing report is a summary of your findings related to a client’s marketing performance. The best reports are clear and concise but detailed enough to provide real value.
Analytics matter, but your clients shouldn’t need a data science degree to understand what’s happening. Your job is to translate complex findings into a report that clearly tells the story of how their marketing performance is evolving and what it means for their business.
Why marketing reporting is changing fast
Reporting used to be straightforward: pull numbers from a few platforms, drop them into a spreadsheet, summarize at the end of the month. Today, you’re managing campaigns across multiple channels, platforms, and attribution models, while clients expect real-time visibility into results.
But they don’t want a long list of metrics—they want you to reduce their cognitive load. AgencyAnalytics’ proprietary customer research with agencies and their clients shows that many reports fail to explain why results changed or what matters most, which leads to lower client engagement.
What clients really want is clarity. They want reports that quickly answer a few fundamental questions:
What’s working
What’s not working
What the data actually means
What should happen next
As data becomes more complex and reporting expectations grow, agencies are increasingly relying on digital marketing reporting solutions to centralize insights and streamline reporting workflows.

Too many dashboards, not enough clarity? Explore AgencyAnalytics’ digital marketing reporting solution.
Too much data leads to analysis paralysis
Dumping all of your agency’s marketing data into a spreadsheet and sharing it with the client usually means there’s too much data for them to absorb. That leads to questions about very specific metrics that aren’t primary drivers of the client’s success, including vanity metrics.
It's essential to show value to clients with key metrics that matter, business owners & marketing managers want to see the results simplified to measure marketing against business growth/sales. - Pat Akkawi, Director, The Marketing Co
That granularity helps with campaign optimization, but it’s rarely what the client needs to track the ROI of their investment in your agency.
What manual reporting actually costs your agency
Ask any marketing professional what they didn’t sign up for, and “manually building digital marketing reports” will be near the top of the list.
But here we are. Screenshots, spreadsheets, chasing down last-minute metrics from Google Ads or social media platforms… then stitching it together and hoping nothing breaks. Next week or next month, it starts again.
Many agencies spend an average of 1.5 to 4 hours per client just to create a marketing report. Multiply that by 20+ clients, and your team’s best minds are stuck copy-pasting instead of campaign-optimizing.
On average, it took 60-90 minutes to prepare and send client reports. When you multiply this out by 10-15 clients per SEO Executive, this would mean that anywhere from 10-22.5 hours were spent on reporting by each staff member, every month.
Brad Russell, Founder, Digital Hitmen
Time isn’t a bonus for marketing professionals—it’s a budget.
Digital agencies sell time, and if a client buys 5 hours of your time, and you waste the first 20% on a report each month, you have less time to scale the client.
Mikael Sørensen, Head of Marketing, Adtention
Every hour spent cobbling together a report is an hour taken from campaign optimization, client strategy, or new business—weekly, monthly, quarterly, across dozens of clients and every channel. And it’s rarely just dropping numbers into a doc. It’s:
Digging through disconnected data sources
Rechecking metrics to avoid sending the wrong numbers
Formatting charts to make them “client-ready”
Writing out insights, goals, and what’s next
Manual data entry introduces risk, not just delay
Most of the data in a spreadsheet report has to be pasted in by hand from multiple sources, which takes time and leaves room for human error. Then you start from square one at the end of the next reporting period. It’s no wonder so many agencies refer to the client reporting period as “Hell week!”
There are ways to automate some of those data points with tools like Zapier, but those connections can all-to-easily break and cost an agency several hours troubleshooting.
The more touchpoints involved, the more chances there are for:
Broken links, Excel formulas, or mismatched metrics
Data inconsistencies across platforms
Errors that quietly erode client trust
And if the final report isn’t clear, accurate, and visually intuitive? It doesn’t matter how many hours went into it—your client still feels in the dark.
A slow report is also a missed branding opportunity
Slapping your agency’s logo onto a complicated-looking doc–that your clients may or may not even understand–doesn’t do the one thing a client report should: communicate success and reinforce your brand. It should cement your agency’s impact on a client’s bottom line–not bog them down with data overload.
What changes when reporting is automated
Creating reports in 15 minutes or less gives your team space to think, plan, and act.
The team used to spend about 1 hour creating reports for each client. So, that would mean each team member was spending about 20 hours every reporting session just to create the reports, let alone present them.
Now, with AgencyAnalytics, it's really a matter of minutes. We created our own custom report templates, and once they're copied into an account, we create a shared link for the date range we want to report.
Brendan Chard, Owner, The Modern Firm, LLC
You’re not scrambling for screenshots. You’re reviewing performance metrics and turning them into next steps before the client even asks.

Because reports update automatically with live data, you keep a clear view of what’s working. That means:
Spotting shifts in website traffic before they become problems
Tying ad spend directly to customer acquisition cost
Comparing how email marketing stacks up against paid ads
Seeing whether your SEO efforts are actually moving the needle
The bigger gain is repeatability. With the right report templates, data flows in from every platform, your branding is already applied, and the insights are ready to go. That consistency builds confidence in your agency. It works the same way for an in-house team: you’re not scaling admin work, you’re scaling strategy.
What every great marketing report includes
Fast is great—but not if the report leaves clients confused. Weekly or monthly, a strong report has to tell a story your clients understand. Quickly.

Most effective reports include a few key elements:
KPIs tied to real goals: The metrics you include should reflect what the campaign is actually trying to achieve—traffic growth, leads, or revenue.
Performance trends: Month-over-month or quarter-over-quarter comparisons give stakeholders context and show whether performance is improving.
Channel-level insights: Breaking results down by campaign or platform—SEO, PPC, email, social, and beyond—shows where results are coming from.
Website traffic metrics: Organic vs. referral traffic, and how each is trending.
Simple data visualizations: So trends stand out at a glance.
Analysis and recommendations: A good report doesn’t just show what happened—it explains why, and what your client should do next.
The best reports don’t overwhelm with “all the data”—they prioritize what’s relevant to the client’s goals, highlight wins, flag red flags, and show how your team is improving results.
If a report can’t help your client answer questions like:
“Are we growing?”
“What did we spend?”
“What’s the ROI?”
…then it’s just numbers on a page. If someone finishes reading your report and immediately understands what’s working and what needs attention, you’ve done it right.
Agency tip: Curious what makes a great marketing report? Check out AgencyAnalytics’ free digital marketing report sample PDF.
The 5 key marketing reporting KPIs and metrics
Not every campaign requires the same metrics, but most marketing reports rely on a core set of KPIs:
Website traffic: A simple indicator of how well your marketing efforts are driving visitors to your client’s site.
Conversion rate: Shows how effectively that traffic turns into leads, signups, or customers.
Customer acquisition cost (CAC): Helps you understand how much it costs to acquire a new customer through marketing.
Return on ad spend (ROAS): A key metric for evaluating paid advertising performance.
Lead volume and quality: Especially important if your campaigns are focused on generating pipeline rather than just traffic.
Resist the temptation to track everything. According to AgencyAnalytics’ first-party research with agencies and their clients, smaller businesses often care most about bottom-line outcomes like leads and revenue rather than large sets of metrics. The most useful reports focus on the KPIs that influence business decisions.
Types of marketing reports (examples and templates)
Some reports are organized by how often performance is reviewed, others by platform or channel. Most agencies use both, along with report templates you can use as-is or modify as you wish.
By reporting cadence
Different cadences serve different purposes: some keep an eye on campaign performance, others frame bigger strategic conversations with clients or leadership.
Weekly marketing report
A weekly marketing report helps teams catch issues early. It focuses on short-term metrics like spend pacing, click-through rates, and conversions.
For example, a paid media team might review a weekly report to see whether cost per conversion increased or if a new ad creative is outperforming the rest. A Weekly Marketing Report template automates this by pulling campaign data into a single dashboard so teams can quickly see what needs attention.

Monthly marketing report
Monthly marketing reports are the most common reporting format for agencies. According to the AgencyAnalytics Marketing Agency Benchmarks Report, 65% of agencies send reports on a monthly basis.

Monthly reports bring together performance across channels. A typical one summarizes website traffic, leads generated, paid campaign performance, and SEO progress, along with key insights and next steps. Many agencies streamline this with a Monthly Marketing Report template that automatically aggregates data from multiple platforms.

Quarterly marketing report (QBR)
Quarterly reports—often called QBRs (Quarterly Business Reviews)—focus less on individual campaigns and more on broader trends and strategy. Instead of week-to-week fluctuations, they look at quarter-over-quarter growth, channel contribution, and overall marketing impact. Agencies often present this using a Quarterly Marketing Report template that highlights the most important KPIs for leadership and clients.

Annual marketing report
Annual reports give a big-picture look at the past year: year-over-year growth, top-performing channels, and major campaign wins, so leadership can evaluate what worked and where to invest next. Many teams consolidate this using a customizable Annual Marketing Report template.
By platform
Platform reports cover a single channel—Google Ads, Facebook Ads, SEO, or social media—and sit alongside broader monthly or quarterly reports to show exactly where results are coming from.
Digital marketing report
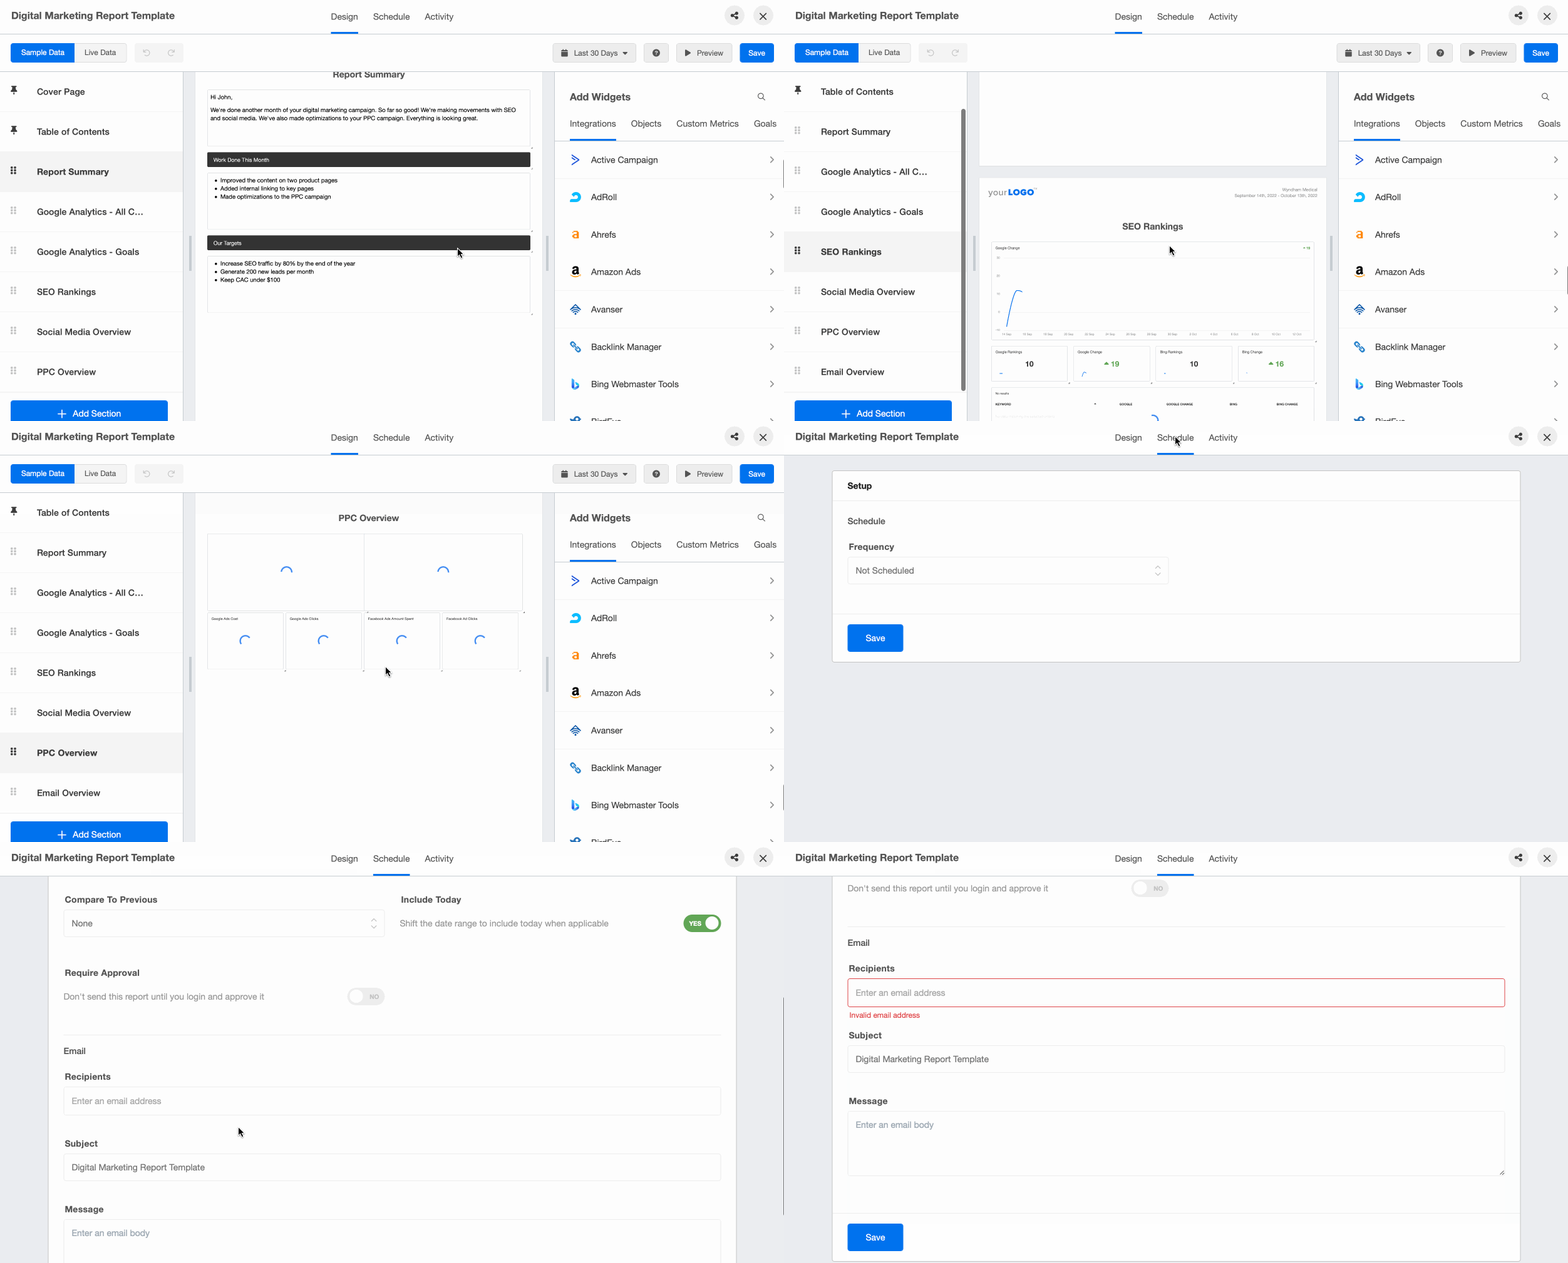
Easily gather and communicate key metrics like web traffic, conversions, SEO ranking, and ad campaign performance with a digital marketing report tool.
Social media analytics report
A social media analytics report shows how content and campaigns are performing across social platforms: engagement rate, impressions, follower growth, and top-performing posts. A Social Media Report template makes it easier to monitor these metrics across multiple platforms in one place.

Instantly show your clients their trends in audience demographics, follower growth, and website traffic with an automated social media reporting tool.
SEO report
An SEO report tracks organic search performance over time: keyword rankings, organic traffic, backlinks, and the pages generating the most search traffic. Teams often rely on an automated SEO Report template to track these metrics and identify trends in organic performance.

Automate your SEO reporting to save hours every month. This SEO reporting platform highlights the most important KPIs without overwhelming your clients with too much information.
Facebook Ads report
A Facebook Ads report analyzes paid campaign performance across Meta platforms: cost per click, conversions, return on ad spend (ROAS), and audience performance. Marketers often use a Facebook Ads Report template to quickly identify which ads or audiences are driving results.

Instagram performance report
An Instagram performance report covers reach, impressions, engagement rate, and follower growth, as well as performance across posts, Stories, and Reels. An Instagram Report template helps teams understand what content resonates most with their audience.

Google Ads report
A Google Ads report shows whether paid search is driving traffic and conversions efficiently: click-through rate, cost per click, conversions, and cost per acquisition. Many teams rely on a Google Ads Report template to monitor campaigns and optimize spend.

PPC report
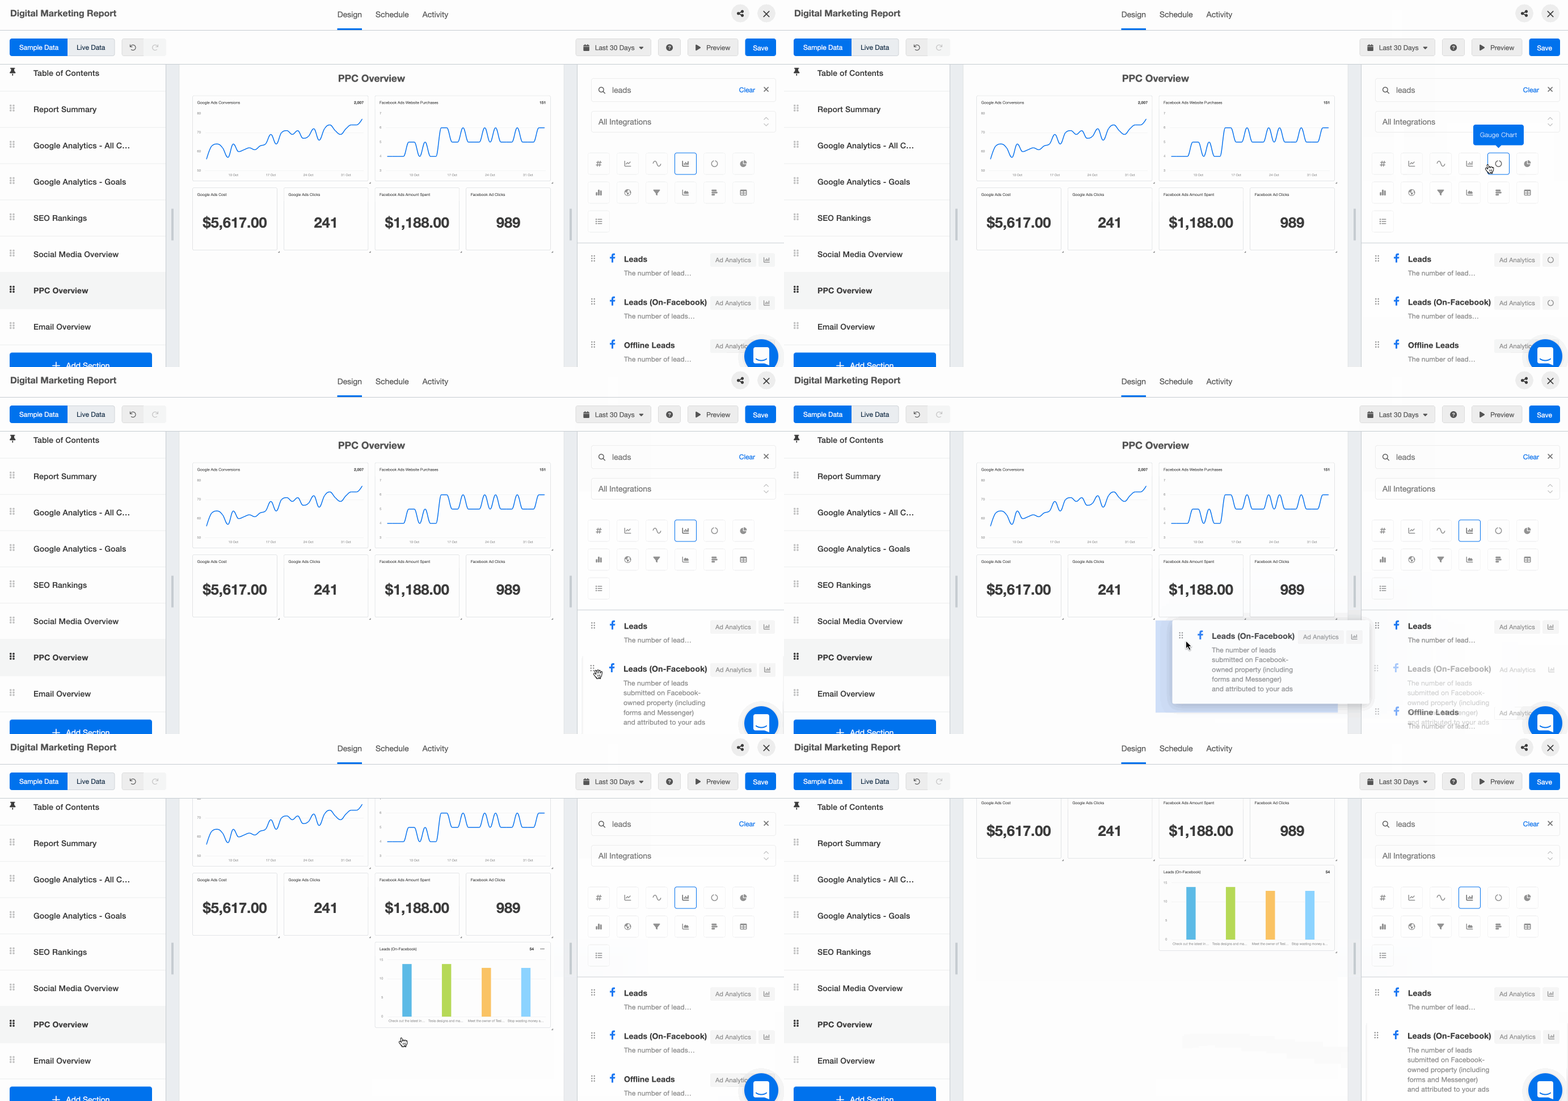
Simplify your PPC reports by already including your PPC markup and showcasing the KPIs that matter most to your clients. Combine data from all your clients’ PPC platforms–from Facebook Ads to Google Ads and even Snapchat Ads–into one visual report.
The marketing reporting dashboards you need
You probably don’t rely on a single dashboard. Most agencies use a layered approach, where different dashboards serve different audiences:
Campaign dashboards help you monitor day-to-day performance across paid, SEO, or social campaigns.
Client dashboards provide a clear snapshot of key KPIs and progress toward goals.
Executive dashboards focus on higher-level outcomes like revenue impact, customer acquisition, or ROI.
A well-designed dashboard is worth 1000 words, so you don’t need long-winded explanations. Clients can quickly see what’s working, what’s improving, and where attention is needed next.
When to use a dashboard and when to use a report

Dashboards are for internal analysis and always-on client access. Reports are what you schedule, annotate, and send. Here are the key differences between marketing dashboards and reports:
Use Cases | Dashboard | Report |
|---|---|---|
Automated scheduling | ❌ | ✅ |
Internal analysis of data for short-term decision-making | ✅ | ❌ |
24/7 access with custom login | ✅ | ❌ |
Client-facing option | ✅ | ✅ |
Drag-and-drop builder for customization | ✅ | ✅ |
85 + integrations | ✅ | ✅ |
Templates to get started right away | ✅ | ✅ |
Full white labeling features (logo, brand colors, custom URL, etc.) | ✅ | ✅ |
Build views for the way your team is structured
Templates are a starting point. Fully customizable dashboards and reports adapt to any client or campaign—from ad performance to sales qualified leads to website performance and user behavior—so you can highlight the metrics that matter: marketing spend, campaign performance, traffic sources, and ROI. If you're supporting teams with specific roles—like social media managers or SEO strategists—build views tailored to each service area.
Impress clients and save hours with custom, automated reporting.
Join 7,000+ agencies that create reports in under 30 minutes per client using AgencyAnalytics. Get started for free. No credit card required.

Already have an account?
Log inHow to build a marketing report in 15 minutes
Once your reporting system is dialed in with data sources and white label branding, building a polished report becomes the easiest part of your week. No tab overload, no screenshots, no formatting fire drills. Here’s the cadence for agencies using AgencyAnalytics.
1. Set the reporting period
Choose the date range—weekly, monthly, or custom—and your report automatically pulls in the most recent performance data across every channel.

2. Review pre-built sections
From SEO and website traffic to social media metrics and PPC campaigns, the report is already organized with the key performance indicators your clients care about. All that’s left is a quick scan. Need to add something for a specific client? It’s easy with the drag-and-drop report editor.

3. Add your expertise
Use commentary blocks to add quick context, insights, or next steps. Whether you’re highlighting a jump in organic traffic or explaining a dip in ad spend ROI, your analysis is what makes the data meaningful.

4. Hit send (or let automation do it)
Schedule reports to go out automatically, or generate a live link to share in client meetings. Either way, you’re sending accurate, up-to-date information without lifting a finger. If you want one last look, the report approval feature—available on select plans—lets you review and sign off before it hits your client’s inbox.

5. Move on with your day
That’s it. Create a marketing report that looks great, reads clearly, and reinforces your value—in 15 minutes or less.
Impress clients and save hours with custom, automated reporting.
Join 7,000+ agencies that create reports in minutes instead of hours using AgencyAnalytics. Get started for free. No credit card required.
How to automate your marketing reporting workflow
Manual reporting once meant exporting spreadsheets and assembling dashboards by hand. Modern reporting tools pull data from multiple platforms, update dashboards in real time, and generate automated marketing reports that keep stakeholders informed without manual work.
A typical automated workflow includes:
Connecting your marketing platforms
Centralizing data in a reporting dashboard
Scheduling reports for stakeholders
Using alerts to flag unusual performance changes
AgencyAnalytics’ internal research shows that agencies strongly value automation for recurring insights and summaries, especially when reporting across multiple clients.
What automated reporting software is
Automated reporting software is a tool used by marketing agencies to automatically gather key marketing metrics for internal analysis and sharing with stakeholders. Even using it only to gather, collate, and calculate metrics and KPIs cuts a majority of the labor-intensive work out of client reporting.
When the founders at AgencyAnalytics set out to grow their SaaS company twelve years ago, they wanted to solve the #1 pain point for marketing agencies: client reporting.

It connects every marketing channel your clients use
Your clients won’t all be on the same platforms, and most are on more than one. One client uses Mailchimp while another uses Drip; a B2B client focuses on LinkedIn while a fashion-forward client focuses on Instagram.
AgencyAnalytics connects with 85 marketing channels to bring each client’s data into one place. (There’s even a Google Sheets integration, but more on that in a bit.)
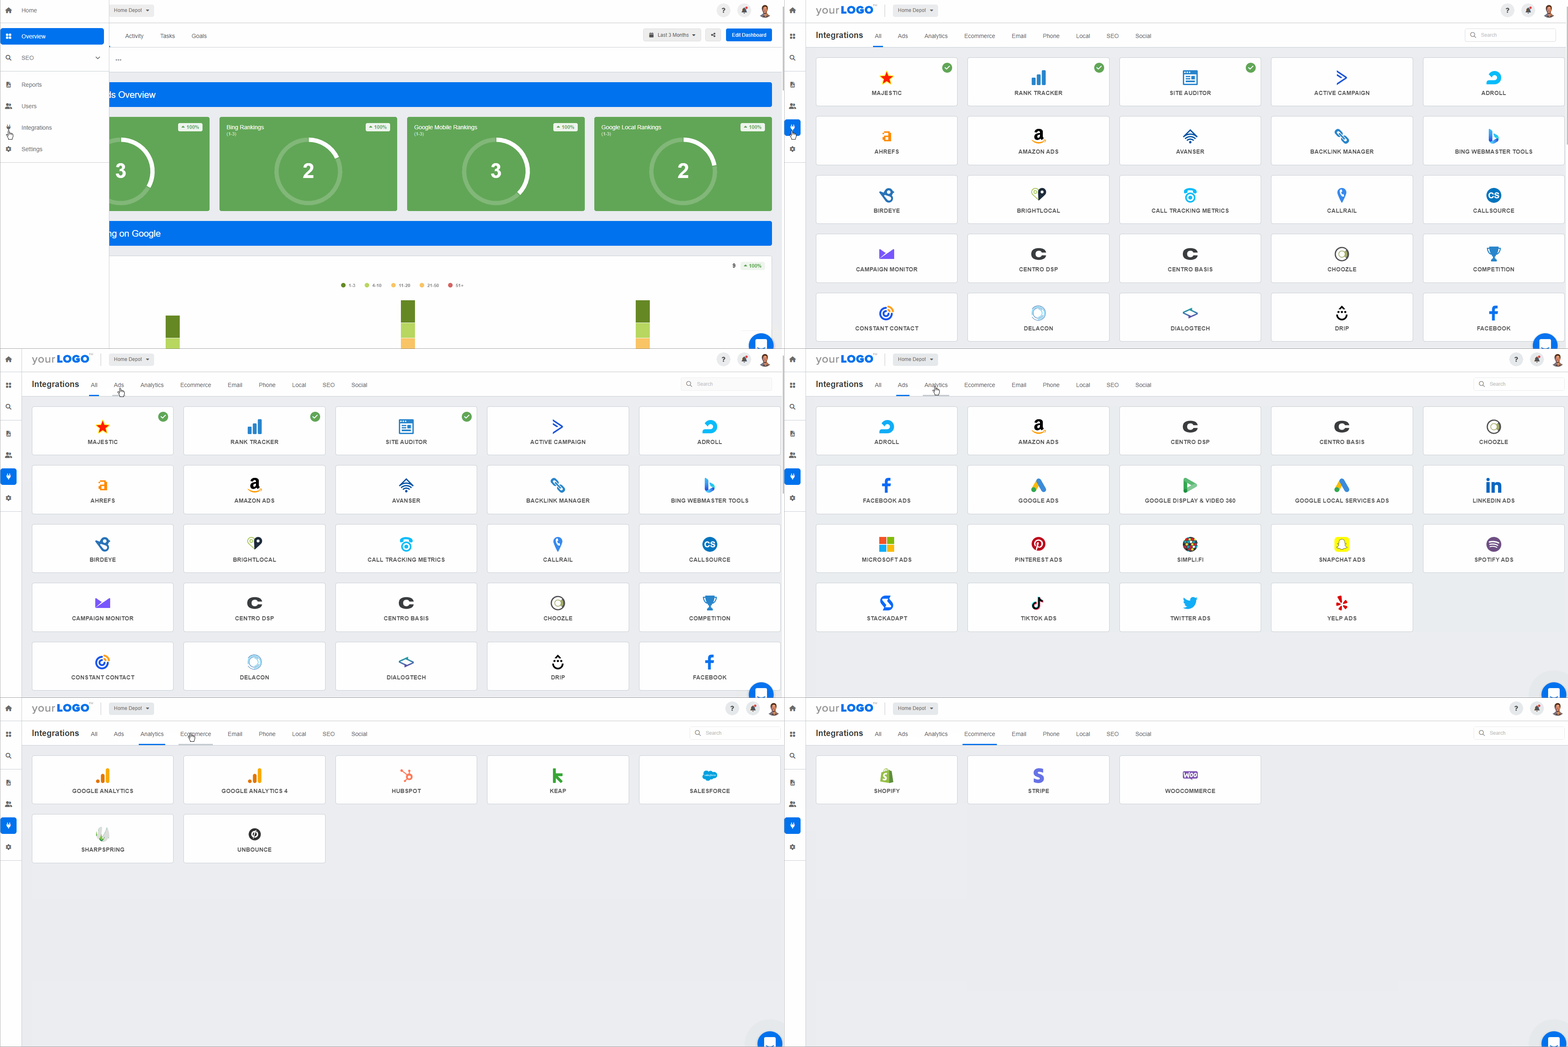
Connect all the integrations you need to show the full picture of your client’s marketing performance under one roof. Start your free 14-day trial today!
It pulls in real-time data for you
Every integration has its own dedicated dashboard pulling real-time metrics from that platform. So you have a Facebook Ads dashboard and Facebook Ads report template alongside a Google Ads dashboard for PPC Ads, a Web Analytics Dashboard for your Google Analytics, and so forth. For every client.
Instead of V-lookups and cell-based formulas, you zoom in and out of time periods to view trends, with charts and graphs created for you. When the numbers change inside any of the 85+ supported marketing platforms, so does the data in your reports. No more importing, copying, or pasting. No more cell errors.
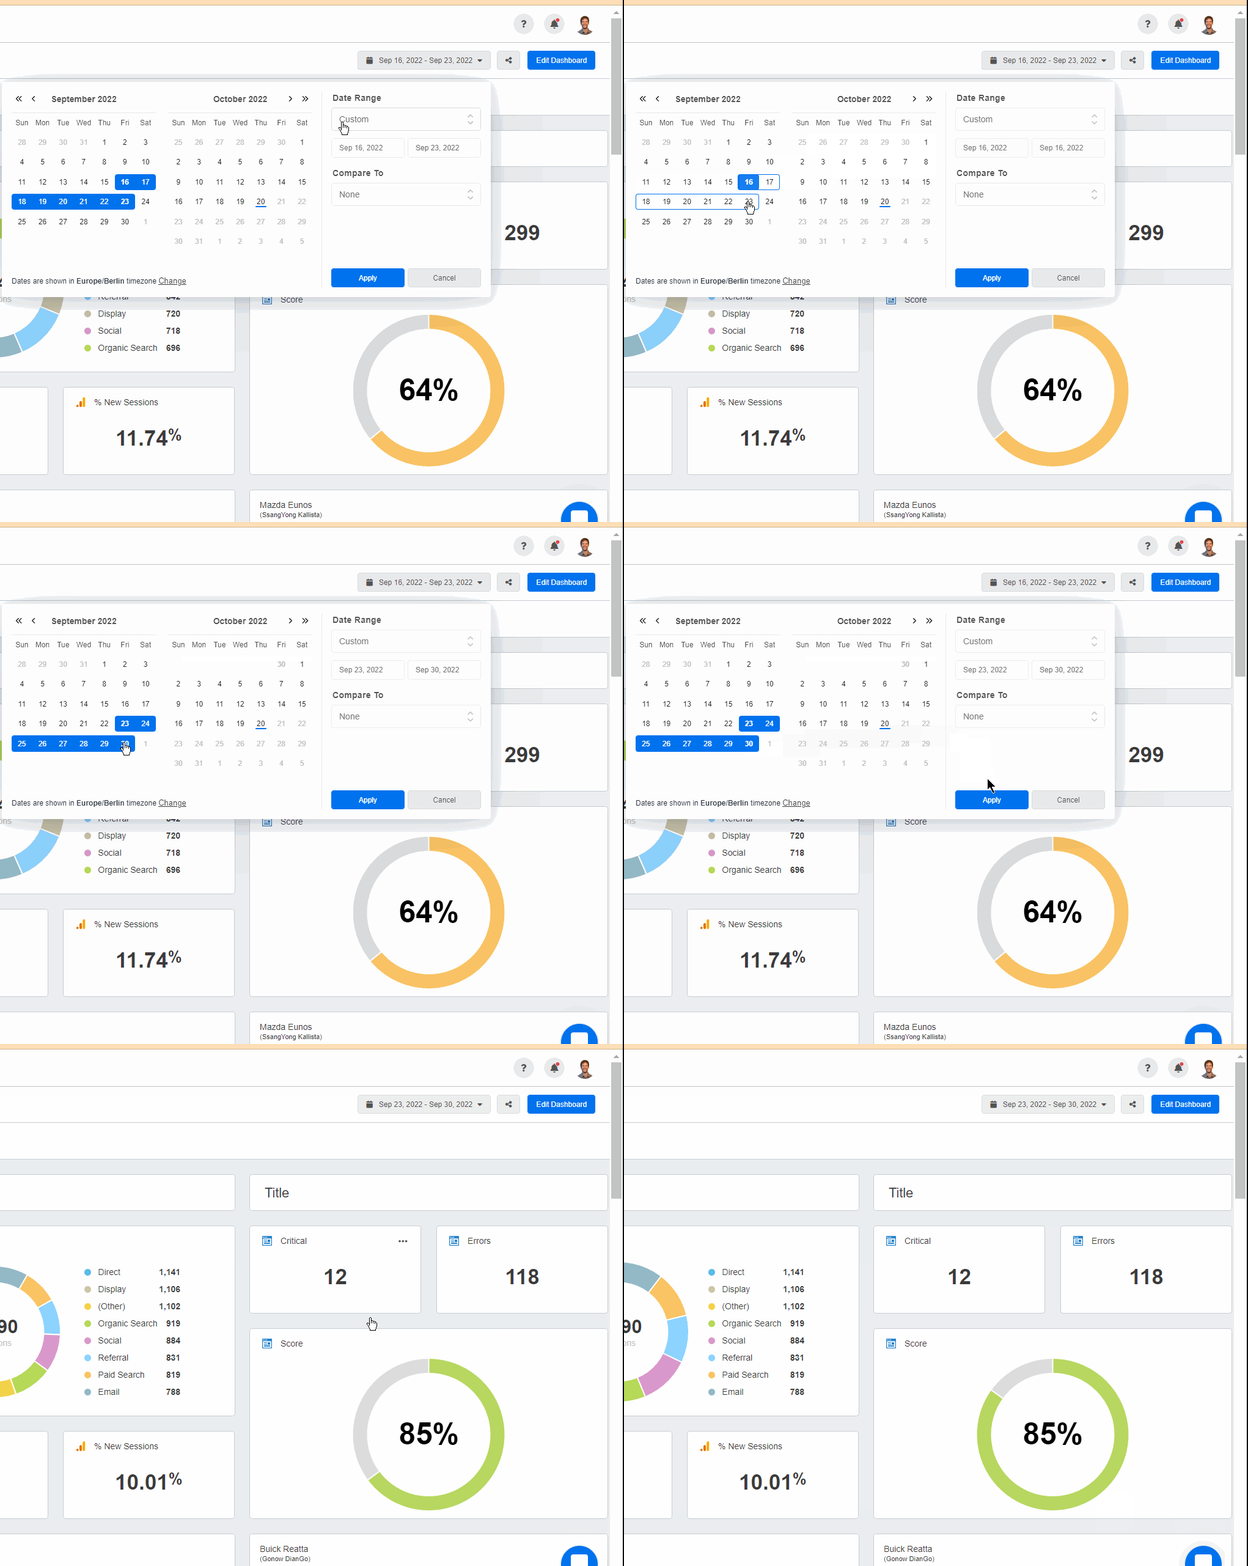
There are over 15+ multi-channel dashboard templates to start from, and each marketing report template is easily customizable by dragging and dropping widgets from any of your clients’ integrations. That builds marketing dashboards and client reports in minutes for any date range.
It schedules and sends reports
Automated reporting software puts your client reporting on autopilot–read more about Client Reporting Best Practices. Once a client’s report template is set up, reports go out at regular intervals with the latest data.
Many agencies still prefer the report approval system, which lets them review reports, add commentary in plain English, and customize the executive summary in a few minutes.
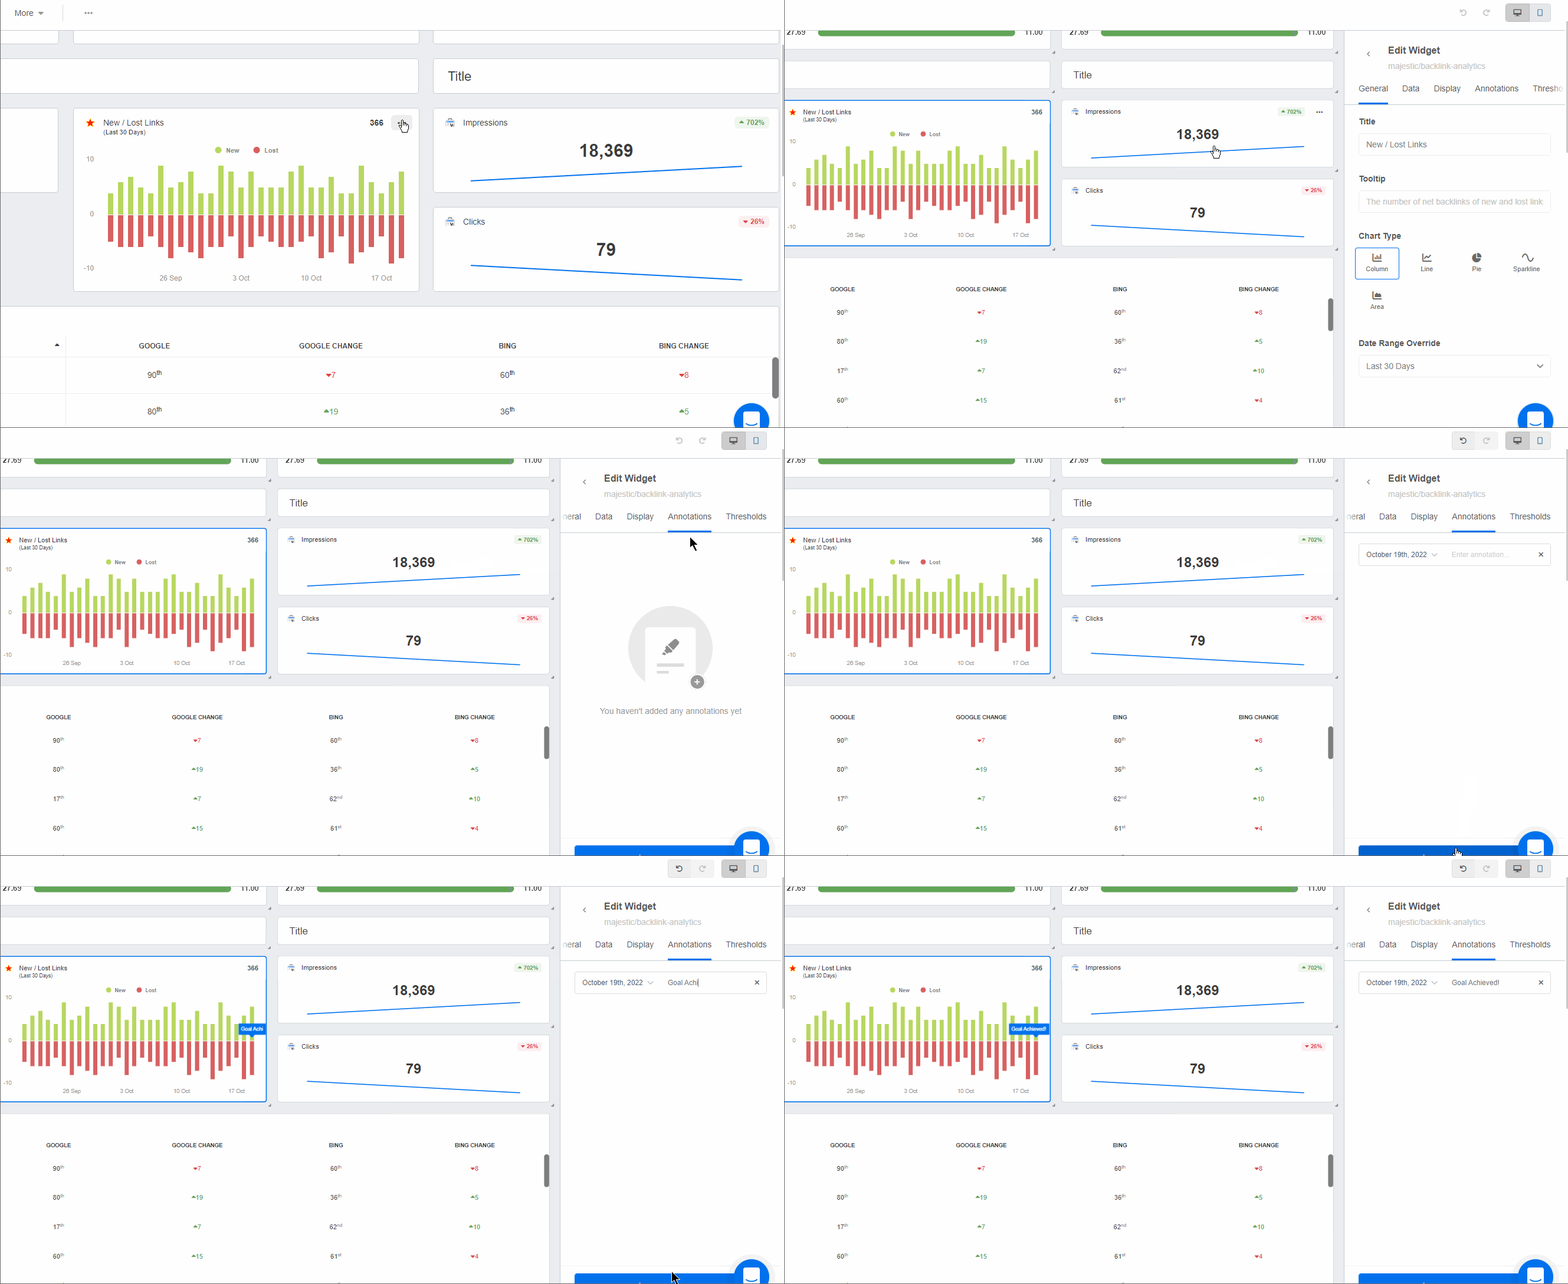
Agency Tip: Put some of your client reports on autopilot–especially the ones your agency doesn’t actively manage but keeps tabs on. For example, a regular SEO audit or Review Management report keeps your clients in the know of their website health or online reputation. Your clients will appreciate this valuable information–with no additional time investment from your agency. Plus, they may even indicate areas of need and be used as a natural upsell opportunity to broaden your agency’s services!
It works around the clock, so you don’t have to
Create unlimited logins for your team and clients, with customized permissions, so your more involved clients can check progress 24/7. That transparency builds trust.
You can also see when clients have opened and viewed their reports. Those who regularly don’t interact with your reports could be a sign of churn–reach out to mitigate that risk.
It updates goals to show progress
Once you set your KPIs with your clients, integrate goal-tracking into your day-to-day activities. Create custom goals or use custom metrics to know immediately whether you’re on track–in time to change course before your next reporting period.

These widgets are built into your dashboards, making it easy to add them to client reports and show progress toward your clients’ business goals.
It integrates with Google Sheets
Have data that isn’t available from the list of integrations? Use the AgencyAnalytics Google Sheets integration to import select data points or entire tables to:
Highlight custom metrics that matter most to your clients
Turn raw data into intuitive charts and graphs
Easily compare raw data month-over-month
Auto-sync your Google Sheets data
Deliver white labeled reports

Google Sheets vs. automated reporting software
Google Sheets has its place in any agency, from ad-hoc reports that focus on a specific initiative or data point to performance forecasts. But it starts to break down with repeated processes, such as complex monthly client reports spanning multiple campaigns or platforms. Pairing it with Looker Studio helps with visualization, but the data is still only as current as your last manual export.
The pros and cons of Google Sheets for client reporting
PROS ✅ | CONS ❌ |
|---|---|
Unlimited data | No real-time updates |
It’s free | Lack of support |
Usability | Creating reports can take too long |
Manipulating data with formulae | Fixing them takes time when they break |
Easy to copy-paste data | No API or automation to input data for you |
Customizable font and colors | White labeling looks scrappy at best |
Visualizes data with charts, graphs, and tables | There’s a limited amount of charts you can add to a sheet |
Multiple users can work on the same doc simultaneously | It can slow down and cause you to reload the page |
Can get very granular when calculating specific metrics or KPIs | Setting user permissions to view or edit spreadsheets can be time-consuming |
Where spreadsheet reporting hits its limits
Google Sheets is great for manipulating data, but it isn’t built for the volume a marketing agency handles daily–or that a client wants to see monthly.
There’s a steep learning curve for each team to master the formulas, and even with charts added, it’s hard to show the big picture from rows and columns. The more data you add, the slower the doc is to load and scroll. With clients running multiple campaigns, it’s hard to get right every time.
A step-by-step comparison
Google Sheets | AgencyAnalytics |
|---|---|
Step 1 - Open each marketing platform for a specific client (Facebook, Google Ads, Mailchimp, Semrush, etc. ) | Step 1 - Open AgencyAnalytics to see all of the data that has been automatically updated for each client and campaign. |
Step 2 - Find and enter the relevant username and password for that platform. | Step 2 - Use a report template or create a new report – and watch as your clients’ data is automatically populated. |
Step 3 - Set the date range, segments, or other filers you need to find the data you need. | Step 3 - Add your agency’s insights and analysis. |
Step 4 - Copy the relevant data points. | Step 4 - Schedule or send your white labeled report to the client. |
Step 5 - Paste into Google Sheets. | Step 5 - You're monthly report template is done! Sit back and relax – or get back to billable work! |
Step 6 - Update any formulas to include the new rows of data. | |
Step 7 - Update any charts to include the new rows of data. | |
Step 8 - Review the data calculations to find and fix data errors | |
Step 9 - Add your agency’s insights and analysis. | |
Step 10 - Format the report as needed. | |
Step 11 - Send the report to the client. | |
Step 12 - Wonder if they opened it and understood it. |
The initial setup of the dashboards and the reports might take upwards of an hour per client, but having those reports automatically sent out monthly is an absolute dream.
- Jessica Weiss, Director of Marketing & Strategic Partnerships, One Firefly
How to make the switch
Sign up for AgencyAnalytics–take advantage of the free 14-day trial
Add your client
Add your client’s integrations (there are 85+ to choose from, like Google Analytics, Facebook, YouTube, Mailchimp, etc.)
Connect the Google Sheets integration to add any extraneous custom data
Create and schedule your reports
Once you add your first client, get the most out of your free trial by connecting your integrations and setting up your first report. Expect less frustration, more time, and more billable hours.
Best marketing reporting software and tools
As marketing data becomes more complex, choosing the right marketing reporting software platform plays a bigger role in centralizing data, automating reporting, and visualizing performance. Below are two widely used platforms, along with the client reporting features agencies need to track performance and communicate results.
AgencyAnalytics: overview, features & pricing

If you run an agency, AgencyAnalytics functions as an automated client reporting platform built specifically for agency workflows.
It connects with more than 85 marketing tools—including Google Ads, Facebook Ads, SEO platforms, and analytics tools—providing powerful integrations for marketing data so you can pull performance insights from multiple sources into one place. Automated dashboards and white label reports deliver professional client reports without hours of compiling.
Key features:
Multi-channel marketing dashboards
Automated and scheduled client reports
White label reporting for agencies
Integrations with major marketing platforms
Custom dashboards and KPI tracking
Pricing: Plans start at around $25/month, depending on the number of client campaigns and integrations you need.
Looker Studio: overview, features & pricing

Looker Studio (formerly Google Data Studio) is Google’s free dashboard tool for building customizable marketing reports.
If you already rely heavily on Google Analytics, Google Ads, and other Google products, it’s a solid option for visualizing data and sharing dashboards with clients or stakeholders. The tradeoff is that building and maintaining dashboards takes more manual setup than a dedicated reporting platform.
Key features:
Free reporting dashboards
Native integrations with Google platforms
Highly customizable visualizations
Shareable dashboards
Pricing: Looker Studio is free to use, although many agencies use paid connectors or additional tools to expand its integrations.
Best practices for marketing reporting
The biggest shift in marketing reporting is moving beyond presenting data to delivering clear insights and recommendations. Marketing teams now deal with data across paid search, social, SEO, content, and analytics tools, which quickly becomes fragmented without the right systems.
A few best practices can help:
Focus on insights, not just metrics
Standardize KPIs across platforms
Connect data across channels
Highlight trends and anomalies

Set up anomaly detection and metric alerts within AgencyAnalytics, and receive a notification any time your chosen metric dips or spikes. Try it free for 14 days!
Why some agencies stick with manual reporting (even though they shouldn’t)
You know the process is clunky. But change feels risky when your clients rely on you for accurate, on-time reporting. Staying manual doesn’t just waste time—it keeps your digital marketing efforts buried in busywork instead of focused on strategy and results.
Here are the most common reasons agencies stay stuck—and why they don’t hold up.
“We’re used to doing it this way—and it works (kind of).”
Sure—it works. Until it doesn’t. Manual workflows might get the job done, but they also lead to missed opportunities, errors, and reports that fail to deliver actionable insights. You might be sending a monthly report, but is it one that helps clients make informed decisions?

Automating also frees up leadership. Instead of reviewing slides and checking formulas, your marketing leaders can focus on strategy, growth, and client relationships. When agencies finally make the switch, they usually say the same thing: “We should have done this a long time ago.”
The only regret we have about switching to AgencyAnalytics is not doing it sooner. It has saved us an incredible amount of time and makes us look polished and professional.


“It’ll be too technical to set up.”
This is probably the number one hesitation. But AgencyAnalytics was built for marketers, not developers. No coding. No custom scripts. Just connect your platforms—social, email, or search engine marketing—and start building reports in minutes. A library of report templates makes it easy to launch, and each monthly report can fit your agency’s branding and target audience.
“What if a data connection breaks?”
It’s a valid concern. Your clients expect accurate, reliable data. With 85+ direct integrations, including Google Data Studio, Facebook, GA4, and more, your key metrics are pulled directly from the source. No exports. No patchwork. Automated alerts flag any sync issues before they impact your reports—so you're in control long before clients even notice.
Future trends in marketing reporting
Marketing reporting is evolving from backward-looking summaries to forward-looking insights. Instead of simply explaining what happened last month, modern reporting tools identify trends, surface anomalies, and even help predict future campaign performance.
Key trends include:
AI-powered analytics: Identifying patterns and trends that are difficult to detect manually.
Cross-channel reporting: Unified dashboards that combine SEO, paid media, and social performance.
Real-time reporting: Live dashboards that allow faster campaign adjustments.
More strategic reporting: As automation handles data collection, marketers spend more time interpreting results and recommending actions.
Use AI to surface instant insights from marketing data
To save even more time—or help junior team members ramp up—AI-generated insights highlight performance shifts across channels. The platform flags anomalies, trends, and outliers automatically: a second set of eyes on your data, helping you spot what matters most before your client asks.

Building a smarter marketing reporting system
The role of reporting is shifting. The goal is no longer just to show what happened, but to help marketing teams understand what to do next. AgencyAnalytics’ customer research highlights a clear opportunity: differentiation doesn’t come from automation alone, but from delivering reports that combine data, context, and clear insight.
If you’re heads-down creating complex reports your clients may not even read, you’re missing out on the results-driven tool trusted by 7,000+ agencies. Use automated reporting software to visualize your client's KPI data instantly, save time, and easily compare month-over-month.
Platforms like AgencyAnalytics combine reporting dashboards with client reporting and management solutions, keeping performance data organized and easy to share. From SEO to paid ads, your team surfaces the right metrics faster and turns marketing data into decisions.
Sick of building reports from scratch? Automate reporting with a free 14-day trial of AgencyAnalytics.
Anya Leibovitch is a B2B SaaS content marketing specialist. She partners with tech companies to design and execute their content marketing strategy. A writer first and foremost, she harnesses the power of storytelling to build and strengthen relationships between companies and the clients they serve.
Read more posts by Anya LeibovitchWhat other agency experts are reading

Weekly marketing reports: How to create client-ready updates that prove ROI
Learn how to create a weekly report that impresses clients and proves ROI with free templates, real examples, and step-by-step instructions.

The TL;DR weekly summary report: How to win clients over with shorter, smarter updates
Tired of sending reports that go unread? This guide shows you how to create clear, concise weekly summary reports that highlight key insights, build trust, and keep clients engaged.

How to position client reporting as a unique differentiator
Agencies are using reporting dashboards as more than just a deliverable—they’re showcasing them as proof of performance. Here’s how to make reporting part of your pitch, website, and onboarding flow—with free visuals to help you stand out.