Table of Contents
QUICK SUMMARY:
B2B client reporting doesn’t have to eat up your team’s time. This guide covers the top reporting tools agencies use in 2025, how to build client-ready dashboards that drive decisions, and the best practices that turn reporting into a strategic advantage. If your agency’s ready to streamline reports, impress clients, and save hours every week, this one’s for you.
It’s 7:42 p.m. on a Thursday. You’re still at your desk, pulling numbers from Google Ads, LinkedIn, and HubSpot. You’re pasting screenshots into a deck, rewriting client summaries, and trying to remember which metric matters most for this campaign. One report down, 22 to go.
This is how B2B client reporting still works in too many agencies. It eats hours. It slows everything down. It delays the strategic conversations your clients want to have.
Clients hire you to show results. And that starts with reporting that’s fast, clear, and focused on what moves the needle. They need to know where the wins are, what needs fixing, and where to invest next.
Agencies that deliver this kind of reporting use dashboards explicitly built for B2B. They’re integrating all their data sources. They’re surfacing insights automatically. And they’re using those insights to lead more effective client conversations.
This article shows how to build that kind of reporting system—one that saves time, improves retention, and gives every client the clarity they’re paying for.
Understanding B2B Reporting
Before choosing tools or building dashboards, it’s essential to define what B2B reporting involves. Too often, it’s treated like a checklist item—pull some numbers, paste them in a slide deck, and send it off. However, that approach misses the bigger picture.
B2B reporting helps agencies prove their value, align with a client’s business goals, and guide every decision that follows. It’s the foundation for a comprehensive strategy and stronger retention.
What is B2B Reporting?
B2B reporting means breaking down business-to-business marketing and sales performance metrics in a way that speaks directly to decision-makers.
The data should answer the questions clients ask daily:
Are we generating high-quality leads?
Are those leads turning into a promising pipeline?
Are we seeing ROI?
It’s your agency’s job to translate all the moving parts in a client’s sales and marketing efforts—SEO, paid ads, email campaigns, CRM data—into a story that’s easy to understand and built around what your client cares about most: results that drive revenue.
B2B reporting involves selecting key performance indicators (KPIs), filtering the noise, and delivering insights that guide decisions.
The Importance of B2B Reporting in Modern Agencies
Clients expect more from their agency partners. They don’t want hand-holding or jargon. They want to know you understand their business model, sales cycle, and how each marketing initiative fits into the bigger picture.
B2B reporting gives your agency the credibility to lead those conversations. When done right, it builds trust, drives strategy, and opens the door for long-term partnerships.
Top B2B Reporting Tools in 2025
Clients don’t see the backend of your workflow. They only see the report. Whether it’s a monthly call or a shared dashboard, that report is your agency’s proof of performance. It’s how you show value, explain wins and losses, and guide next steps. So the tools you choose for B2B reporting matter—a lot.
The best tools work across industry verticals and make it easy to consolidate data, customize visuals, and automate the busywork. They help your team deliver consistent, accurate, insight-rich reports in a flash.
Here’s what top agencies are using in 2025 to track and report on marketing performance for other businesses.
1. AgencyAnalytics
AgencyAnalytics is the reporting software built specifically for agencies that need clarity and speed.
It eliminates the repetitive reporting tasks that eat into billable hours and pulls every data source into one unified marketing analytics platform, so your team isn’t juggling screenshots, spreadsheets, or last-minute edits before a client call. Reports are fast, consistent, visual, and built to show exactly what each client needs to know about their marketing objectives.
This is the tool agencies use when they’re ready to get serious about client service, scale reporting across dozens of accounts, and still have time to focus on strategy.
Key Features
80+ direct integrations including Google Ads, HubSpot, and LinkedIn
White labeled dashboards and reports
Automated report scheduling and delivery
Custom widgets and drag-and-drop dashboard builder
Built-in AI insights to surface key trends automatically
Industry benchmarks and trends forecasting
Unlimited client logins for real-time access

Agency Tip: While some B2B soft tools focus on internal analytics, agency reporting tools must be client-ready at every stage. See how AgencyAnalytics stacks up against the competition.
2. Looker Studio
Looker Studio (formerly Google Data Studio) gives agencies control over how data is visualized and shared. For teams with technical skills, it becomes a blank canvas—one where they can design highly customized reports that speak to each client’s exact goals and KPIs.
This strategic tool works best for agencies that need deep customization and have the resources to build and maintain complex dashboards in-house.
Key Features
Free to use with unlimited dashboards
Dozens of native and third-party data connectors
Full control over design, layout, and filters
Real-time data updates
Shareable dashboards with custom permissions
Embeddable in client portals or intranets
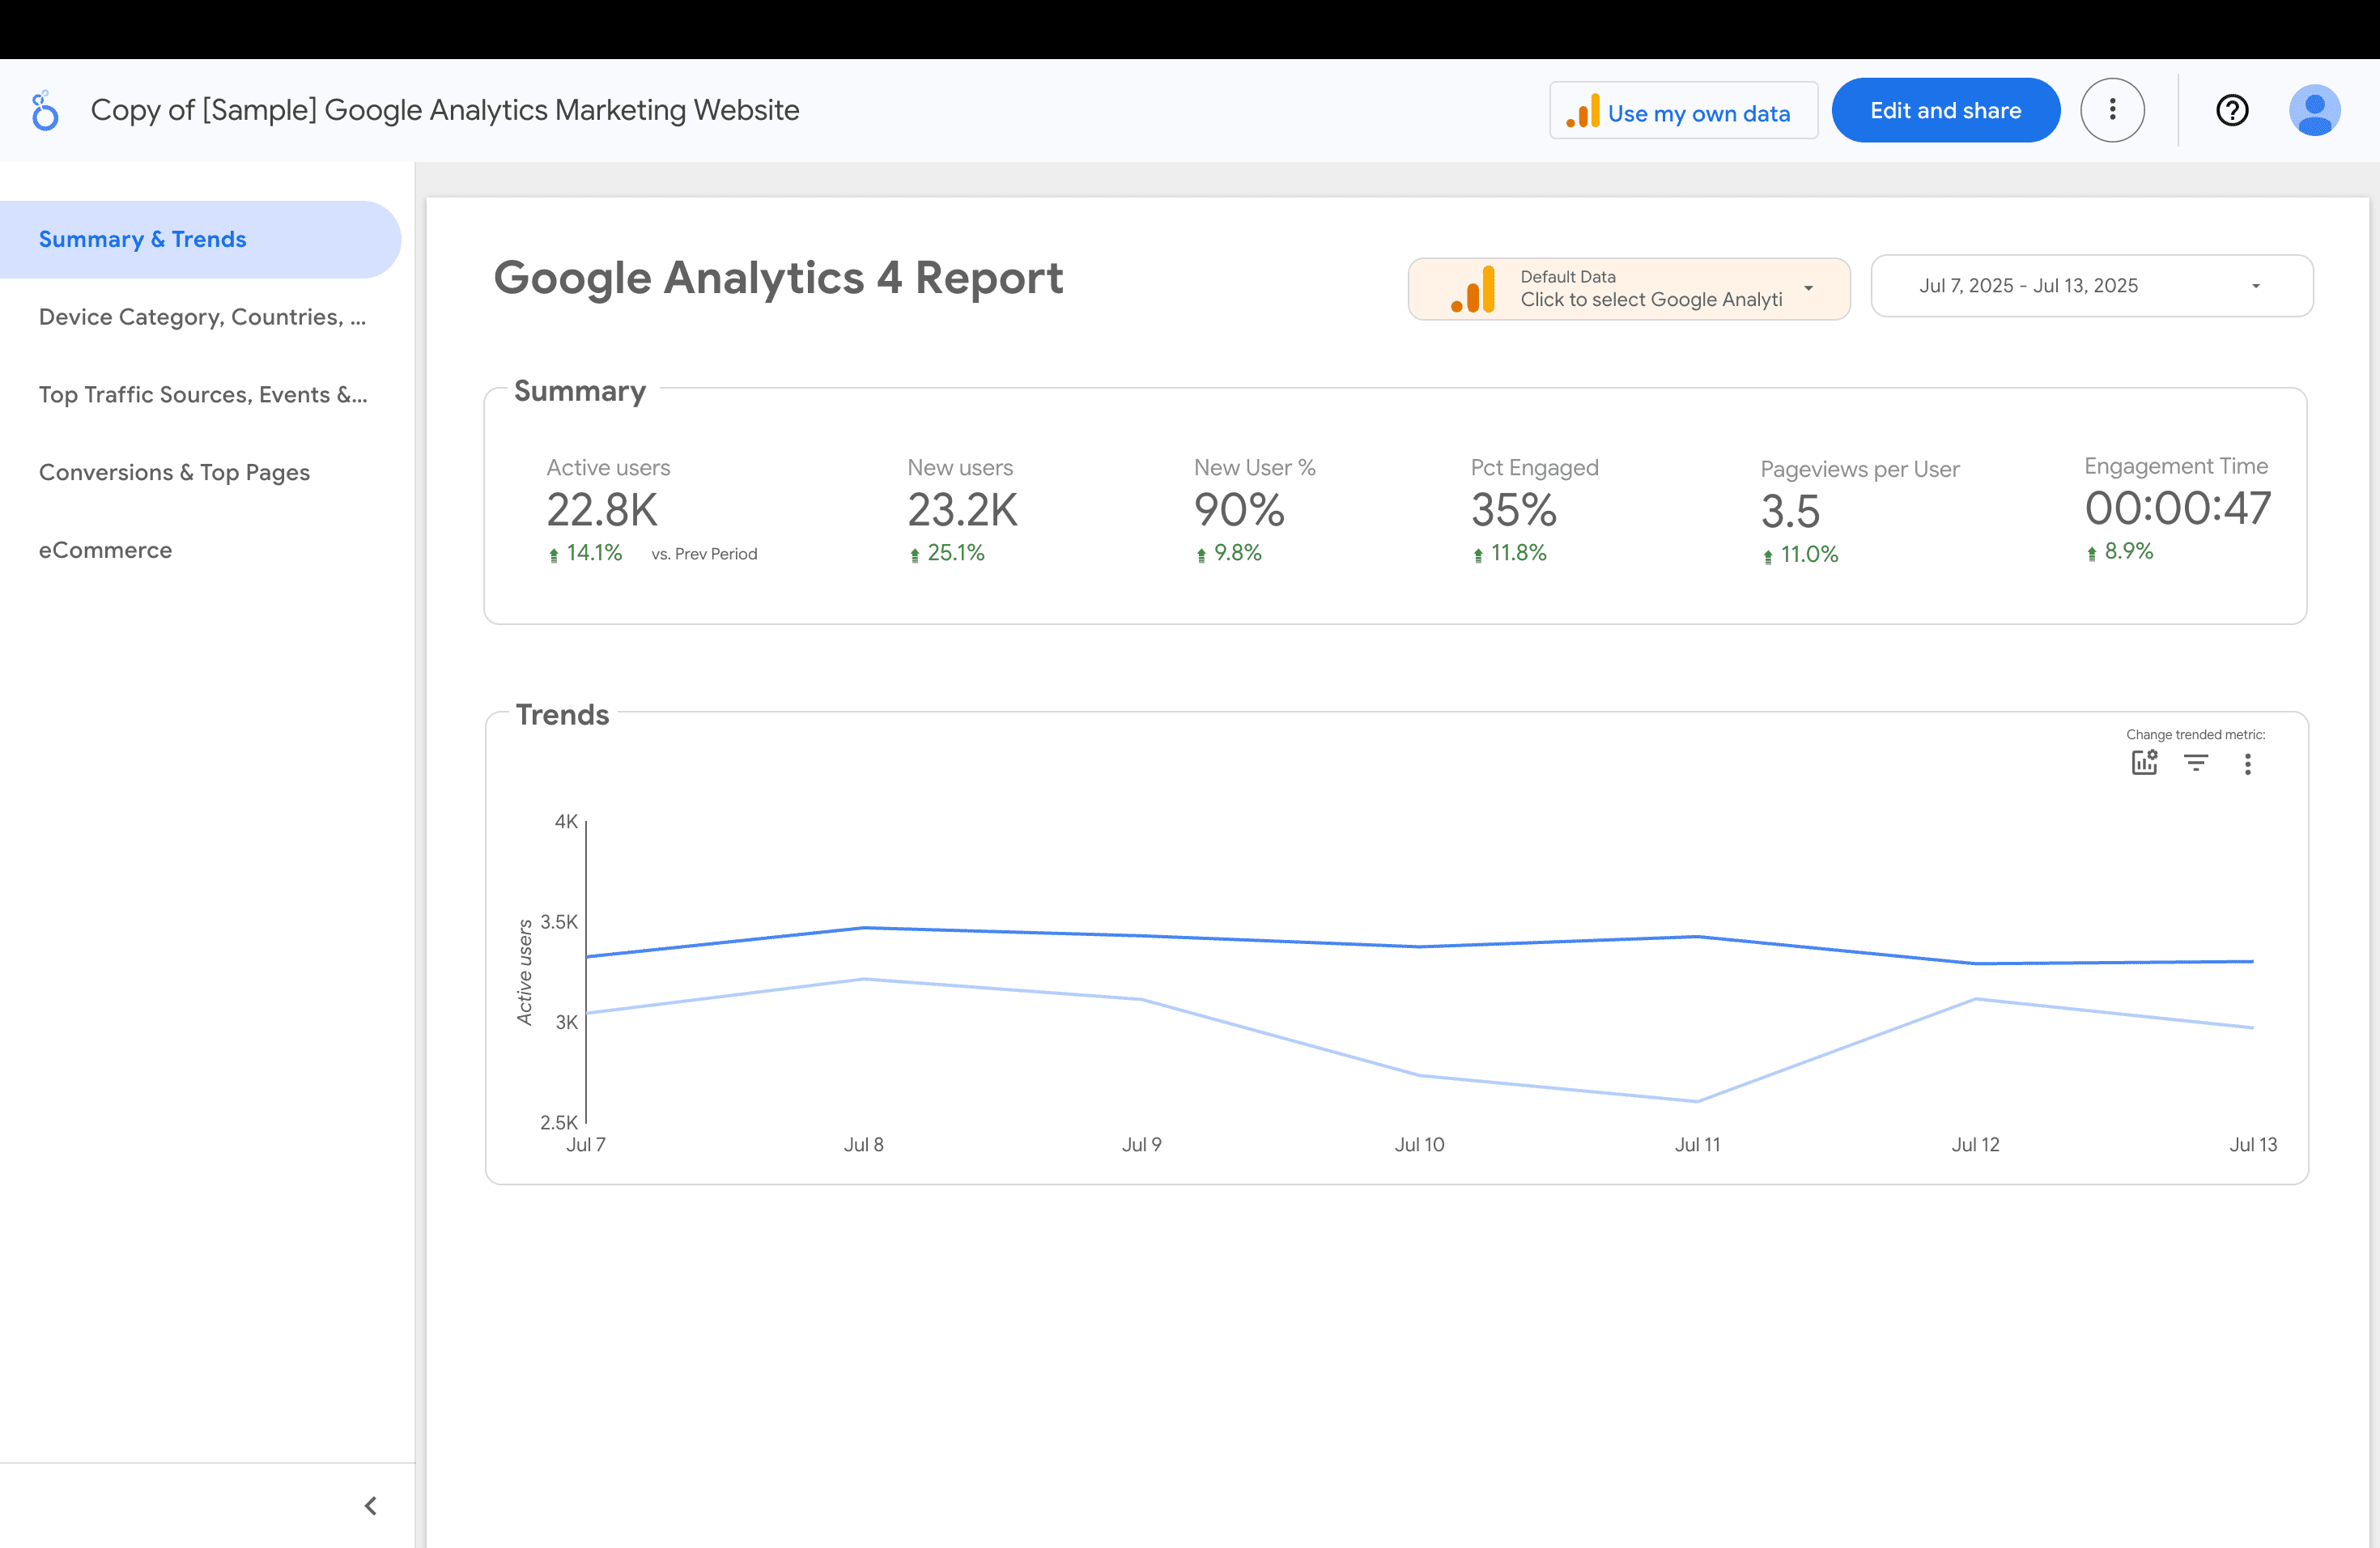
(Credit: Google)
3. Google Analytics 4 (GA4)
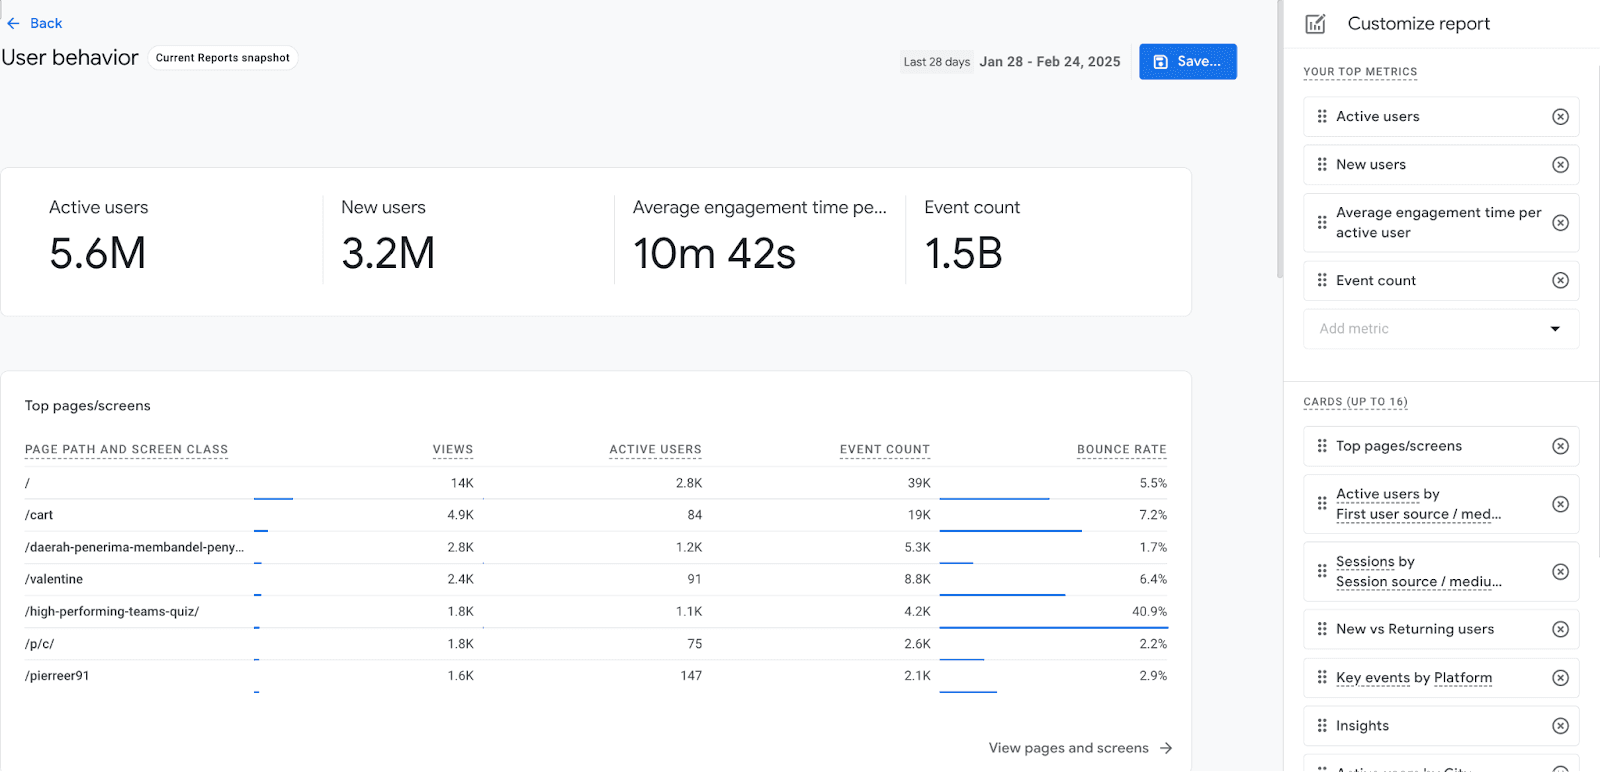
GA4 is the default analytics platform for nearly every client you serve. However, what sets it apart for B2B is its ability to track complex customer journeys across multiple sessions, devices, and touchpoints. GA4 focuses on events, not just pageviews, so agencies can measure micro-conversions that matter in longer B2B sales cycles.
GA4 is a must-have data source for any reporting stack. When GA4 is integrated into your dashboard or reporting platform, it gives clients a clear picture of how users engage, where drop-offs happen, and which content drives the right kind of action.
Key Features
Event-based tracking for deeper behavioral insights
Cross-device and cross-platform tracking
Funnel and path exploration for B2B user journeys
Native integration with Google Ads
Custom events and goals tailored to client KPIs
Predictive metrics to anticipate future actions
(Credit: Google)
4. HubSpot
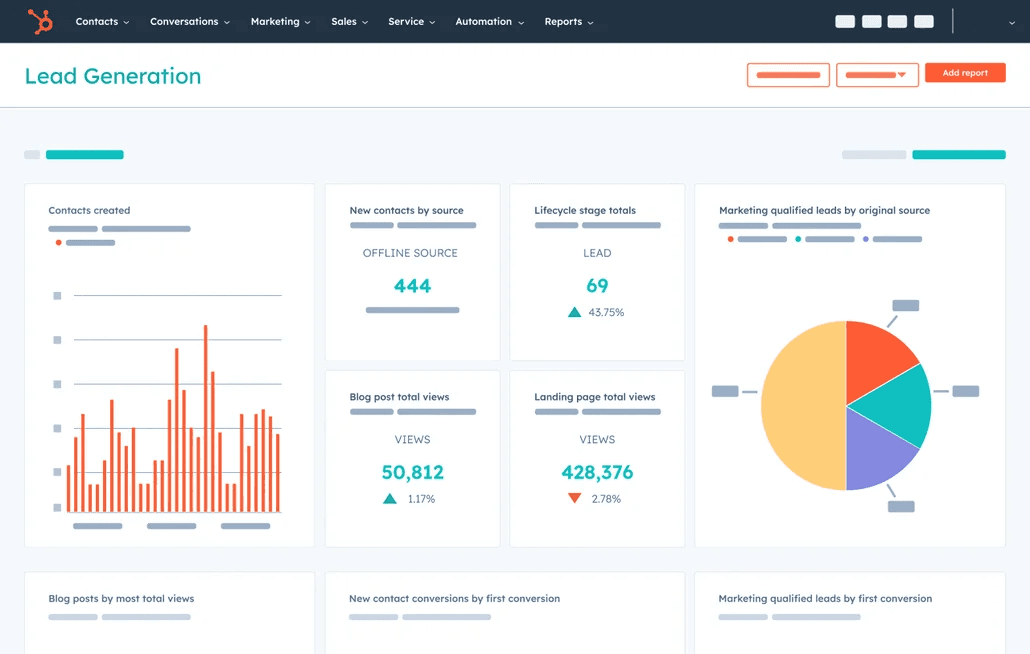
HubSpot is the heartbeat of many B2B client ecosystems. It tracks every email, form fill, ad interaction, and sales touchpoints—all in one place. For agencies, that means direct access to the full lead lifecycle, from first click to closed deal.
It’s especially powerful when paired with other tools in a unified dashboard. You can show clients exactly how campaigns are contributing to pipeline and revenue, without needing to piece together reports manually.
Key Features
Built-in CRM, marketing automation, and sales tracking
Lifecycle stage and lead source attribution
Email performance, ad ROI, and workflow analytics
Custom reports and dashboards
API access for advanced reporting configurations
(Credit: HubSpot)
5. Ahrefs
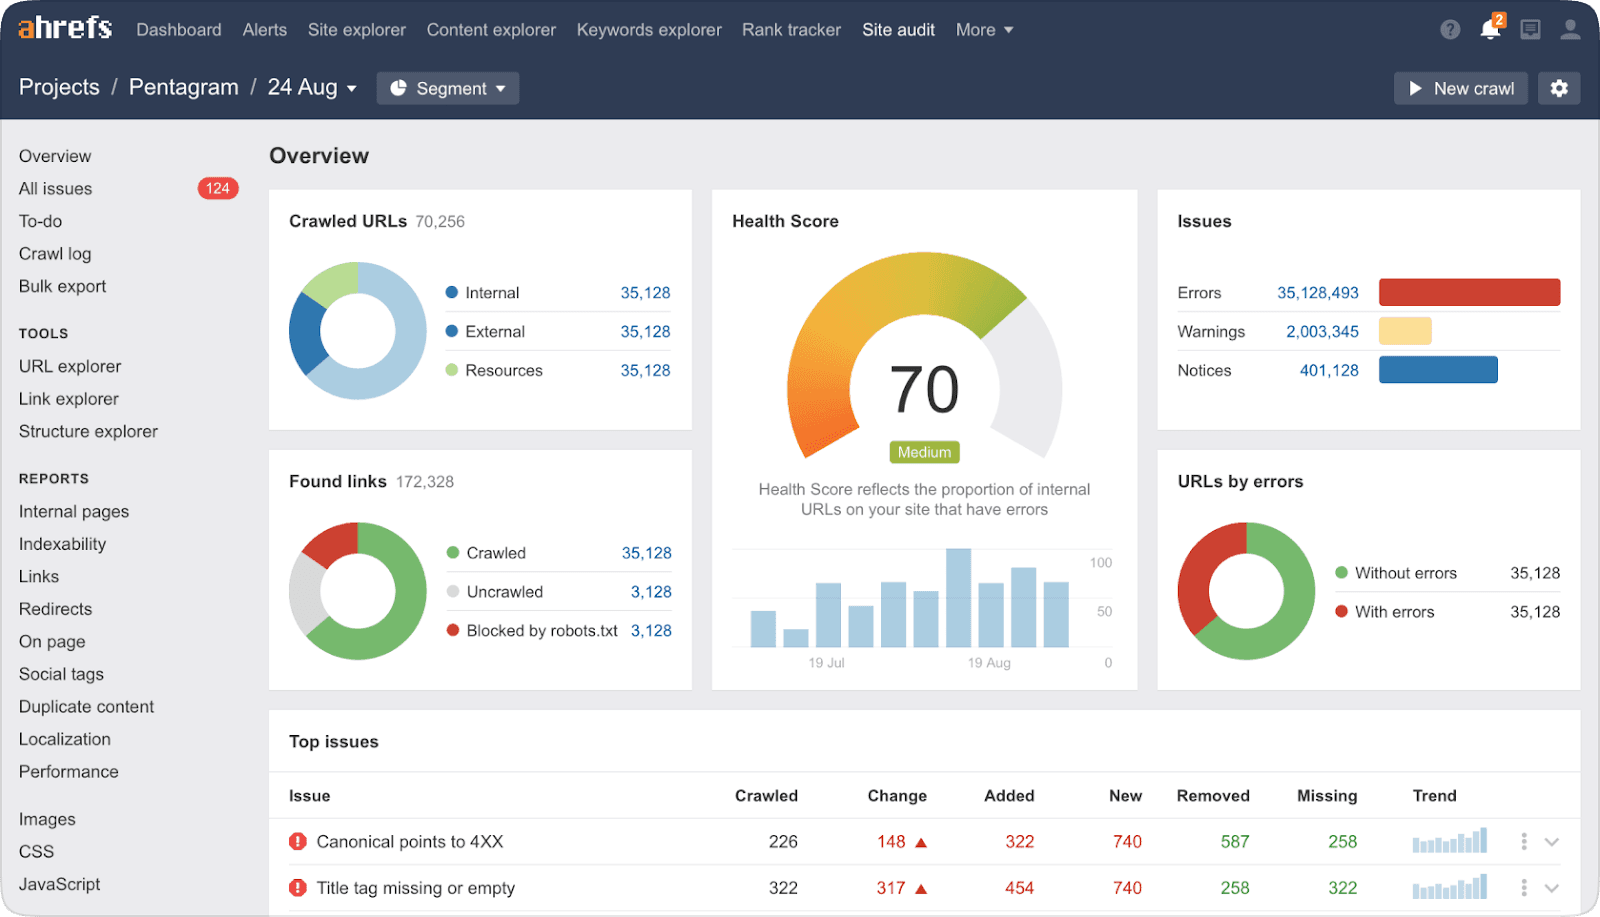
Ahrefs is the go-to SEO tool for agencies managing B2B content and inbound strategies. It tracks keyword rankings, backlinks, site health, and competitor activity.
For B2B clients investing in long-term organic growth, Ahrefs provides the visibility they need to understand how search visibility translates to qualified traffic.
Key Features
Daily and weekly keyword rank tracking
Backlink analysis and domain authority metrics
Competitor benchmarking
Site audits and actionable recommendations for technical SEO
Content gap analysis to guide editorial planning
(Credit: Ahrefs)
6. Tableau
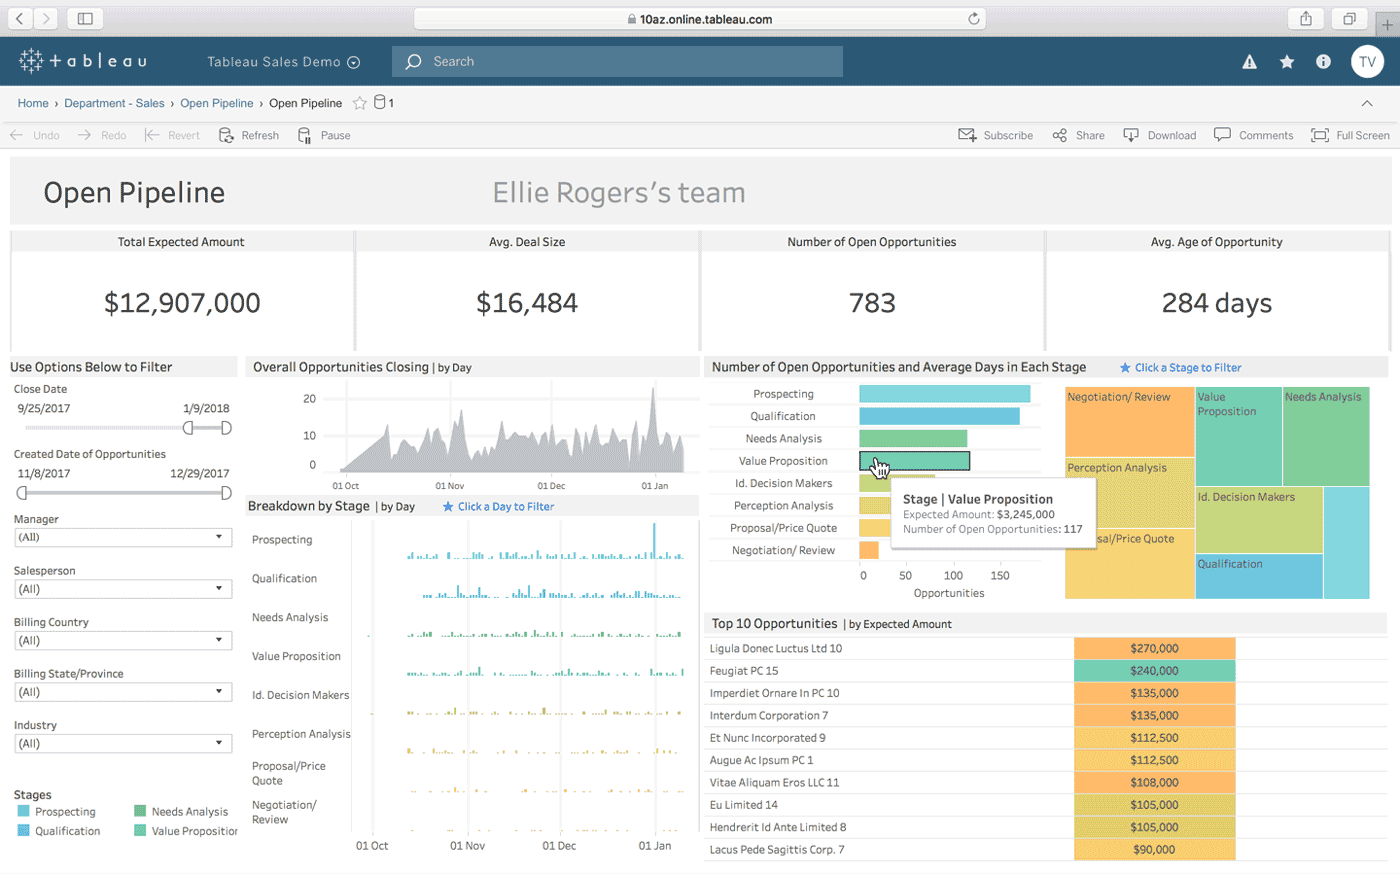
Tableau is built for data analysts and power users who need advanced analytics features. However, when it’s dialed in, it’s one of the most dynamic reporting platforms available.
Agencies use it to create interactive dashboards that visualize complex B2B data in ways that are easy for clients of different business sizes to explore and understand.
It’s especially useful for larger clients with layered sales funnels, high-volume data, or internal stakeholders who expect custom views and advanced filtering.
Key Features
Interactive dashboards with drill-down capabilities
Supports live data connections and real-time updates
Advanced filtering to segment data and create calculated fields
Integration with Excel, SQL databases, Salesforce, and more
Custom sharing and permissions controls
Enterprise-grade scalability and performance
(Credit: Tableau)
7. Power BI
Power BI is Microsoft’s business intelligence powerhouse. Agencies use it to aggregate data from across client systems—CRMs, ad platforms, financial tools—and turn them into dashboards that drive decisions.
For B2B clients, especially those with internal reporting requirements, Power BI bridges the gap between marketing and business outcomes.
It’s best suited for teams that work with enterprise clients or need to connect with internal tools that aren’t always marketing-specific. With the proper setup, it delivers highly customized, real-time insights with serious reporting muscle.
Key Features
Native integrations with Microsoft ecosystem (Excel, Dynamics, SQL Server)
Robust data modeling and DAX calculations
Real-time dashboards with automatic refresh
Advanced visualizations and filtering options
Row-level security and custom user roles
Scales easily for large datasets and multi-client use
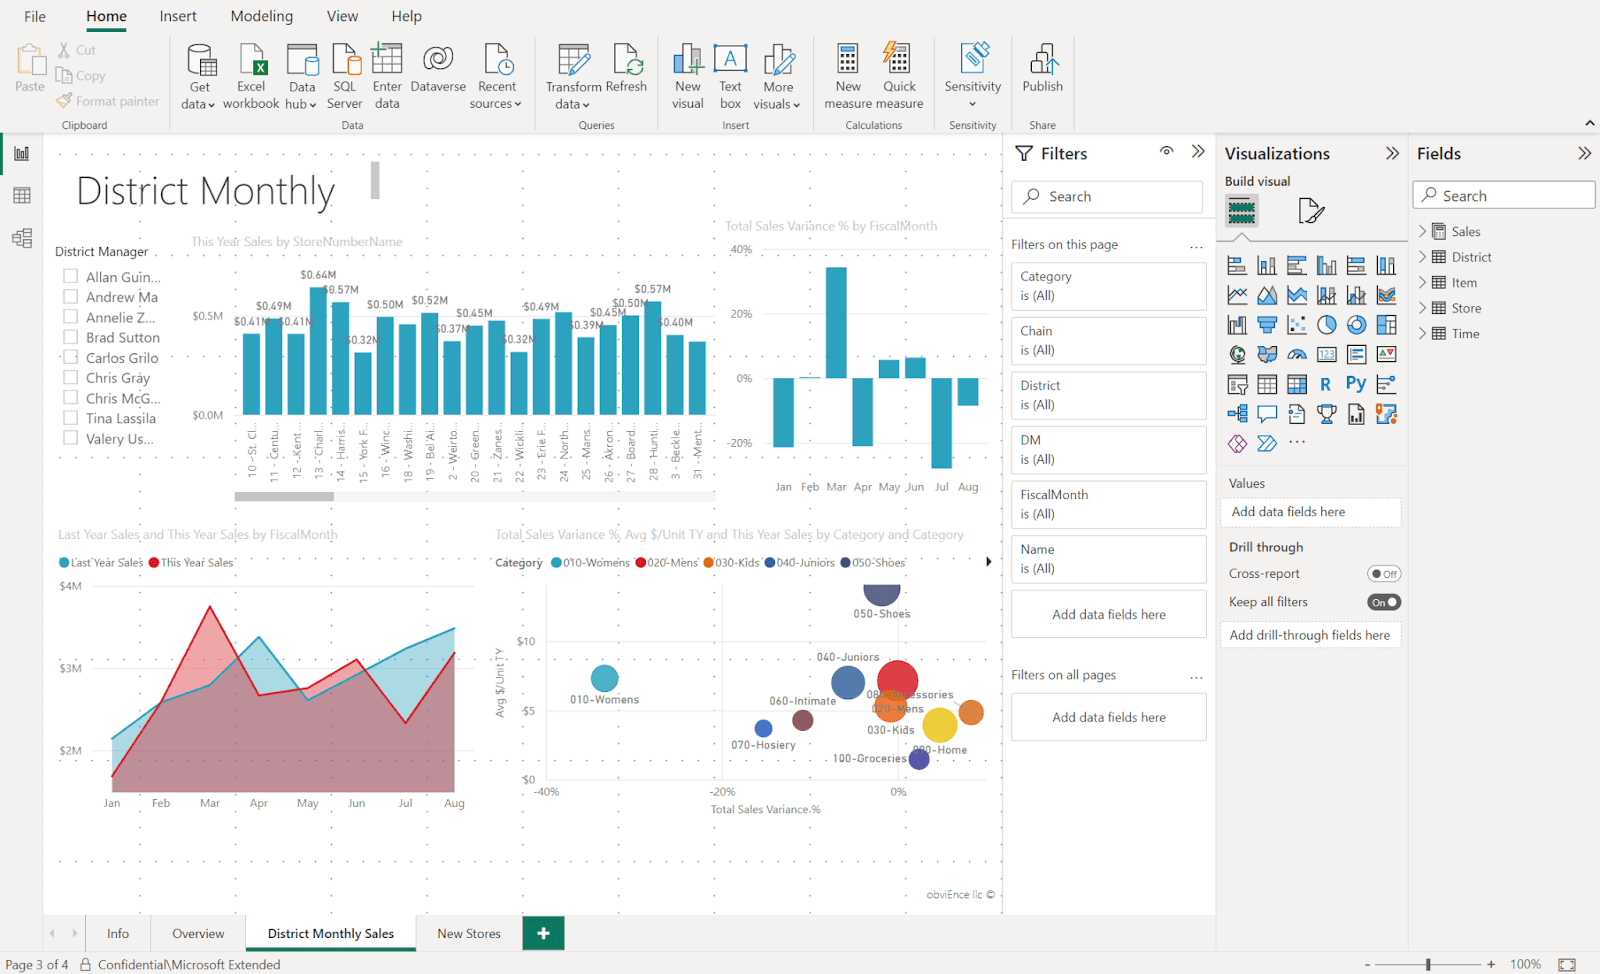
(Credit: Microsoft)
Building Effective B2B Reporting Dashboards
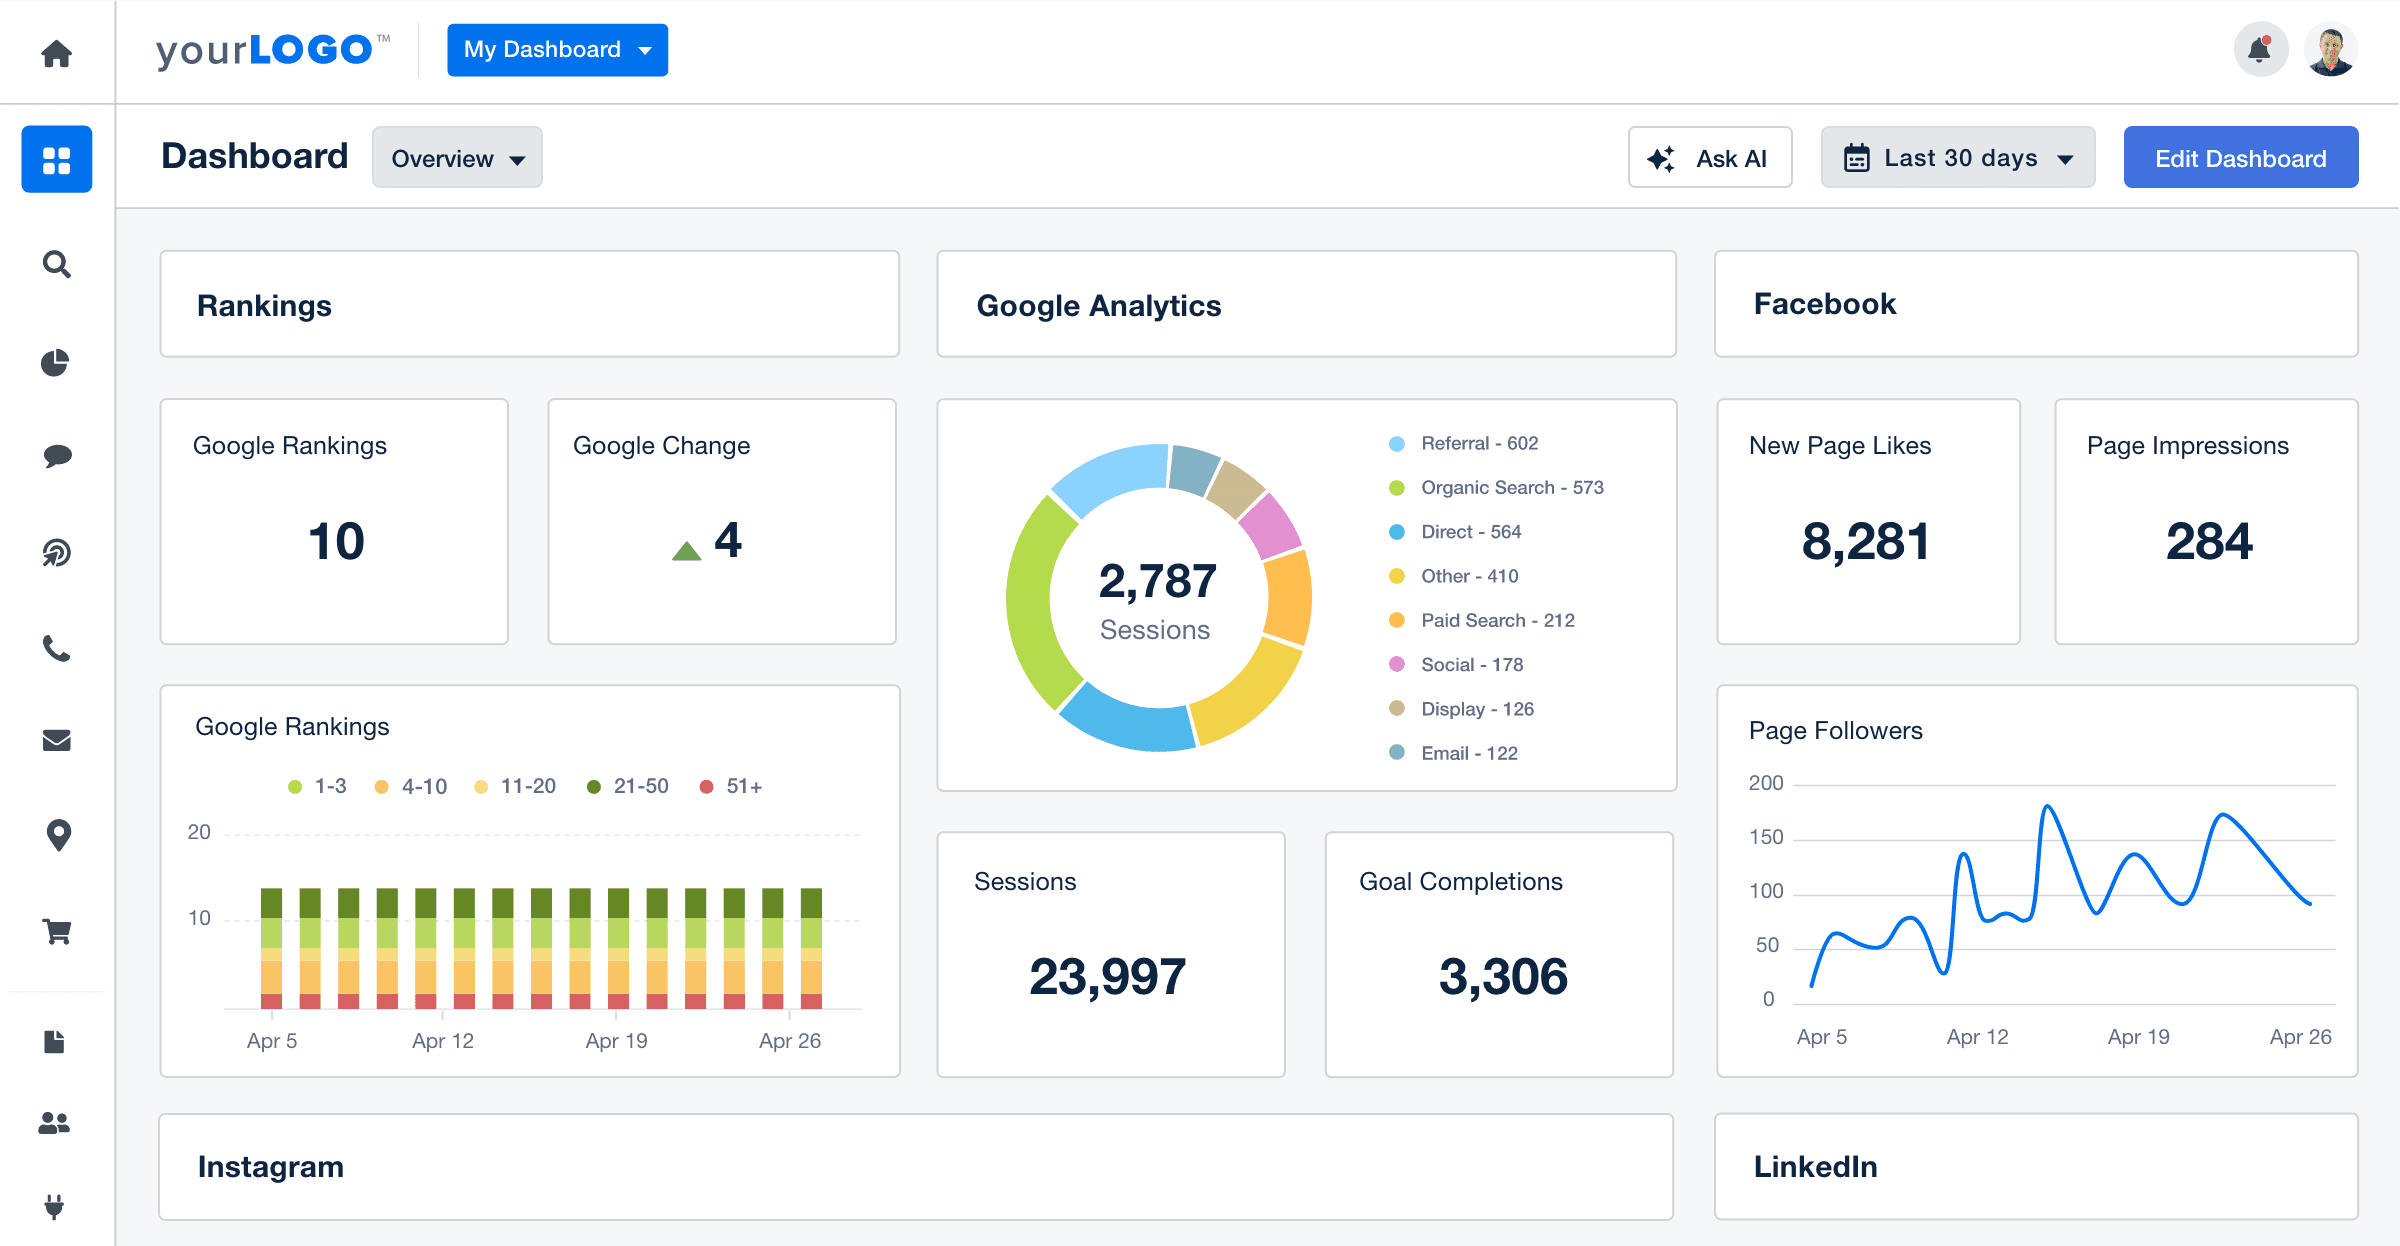
Your team has data collection coming in from every direction. Leads in HubSpot, marketing spend in Google Ads, rankings from Ahrefs, and user behavior in GA4. Turning all of that into clear, client-ready dashboards is one of the most demanding parts of your agency’s workflow.
Clients expect more than a pile of numbers. They want you to use clear visual aids to highlight what matters most to their business operations.
That means every dashboard you build must be accurate, consistent, and easy to understand. It needs to speak their language, not yours.
Agencies that build effective B2B dashboards set themselves up for faster approvals, stronger retention, and easier upsells. These dashboards reduce back-and-forth, improve clarity, and support stronger customer retention by aligning keep everyone aligned on goals and outcomes.
Key Metrics To Include
Clients care about metrics that show movement in their sales funnel and business processes. When they open a dashboard, they want to see whether marketing is generating leads, what those leads cost, and how they’re converting to revenue.
What Matters
Lead Volume and Quality: Total leads, qualified leads, and source breakdowns.
Conversion Rates: Visitor-to-lead, lead-to-MQL, and MQL-to-SQL progression.
Pipeline Contribution: Attribution for pipeline growth and closed revenue.
Campaign Performance: Channel-level KPIs for SEO, paid media, email, and content marketing.
Financial Metrics: Sales KPIs and marketing KPIs like cost per lead (CPL), customer acquisition cost (CAC), customer lifetime value (CLV), return on ad spend (ROAS), churn rate, and revenue growth.
Sales-Readiness Signals: Engagement data tied to lead scoring and intent.
Dashboards should give each client a direct view into performance without distraction. Every metric should tie directly to the business objectives your client has set and support informed decision-making.
Integrating Multiple Data Sources
Reporting becomes easier when your tools talk to each other. Choose platforms with built-in integrations to your core tools and support for diverse data sources. Agencies that build dashboards with real-time integrations spend less time tracking down numbers and more time analyzing marketing performance.
What Matters
Choose platforms with built-in integrations to your core marketing tools.
Standardize metrics across sources for a single version of truth.
Match lifecycle tracking across platforms like HubSpot and LinkedIn Ads.
Tailor views to match the operational roles within your client’s organization—executives, account managers, and marketing and sales teams.
Automate scheduling to keep reports current without manual effort.
Dashboards work best when they pull every piece of data into one story. When that story is easy to follow, clients stay aligned and engaged.
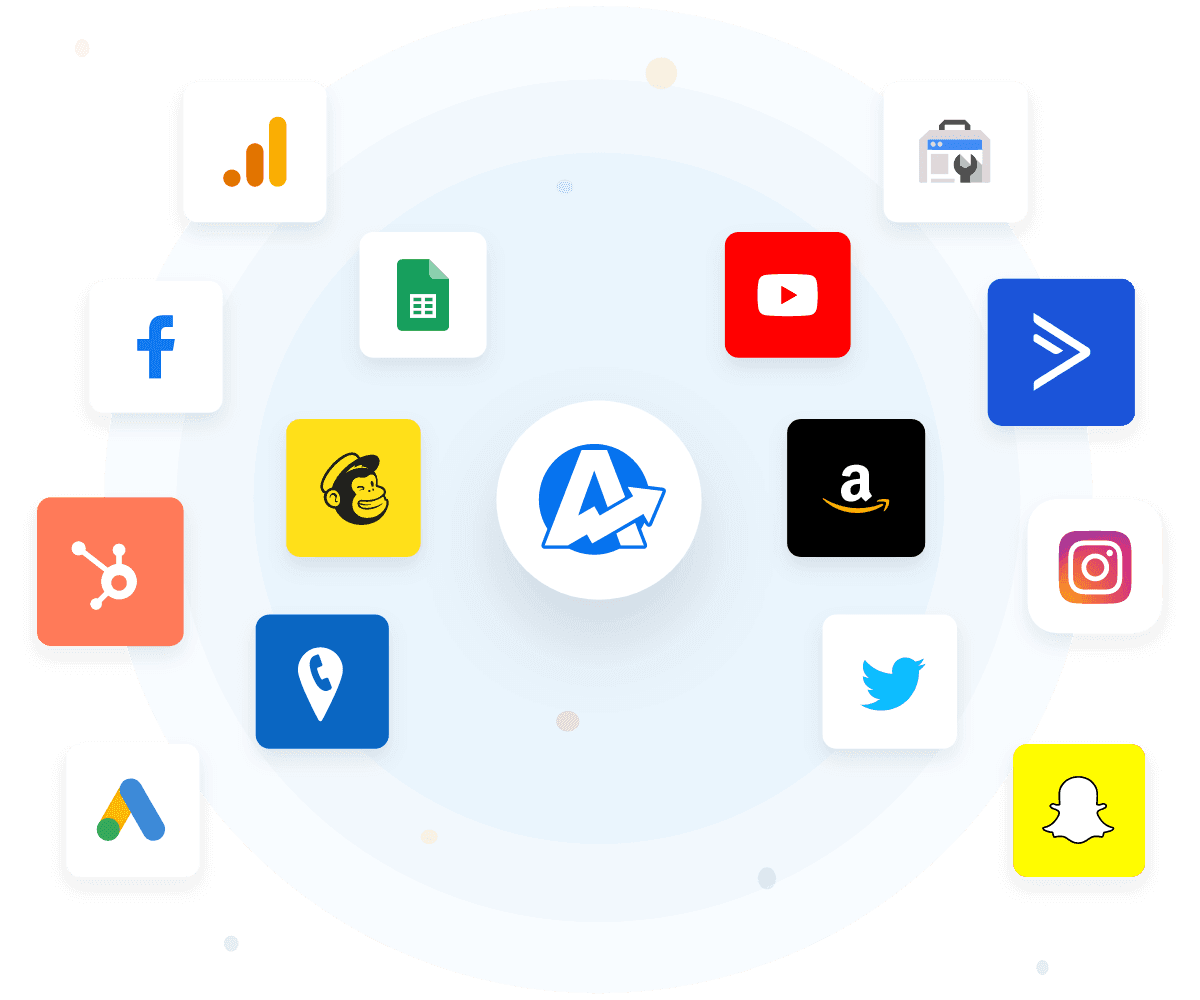
Juggling too many data points? Connect more than 80 marketing platforms under one roof with AgencyAnalytics. Give it a try for free for 14 days!
B2B Reporting Best Practices
So, you’ve got a packed meeting calendar, 18 active campaigns, and a client who wants their numbers “by end of day.” Again. It’s the kind of pressure that turns reporting into a chore, even when it’s the one thing that proves the value of everything your agency does.
But when reporting runs smoothly, it does more than show performance. It gives your team breathing room, gets clients aligned, and creates the kind of clarity that supports data-driven decision making—making you the first call, not the last-minute update.
The most efficient agencies have moved beyond spreadsheets and busywork. They’re optimizing the reporting process to turn reporting into a competitive edge and better allocate resources across accounts.
Leverage AI and Automation
Agencies are under pressure to do more with less. AI and automation take the heavy lifting out of reporting without cutting corners. Instead of spending hours writing summaries or digging for insights, your team will focus on performance strategy and client growth.
Used well, automation makes reports more timely and consistent, improving efficiency without losing the human context your team brings. When AI is built into your reporting tool, it helps identify patterns and hidden opportunities, flag issues, and detect market shifts before they become client concerns.
Tactics to Apply
Use AI-generated insights to surface key performance trends.
Set up automated alerts for performance dips or anomalies to address concerns early.
Maintain regular reporting cadence with updated data and custom commentary.
Automate the pull of metrics across channels to avoid manual errors.
Pair AI summaries with human review to keep the voice client-ready.
Automation doesn’t replace your team. It gives them more time to focus on what matters most: helping clients win.
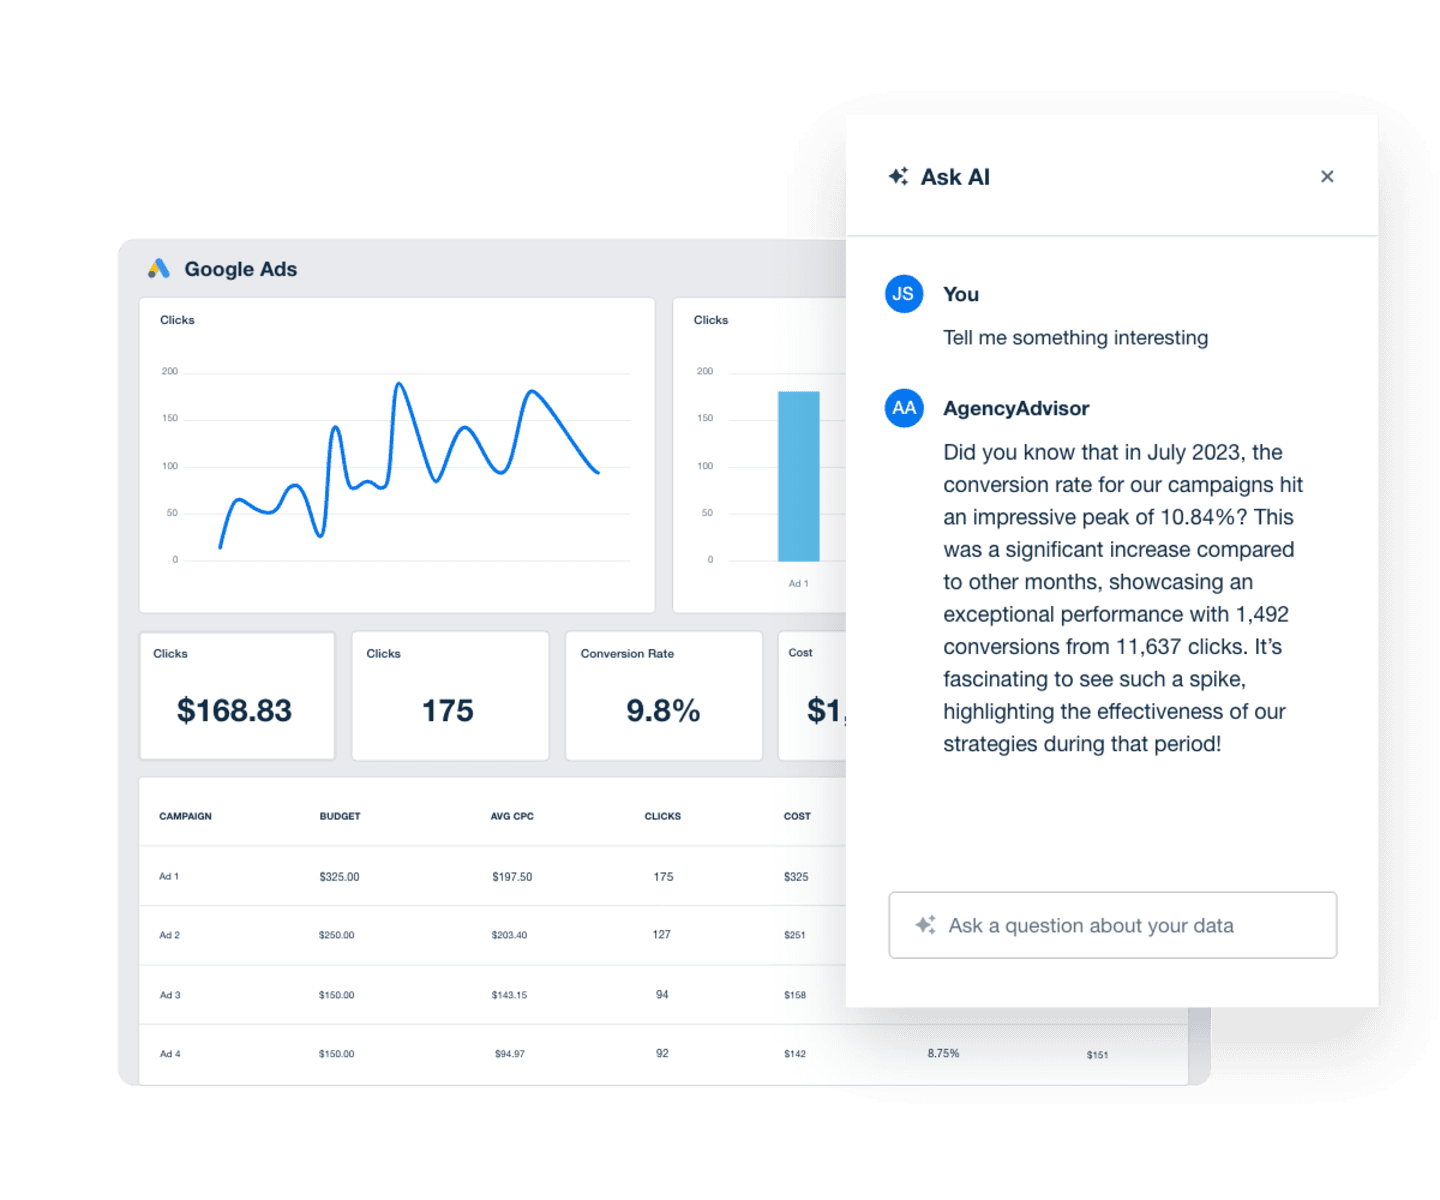
Not enough time to dig into all the numbers for client updates? Let AI surface actionable insights you need to show your clients their ROI. Get your free AgencyAnalytics trial access today.
Customize Reports for Different Stakeholders
Every client has multiple voices at the table.
One wants to know how many leads came in. Another wants to see cost per lead drop quarter over quarter. The CEO wants to know if marketing is actually driving revenue—what’s selling and how to get more sales. One report won’t work for all of them.
Agencies that tailor reports by role avoid confusion, speed up approvals, and turn reporting into a strategic advantage. Custom views keep each stakeholder focused on what matters to them and improve communications across marketing, sales, and executive teams.
Tactics To Apply
Build role-specific dashboards with filtered views and KPI groupings.
Use plain-language summaries for executive audiences.
Include deeper channel performance data for hands-on marketing teams.
Highlight sales-aligned metrics for client-side revenue teams.
Use permissions to control access by role when sharing dashboards.
When reports match the way clients think, they stop scanning and start engaging.
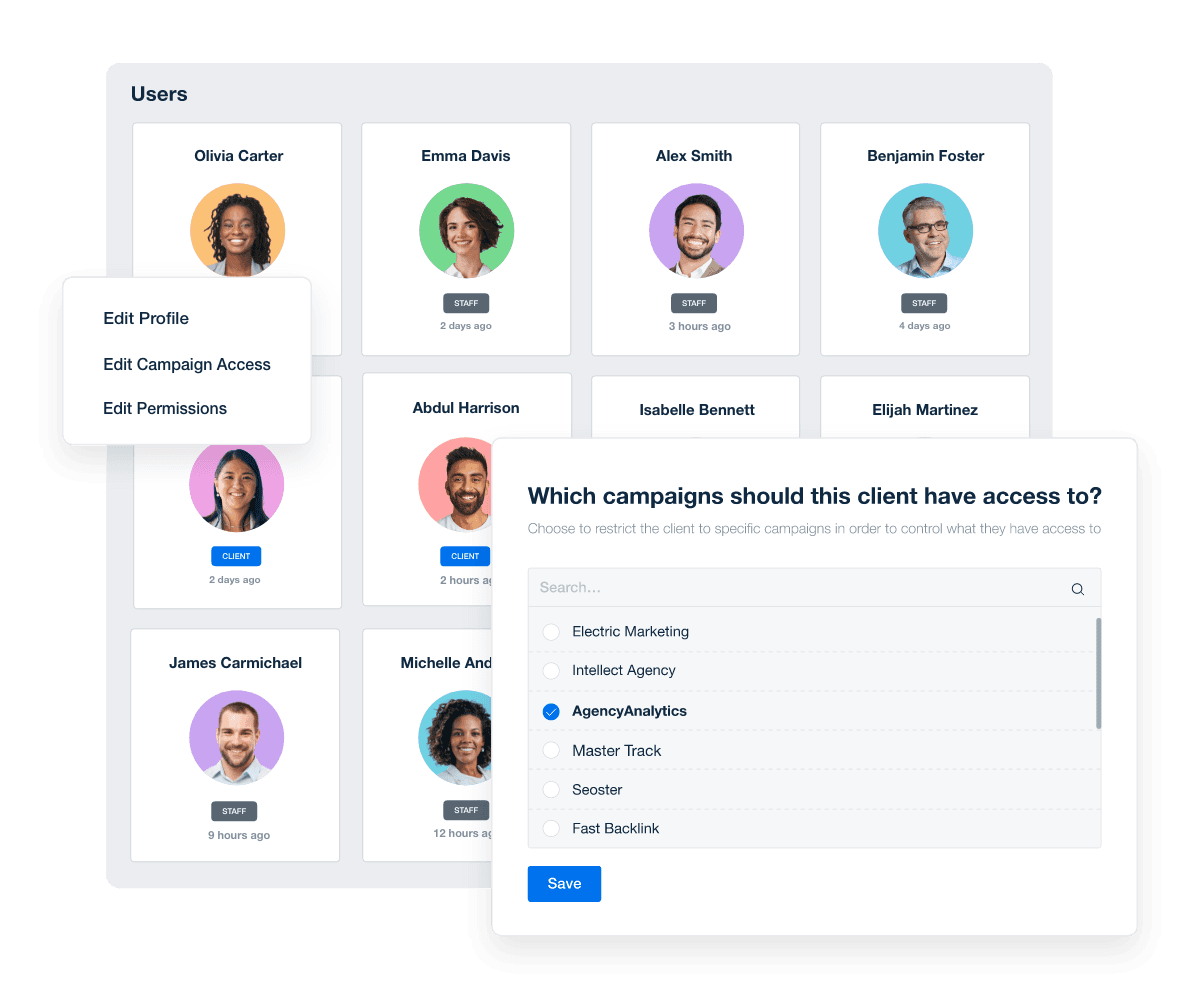
Tailor which campaigns and metrics your team members and clients have access to with custom user profiles in AgencyAnalytics. Try it free today!
Use CRM Data
CRM data is where the real story lives. Lead status, deal stage, source attribution, revenue won—this is the context that turns marketing metrics into business results. B2B clients don’t want to see traffic spikes without knowing whether those visitors became leads. They want to know what moved the pipeline.
Agencies that pull CRM data into their reports give clients answers to the questions they’re already asking. They also make it easier to show how each campaign supports the client’s long-run investment in company growth.
Tactics To Apply
Connect your reporting platform directly to the client’s CRM (e.g., HubSpot, Salesforce).
Track lead quality using lifecycle stages and scoring models.
Report on sales pipeline metrics influenced by marketing campaigns.
Highlight closed-won revenue tied to campaign or source.
Use CRM notes and statuses as qualitative data to add narrative context to data trends.
Clients rely on CRMs to track what happens after the click. Reporting should follow that same path.
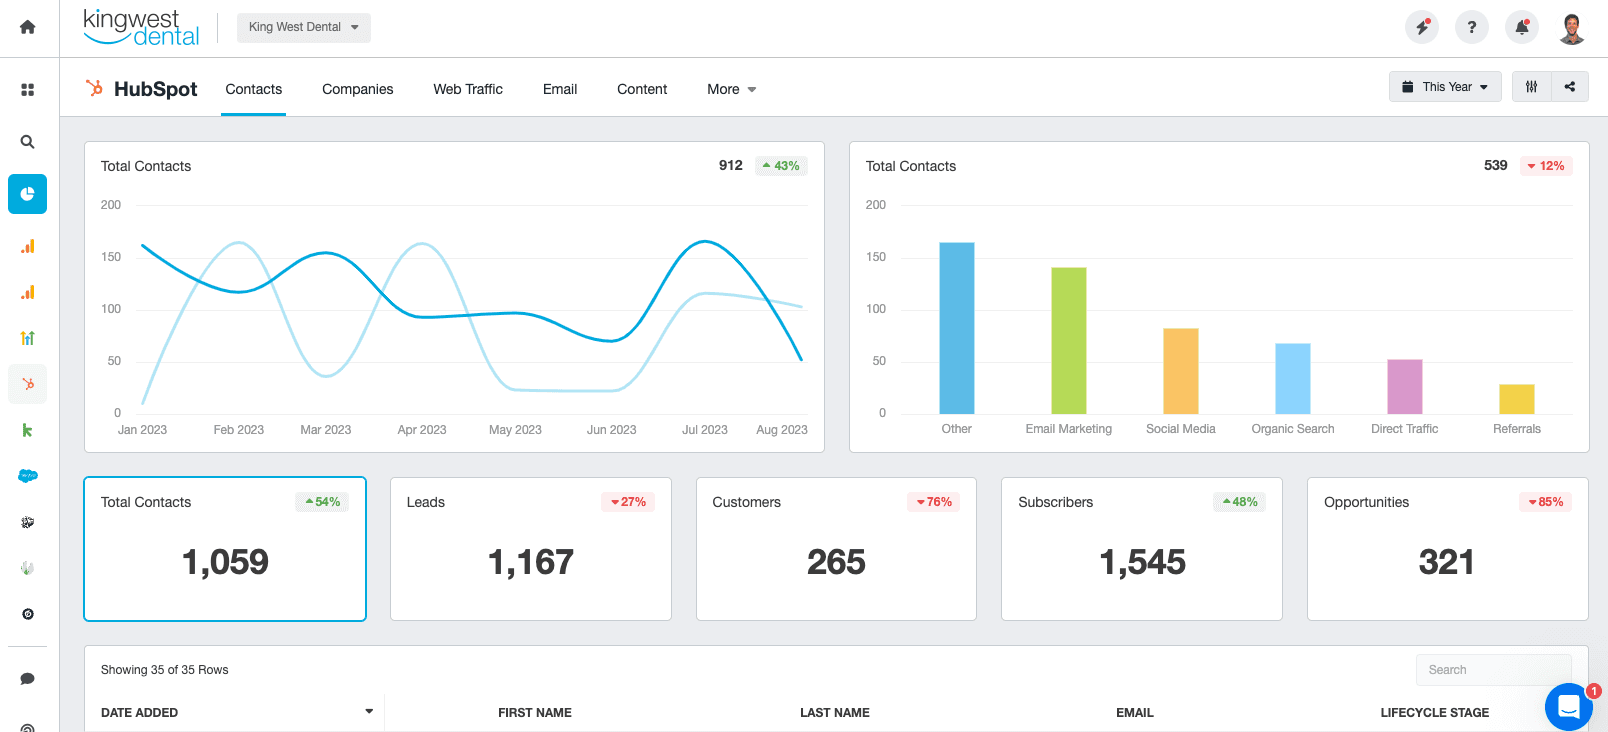
Track your client’s CRM KPIs alongside all their marketing metrics to build better campaign strategies that deliver results. Try AgencyAnalytics today!
Own the Report, Own the Relationship
Clients don’t remember every metric. They remember how your agency made the numbers make sense. They remember the moment your dashboard showed them exactly what to do next.
That’s what great B2B reporting delivers.
In 2025, the top agencies aren’t spending more time on reporting. They’re spending less. Their tools are smarter, their workflows are cleaner, and their dashboards are built to show performance trends over a clear period and answer client questions before they’re even asked.
AgencyAnalytics was built for exactly this. Connect multiple sources in one platform, automate every report, and give your clients the clarity they expect: Relevant metrics, more detail and clarity, and examples of what’s working and why it matters.
If you're ready to optimize your reports and regain time to drive results, get started with AgencyAnalytics.

Written by
Francois Marchand brings more than 20 years of experience in marketing, journalism, content production, and artificial intelligence (AI). His goal is to equip agency leaders with innovative strategies and actionable advice to succeed in digital marketing, SaaS, and ecommerce.
Read more posts by Francois MarchandSee how 7,000+ marketing agencies help clients win
Free 14-day trial. No credit card required.


