Table of Contents
QUICK SUMMARY:
B2B sales metrics track how well business-to-business sales processes work, focusing on growth and efficiency. These metrics show trends, help improve sales cycles, and boost deal success rates. This guide covers 18 key metrics that help agencies create clear reports, show real value to clients, and align sales strategies with business goals for long-lasting success.
Your client just asked you for a report on their B2B sales performance. You pull the usual numbers—leads, opportunities, and closed deals—but they respond with a frustrated, “What do these metrics actually mean for our business?”
Sound familiar?
Reporting on surface-level metrics won't cut it when clients rely on your expertise to track their sales performance. They want insights that demonstrate real value, and that tie back to their bottom line.
As a B2B-focused marketing agency, it’s important to track the right sales metrics to bridge the gap between data and actionable insights. This shows your clients how your efforts contribute to their goals, like shortening sales cycles or improving deal win rates.
In this article, we’ll dive into 18 B2B sales metrics every agency should track to provide meaningful insights in their client reports. We’ll go beyond the basic metrics and focus on what really matters to B2B clients: growth, efficiency, and long-term success.
Whether your clients are SMBs or enterprise businesses, these metrics will help you demonstrate value and strengthen your agency-client relationships.
Let’s get started!
What Are B2B Sales Metrics?
B2B sales metrics are measurable data points that agencies use to evaluate and optimize sales performance in business-to-business transactions.
These metrics show how effective and successful the sales process is, helping agencies spot areas for improvement and align their strategies with client goals. By focusing on the right sales and marketing performance metrics, agencies create reports that offer real insights instead of just surface-level numbers.
So, what is considered a sales metric, and why does it matter?
A sales metric is a specific data point that measures an aspect of the sales process, such as the number of leads generated, conversion rates, or the average deal size. These metrics are key for evaluating sales and marketing performance metrics and ensuring that your strategies contribute to long-term client success.
Tracking the right marketing metrics allows agencies to identify trends, address bottlenecks, and demonstrate how their efforts drive business results.
Types of Sales Metrics to Track
Understanding the types of sales metrics is the next step in creating effective reports for your B2B clients. These include:
Lead Metrics: Measuring how many leads enter the sales funnel and their quality.
Pipeline Metrics: Tracking deal stages and identifying conversion opportunities.
Revenue Metrics: Analyzing metrics like average deal size or revenue per rep to evaluate financial performance.
What Sales Metrics Should I Measure?
The answer depends on your client’s marketing goals. For example, clients focused on growth might prioritize pipeline metrics, while those aiming for efficiency may focus on sales cycle length. Tailoring metrics to client priorities ensures your reports remain relevant and impactful.
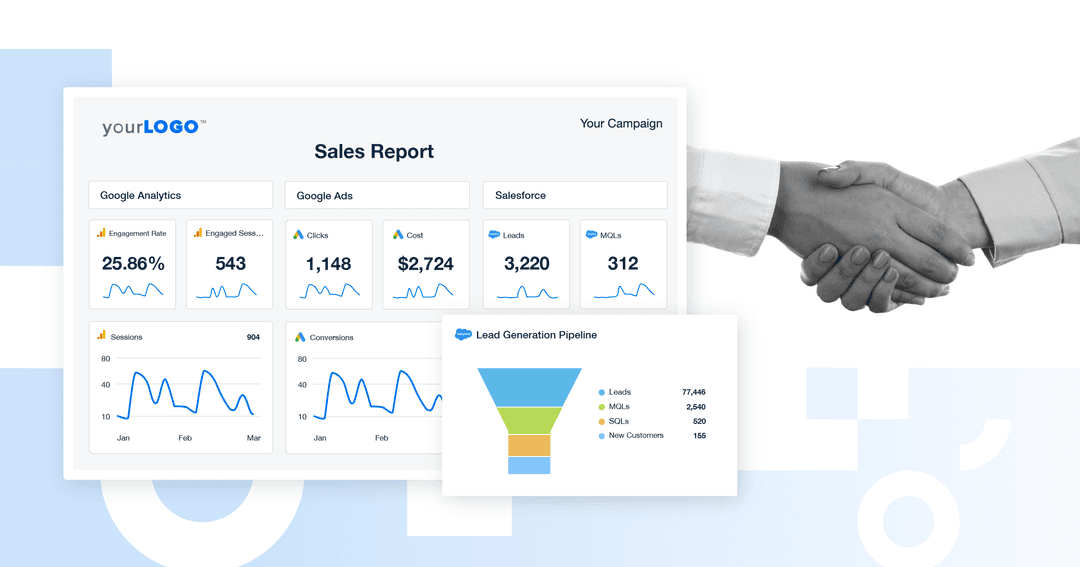
Connect the dots between marketing and sales in one, easy-to-understand client report. Try AgencyAnalytics free for 14 days.
18 Key B2B Sales Metrics to Track
When it comes time to report on B2B sales metrics, where do you start? Focus on the metrics below to uncover insights that align sales and marketing performance metrics with long-term client goals.
1. Net Sales
Net sales represent the total revenue generated after subtracting returns, discounts, and allowances. This metric provides a clear view of actual sales performance and helps assess overall profitability.
2. Average Revenue
Average revenue or average revenue per user (ARPU) measures the income generated per customer, giving insights into the quality of clients attracted and the success of sales strategies. Pay attention to this to identify growth opportunities for your clients.
3. Average Customer Lifetime Value
Average customer lifetime value (CLV) measures the total revenue a client generates throughout their relationship with the business. This helps agencies prioritize high-value clients and tailor strategies accordingly.
Read More: How To Use Customer Lifetime Value (CLV) To Set Acquisition Goals
4. Average Sales Cycle
The average sales cycle measures the time it takes to convert a lead into a customer. Shorter cycles typically indicate efficient sales processes, while longer cycles typically highlight areas needing improvement.
5. Monthly Recurring Revenue
Monthly recurring revenue (MRR) tracks the monthly predictable income clients generate from subscription-based products or services. It’s a key indicator of revenue stability and highlights growth opportunities or retention risks. MRR helps sales and marketing teams assess the effectiveness of strategies in attracting and keeping high-value customers.
Read More: How to Build & Optimize an Ecommerce Sales Funnel
6. Annual Recurring Revenue
Annual recurring revenue (ARR) measures the total predictable income from subscriptions over a year, offering a long-term view of financial stability. It tracks sales KPIs related to growth, forecasting revenue, and aligning strategies with client goals. ARR also provides a benchmark for evaluating performance against competitors. This metric ensures your agency demonstrates how its efforts contribute to long-term client success.
Read More: 35 Competitor Analysis Tools To Improve Your Marketing Campaigns
7. Revenue Generated
Revenue generated focuses on income from specific sales efforts or campaigns. Tracking this metric shows which strategies deliver the highest returns, helping agencies optimize resource allocation.
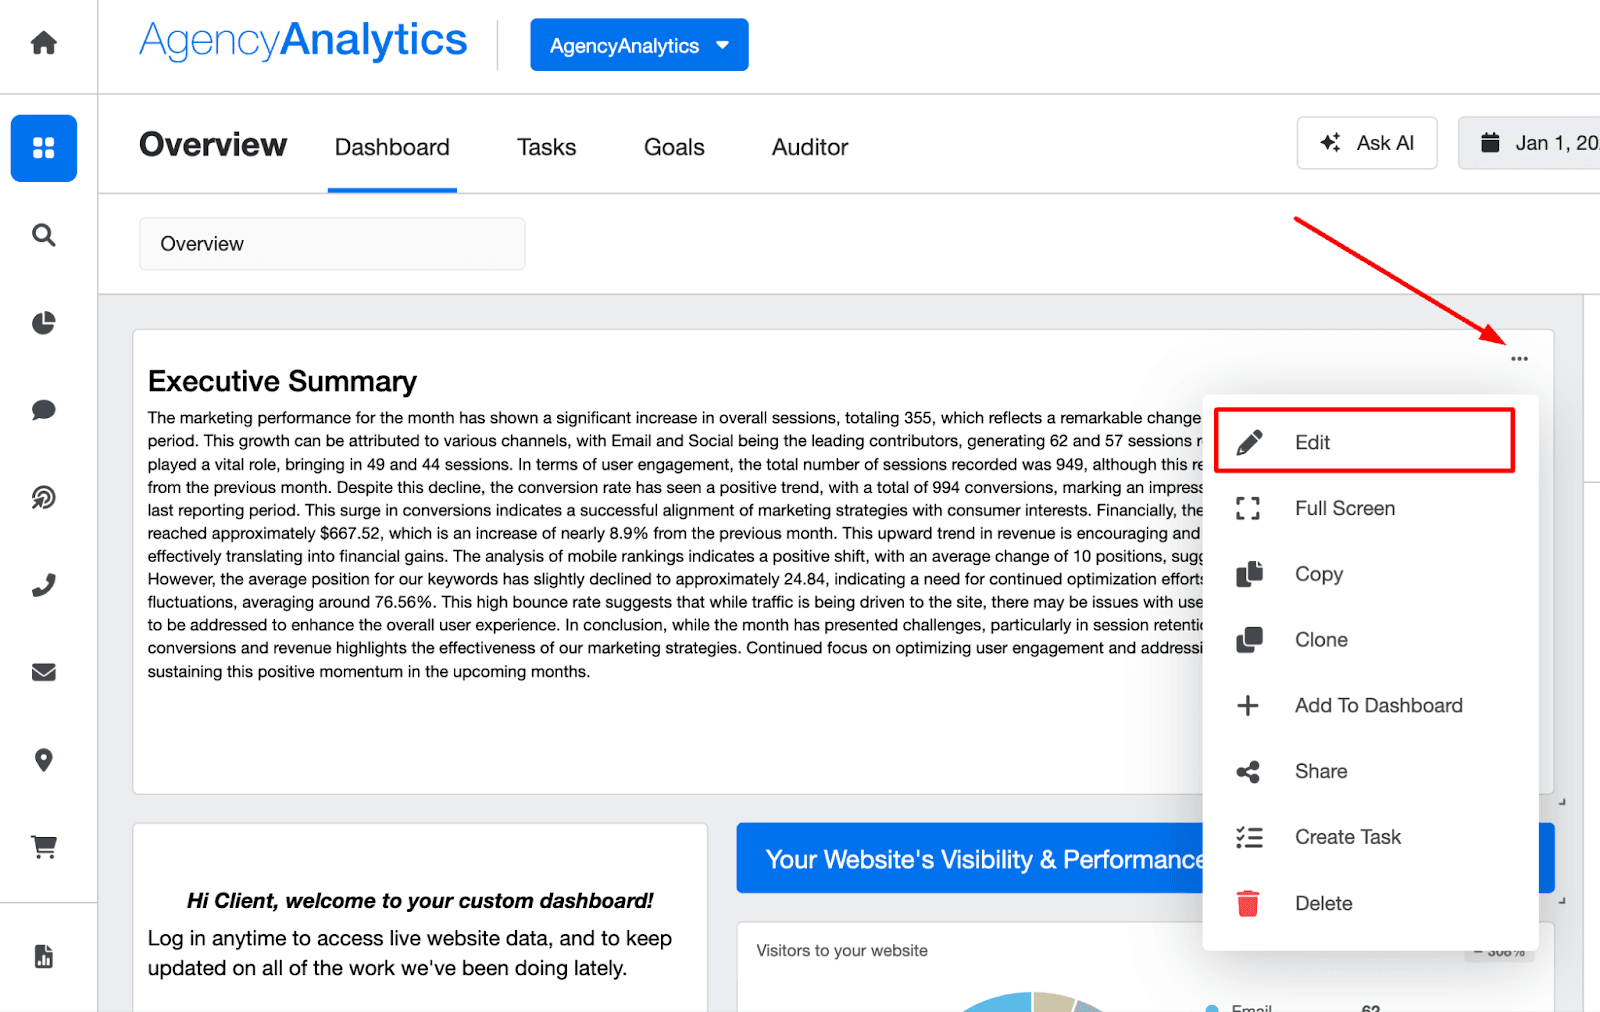
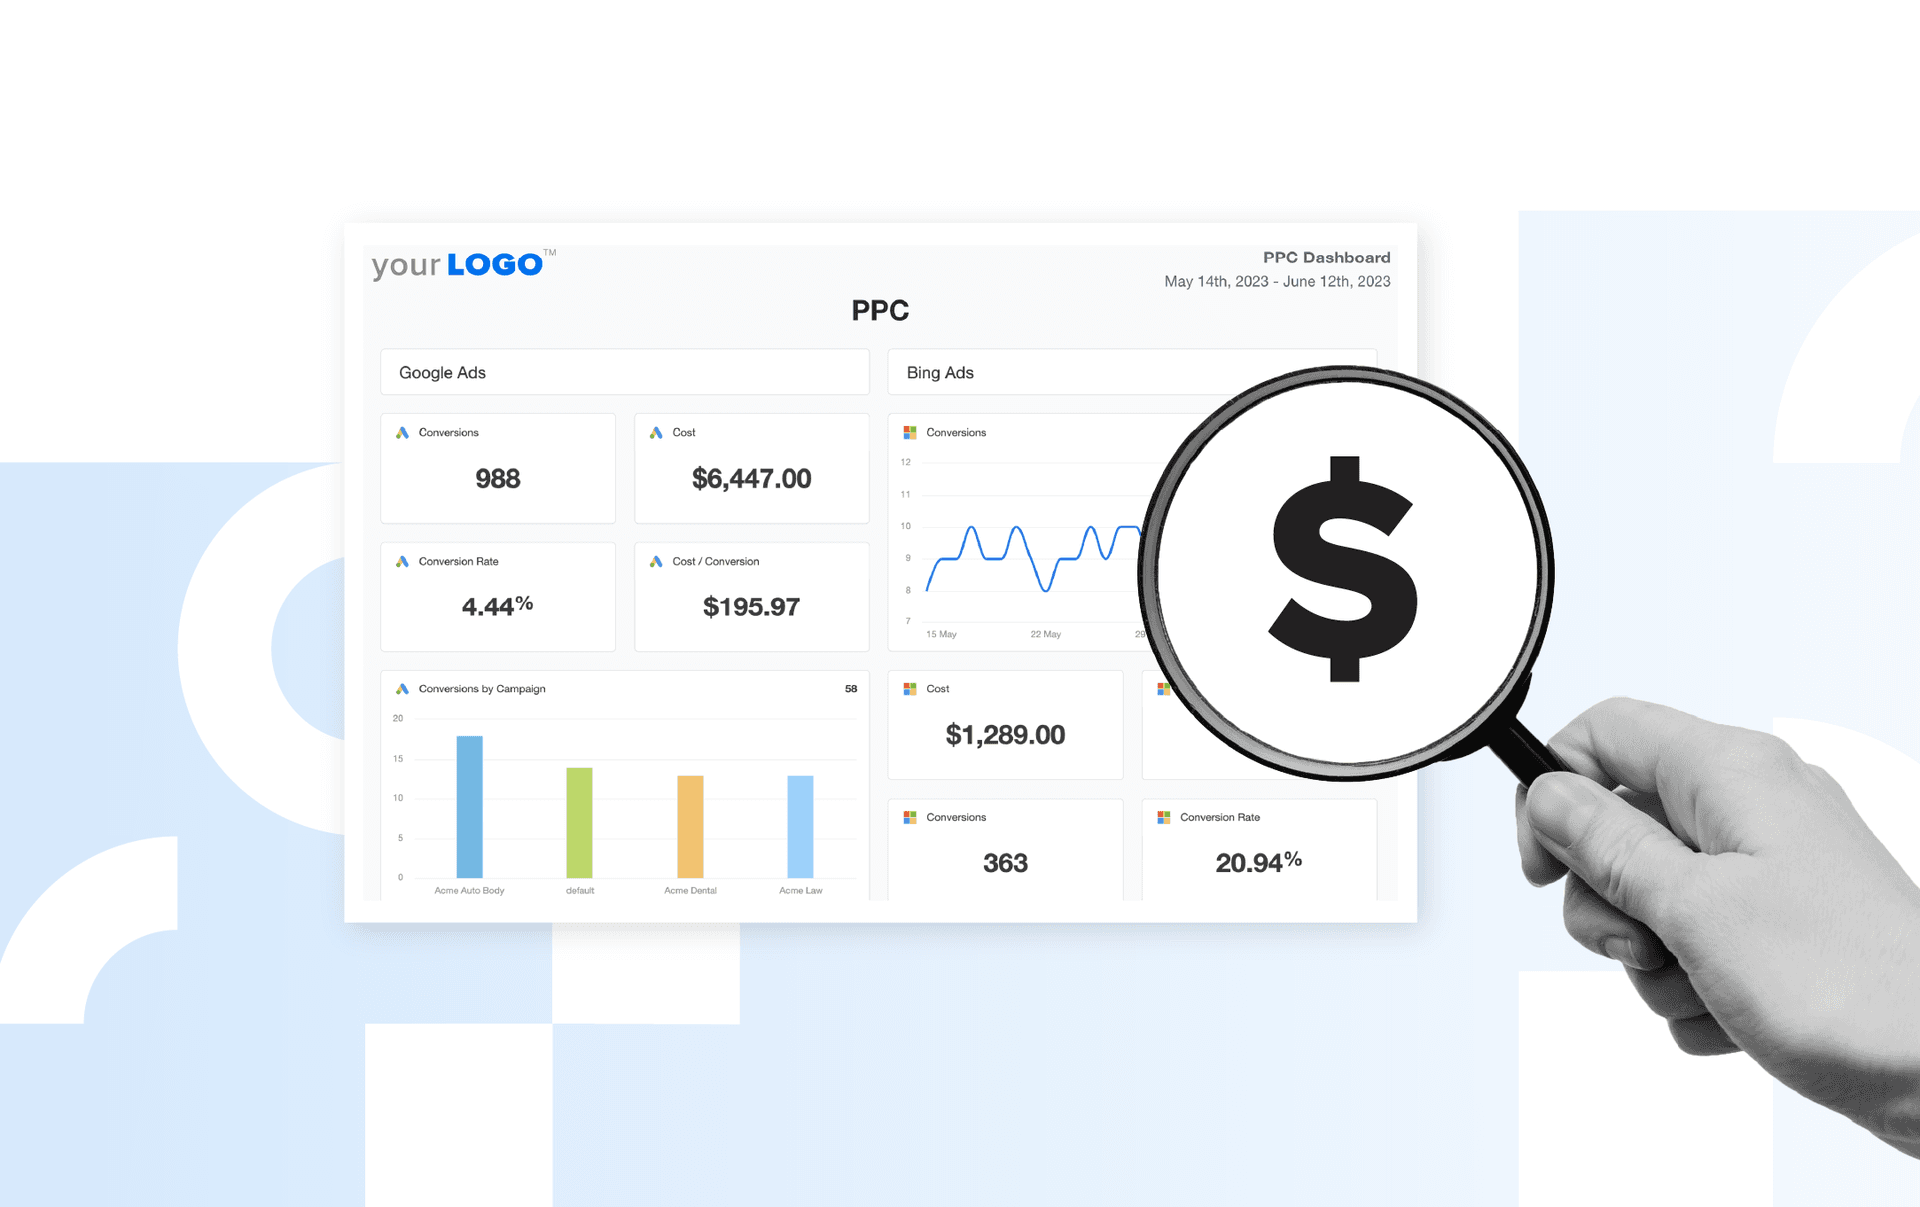
Struggling to communicate complex sales metrics to clients? Try the AI Summaries feature from AgencyAnalytics to simplify reporting and save time. Start your 14-day free trial.
8. Total Revenue
Similar to the revenue generated metric, Total revenue accounts for all income from sales activities. This high-level metric offers an overall picture of business success and ensures your agency’s efforts are moving the needle.
9. Annual Contract Value
Annual contract value (ACV) is key for tracking predictable income and assessing the impact of subscription-based sales models. This metric offers insights into predictable revenue streams, making it an important focus for businesses relying on recurring revenue models.
10. Sales Expense Ratio
The sales expense ratio compares the cost of sales activities to the revenue they generate. This metric highlights the efficiency of sales efforts and helps clients optimize their budgets.
11. Net Promoter Score
Net promoter score (NPS) measures customer loyalty and satisfaction. Clients with high NPS scores are more likely to advocate for your client’s business, making it a valuable metric for long-term success.
Read More: How to Get Customers to Leave Reviews for Clients
12. Customer Satisfaction
Customer satisfaction (CSAT) rates provide direct feedback on client experiences. High satisfaction levels indicate successful strategies, while low scores pinpoint areas needing improvement.
13. New Customers
Tracking the number of new customers acquired during a period is vital for understanding the success of lead generation and conversion efforts.
Read More: The Complete Guide to Impactful Lead Generation Reports
14. Customer Retention
Customer retention KPIs show how well a business maintains its client base. High retention rates indicate strong customer relationships, while low rates may signal the need for better engagement strategies.
15. Sales Calls
The number of sales calls conducted helps measure activity levels and their impact on conversions. Call tracking analytics are useful for optimizing sales team performance and strategies to turn more phone calls into sales.
16. Customer Acquisition Cost (CAC)
Customer acquisition cost (CAC) calculates how much a business spends to acquire a new customer. This metric helps evaluate the combined efficiency of sales and marketing efforts. Comparing CAC to the revenue generated per customer, also helps agencies assess whether acquisition strategies are cost-effective and sustainable. Agencies aim to keep CAC low while maintaining strong lead quality tp ensure clients are investing resources wisely and maximizing profitability.
17. Win Rate
Win rate measures the percentage of deals successfully closed compared to the total number of opportunities in the sales pipeline. This metric helps clients understand the effectiveness of their sales strategies and team performance. A high win rate indicates strong alignment between the sales process and client needs, while a lower rate typically highlights issues in lead qualification or deal negotiation.
18. Churn Rate
Churn rate tracks the percentage of customers who stop doing business with a company over a specific period. This metric is helps for agencies and clients to understand customer retention and satisfaction. A high churn rate signals potential issues with product fit, customer service, or engagement strategies. Monitoring churn allows agencies to recommend proactive solutions to improve retention and build long-term client relationships.
Tracking this list of 18 metrics ensures that your sales metrics reporting reflects meaningful insights that clients actually value and look forward to receiving. These B2B sales metrics help build trust, demonstrate expertise, and deliver actionable data that supports business growth.
Turning Raw B2B Sales Metrics Into Actionable Insights
Providing clients with raw sales data is only half the job. As mentioned, the real value lies in translating that data into actionable insights. Simply tracking the number of deals or other important sales metrics won’t help clients make informed decisions unless you can connect the dots.
Sales and marketing teams rely on your expertise to analyze data, uncover trends, and present clear recommendations that drive a well-made marketing strategy.
You need a structured approach to maximize your sales KPIs and help clients achieve their goals.
Tips for Turning Sales Metrics Into Insights:
Set Clear Goals & KPIs: Start with well-defined goals to measure performance and track sales metrics that matter most to clients. Clear goals provide a benchmark for evaluating success and ensure both you and your clients stay aligned.
Identify Key Metrics: To prioritize impactful data, focus on sales KPIs like the number of deals or existing customers. Identifying the right metrics prevents overwhelming reports and keeps the focus on the most actionable insights.
Analyze Trends: Look for patterns in sales data over time to identify areas for growth or improvement. Trend analysis helps pinpoint consistent issues or successes, making it easier to adjust strategies in real-time.
Benchmark Against Competitors: Compare your client’s performance to industry standards to provide context and highlight opportunities. Marketing benchmarking gives clients a clear perspective on how they stack up and where they can outpace competitors.
Agency Tip: Clients want to know how their performance stacks up against their competition. With AgencyAnalytics’ new Insights features, compare your client’s B2B sales metrics—like conversion rates—against data from other businesses in the same industry.
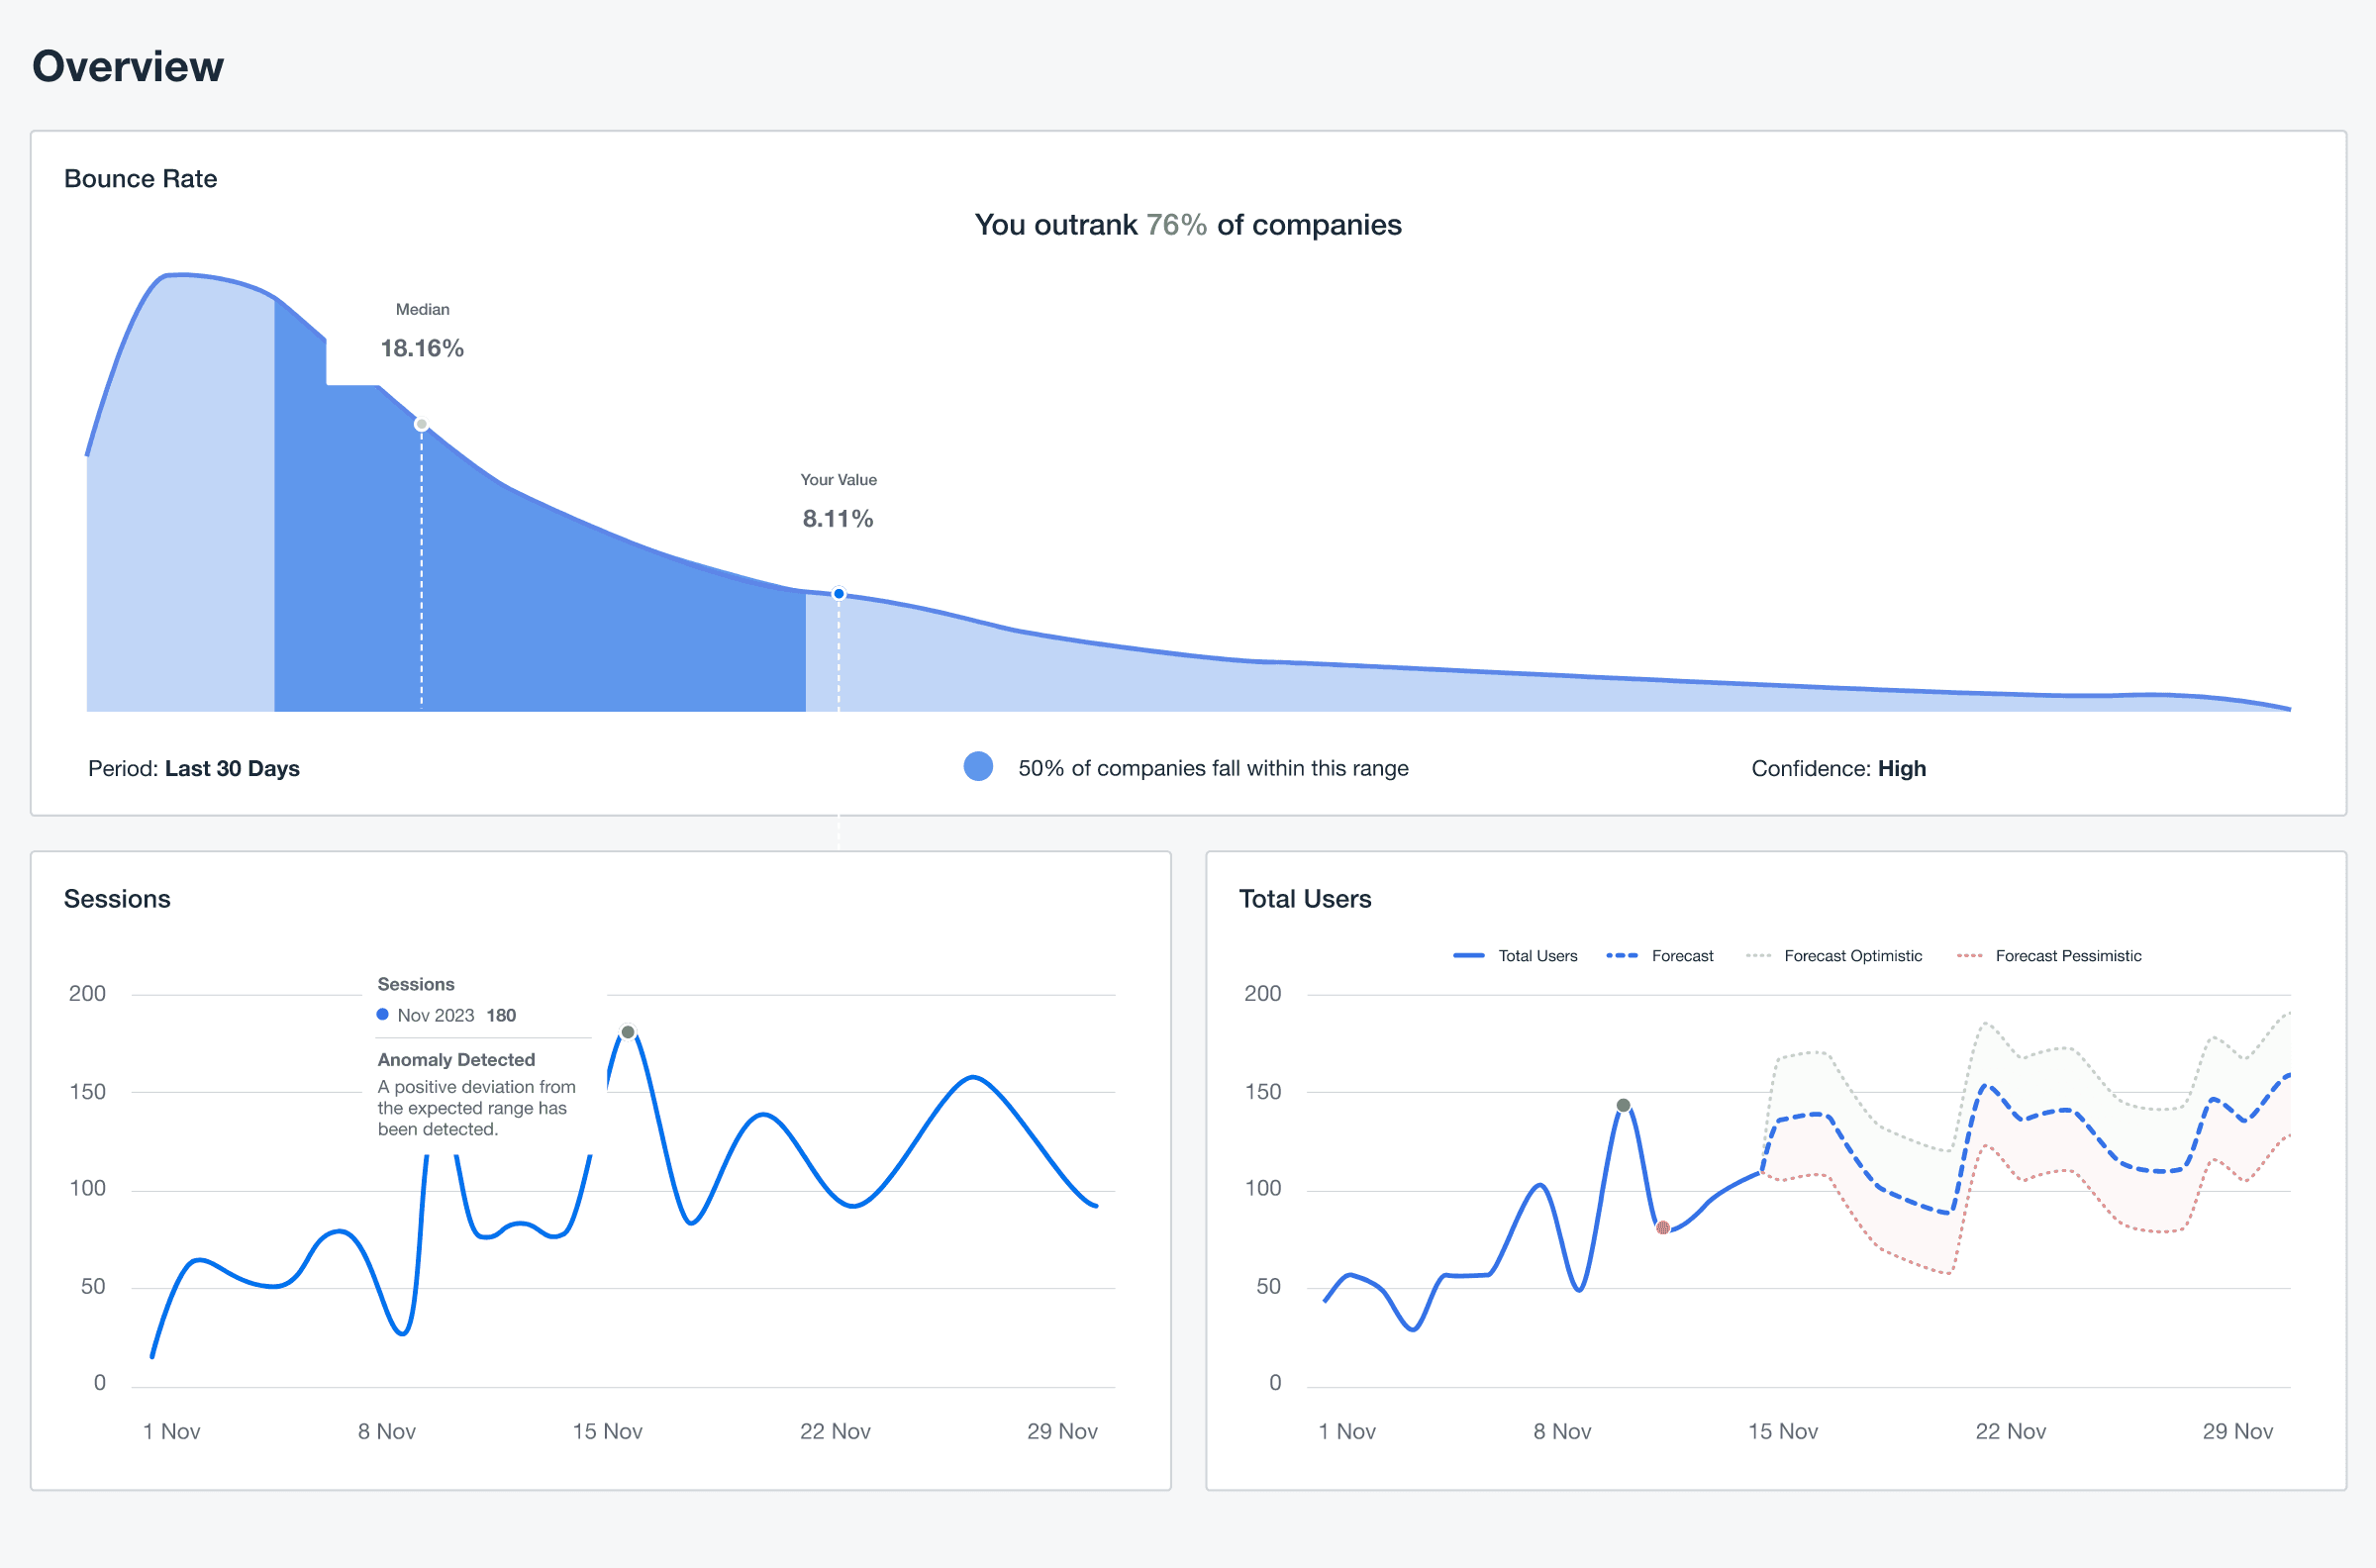
Connect the Dots With Other Platforms: Integrate metrics from 80+ platforms for a complete picture of sales and marketing success. Cross-platform analysis ensures clients understand how efforts in different areas work together to improve results.
Use Insights To Drive Strategy: Turn analysis into actionable recommendations that align with your client’s objectives and long-term plans. Data-driven strategies empower clients to make informed decisions that directly impact their bottom line.
How To Create B2B Sales Metrics Reports Using AgencyAnalytics
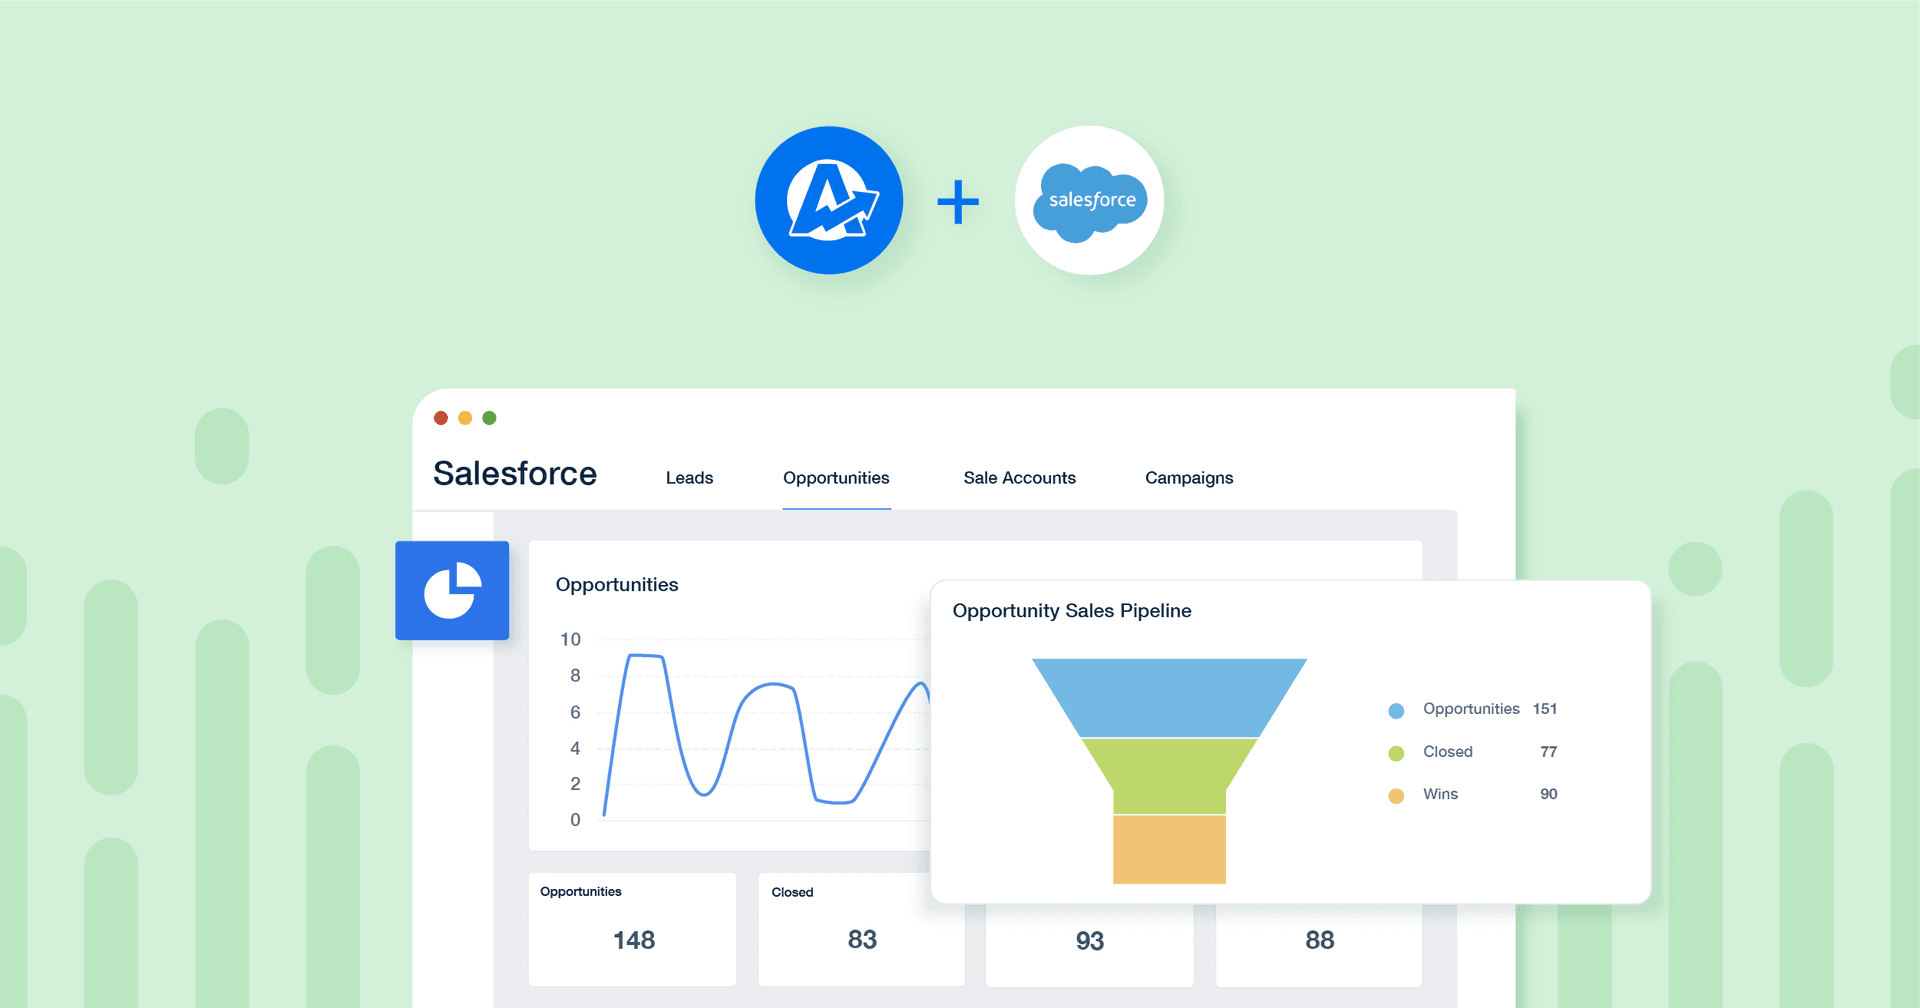
Agencies use AgencyAnalytics to simplify tracking B2B sales metrics, making it easier to monitor campaign results in real-time. With AgencyAnalytics, they gather key data like net sales, total revenue, monthly recurring revenue, customer retention and more into clear dashboards, giving clients an easy way to see how their sales efforts are doing.
Organizing these insights in one place helps agencies identify strategies to improve results across different client accounts. Marketers also link other platforms like Google Ads, LinkedIn, HubSpot, and Shopify to get a complete view of a client’s marketing data.
So, where do you begin?
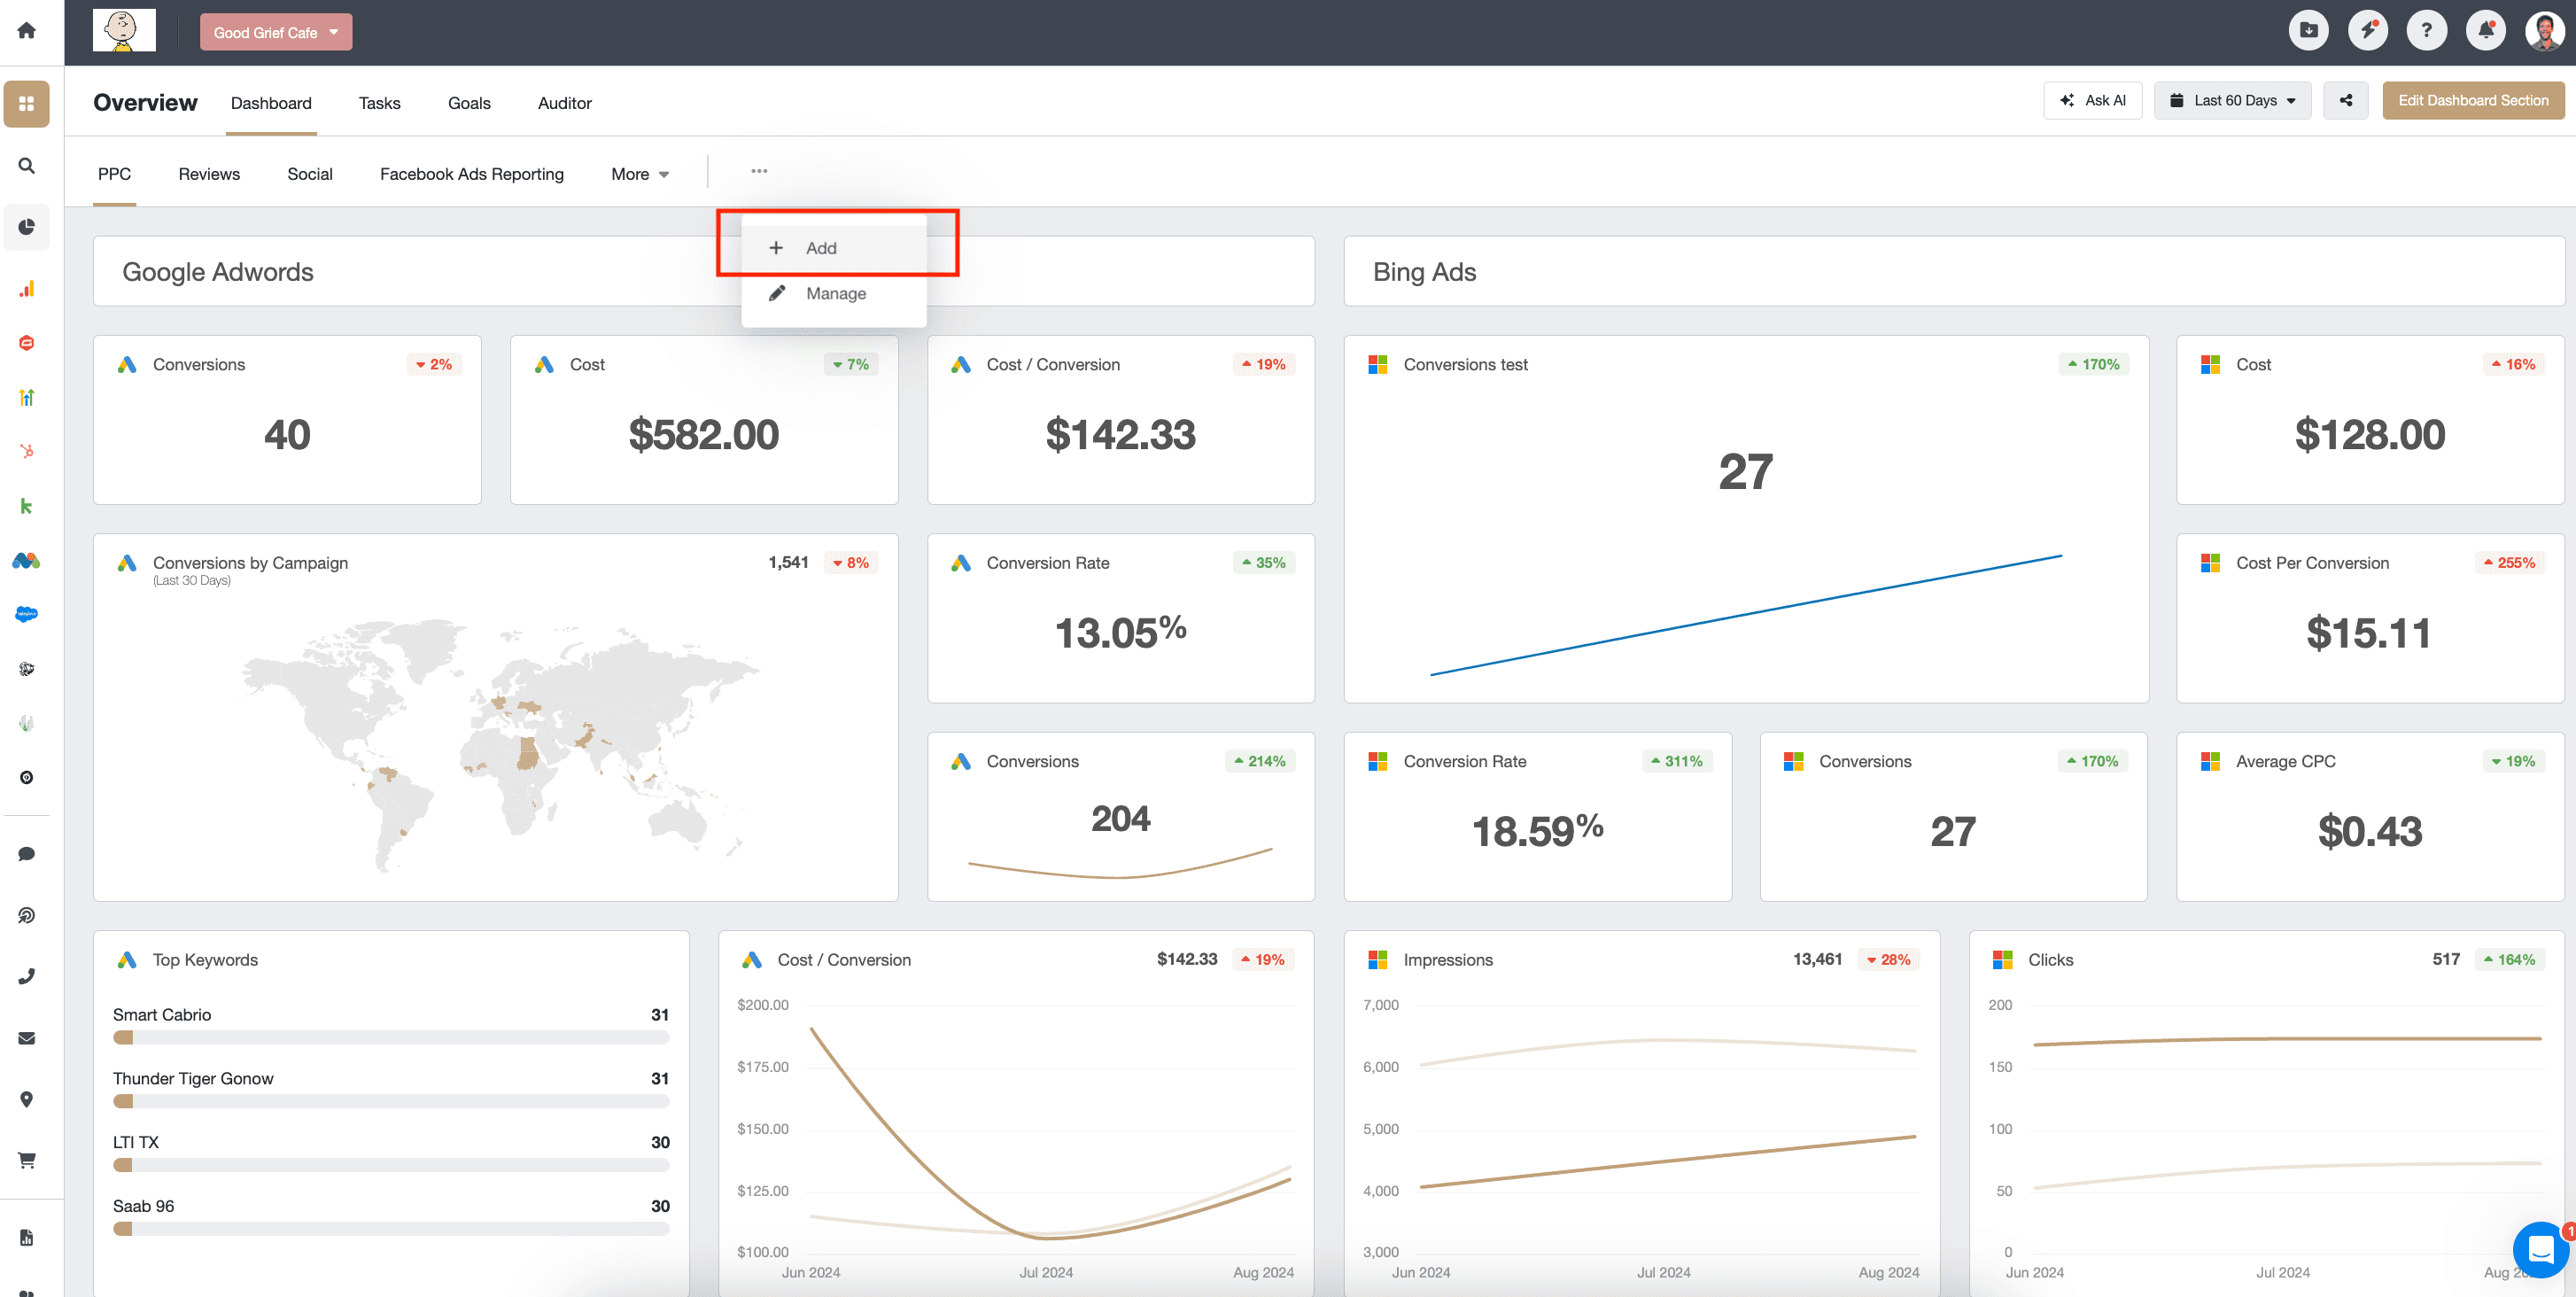
Start by logging into your AgencyAnalytics account and navigating to the client account for which you’d like to build a B2B sales metrics dashboard. Then, select “add” in the drop-down menu to create a new dashboard.
Next, you’ll be prompted to choose how you’d like to create the insights dashboard:
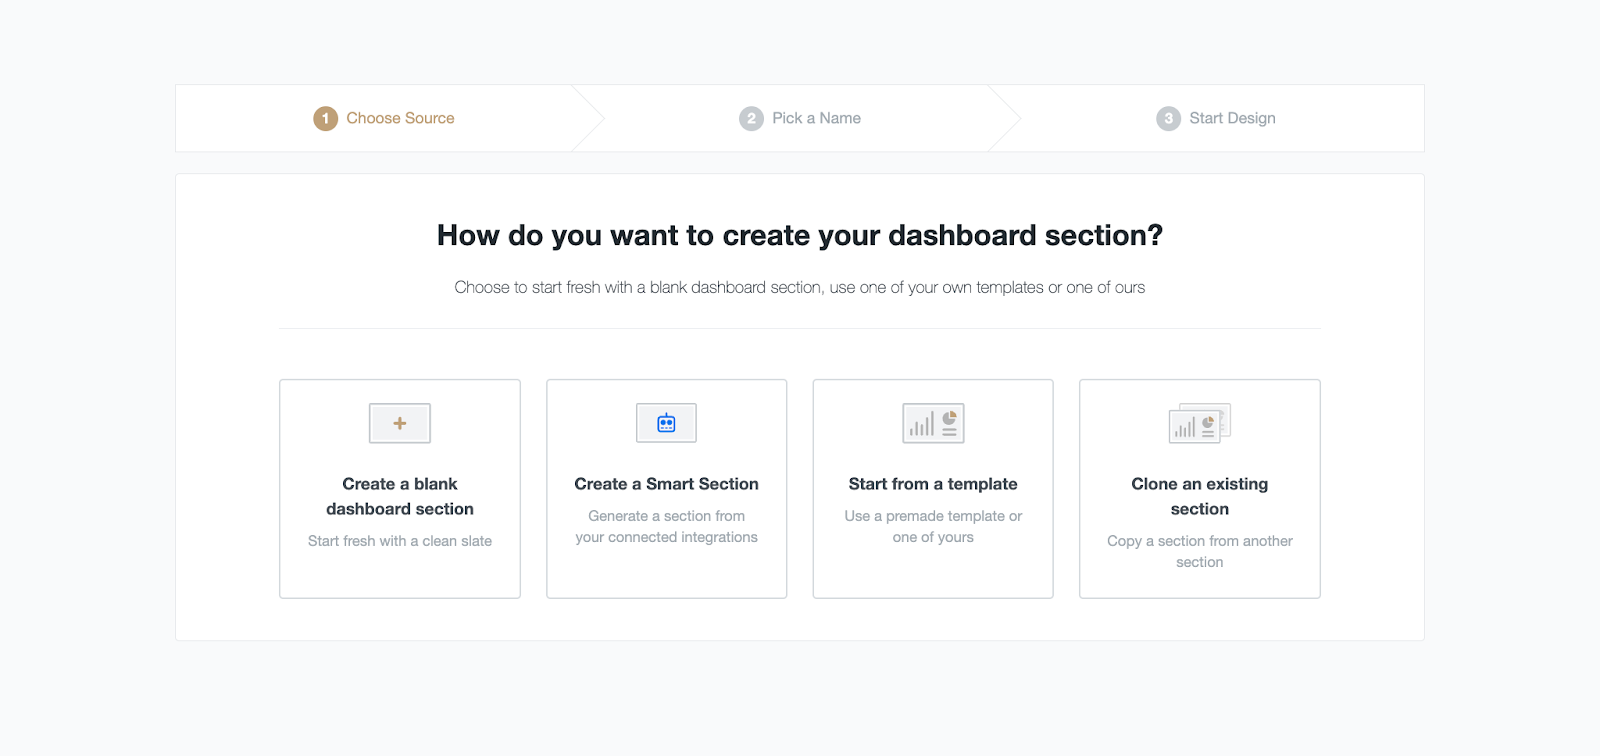
We’ve chosen to create a blank dashboard for this example. This allows you to drag and drop specific widgets you’d like from a variety of marketing platforms.
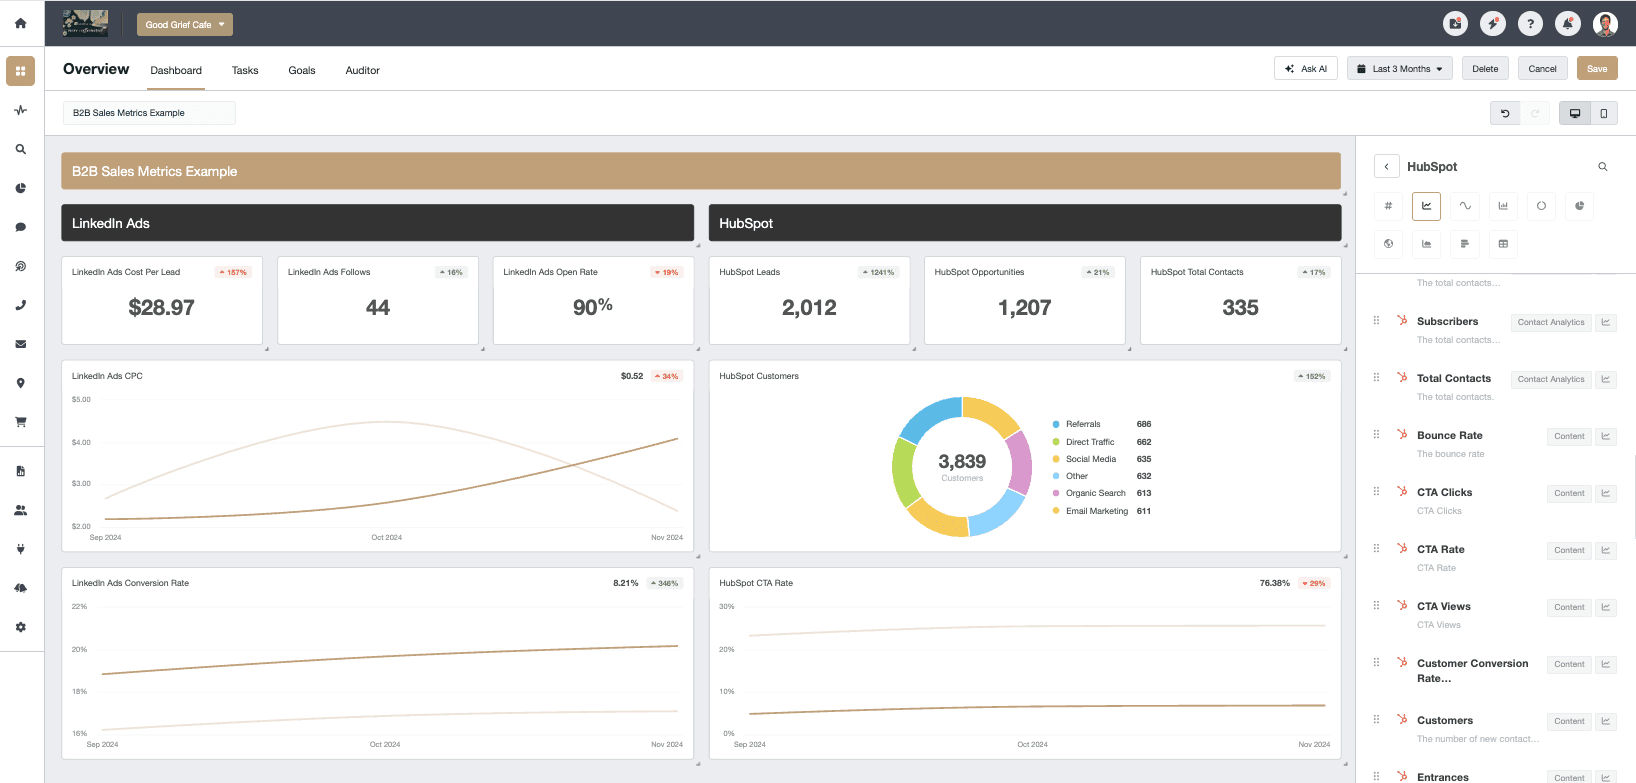
Under a time crunch? The Smart Reports and Smart Dashboards feature from AgencyAnalytics builds exactly what you need in 11 seconds or less. Try it out for yourself with a 14-day free trial.
With access to over 80 marketing channels, AgencyAnalytics gives agencies a complete picture of a client's marketing activity in one place. The platform’s user-friendly interface makes it easy to visualize data, identify trends, and make informed decisions, all while keeping clients in the loop with real-time insights.
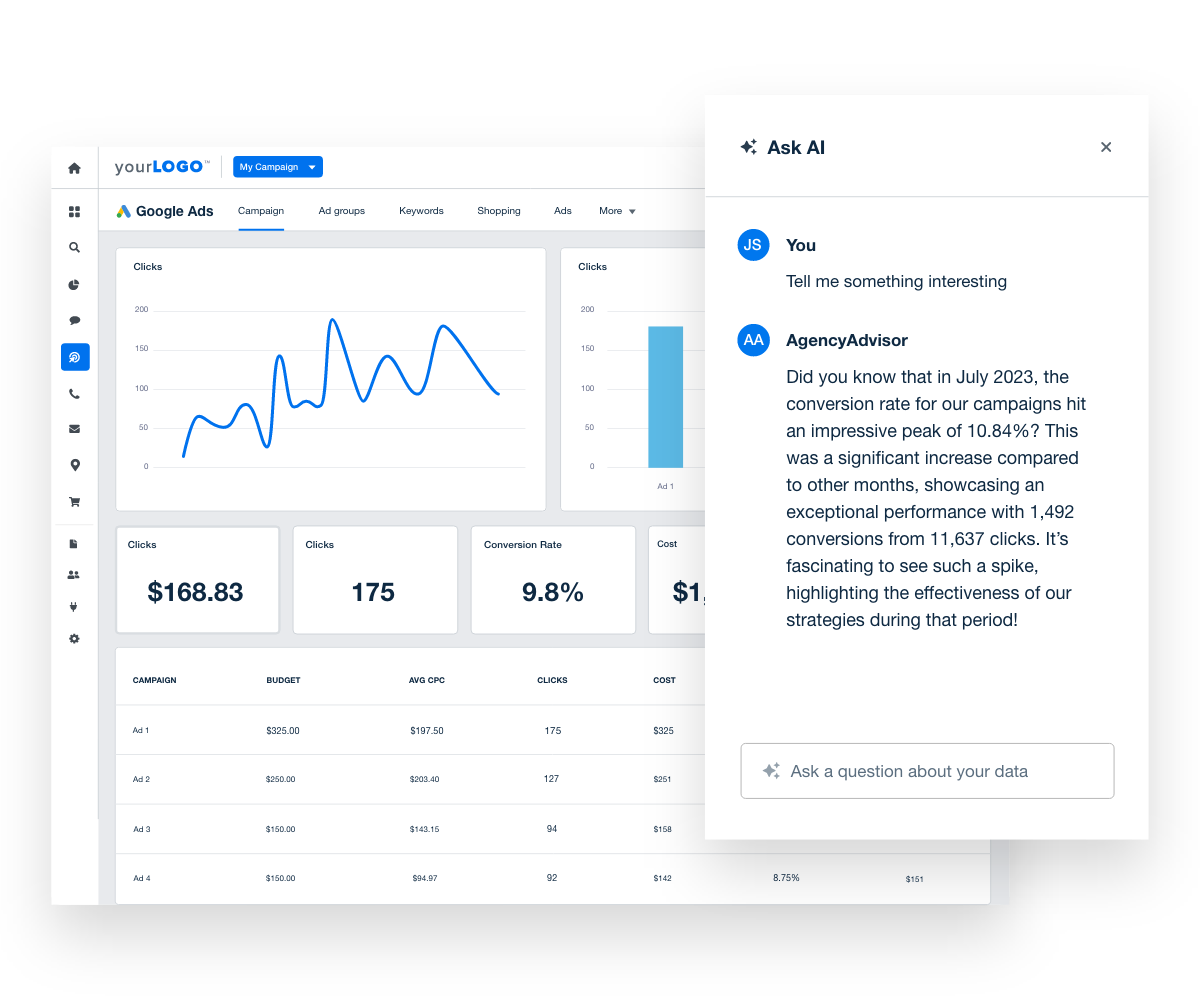
Highlight the most important aspects of your client’s SEO performance in an easy-to-read report using Ask AI. This feature summarizes important findings and showcases your agency’s value front and center. Try it out with your 14-day free trial of AgencyAnalytics.
Tips for Creating Reports That Wow Clients
Marketing reports are a powerful tool for agencies to communicate clearly with clients. A well-crafted report helps clients understand the story behind the data, showing what’s working and how your efforts are driving their business goals forward. It’s an important tool that ensures your clients stay informed and confident in your partnership.
Read More: Must-Have Data Visualization Tools to Transform & Inform Your Insights
After tracking all of those sales metrics, you want to make sure you’re communicating the results properly. Here are five tips to help you build B2B sales metrics reports that leave a lasting impression.
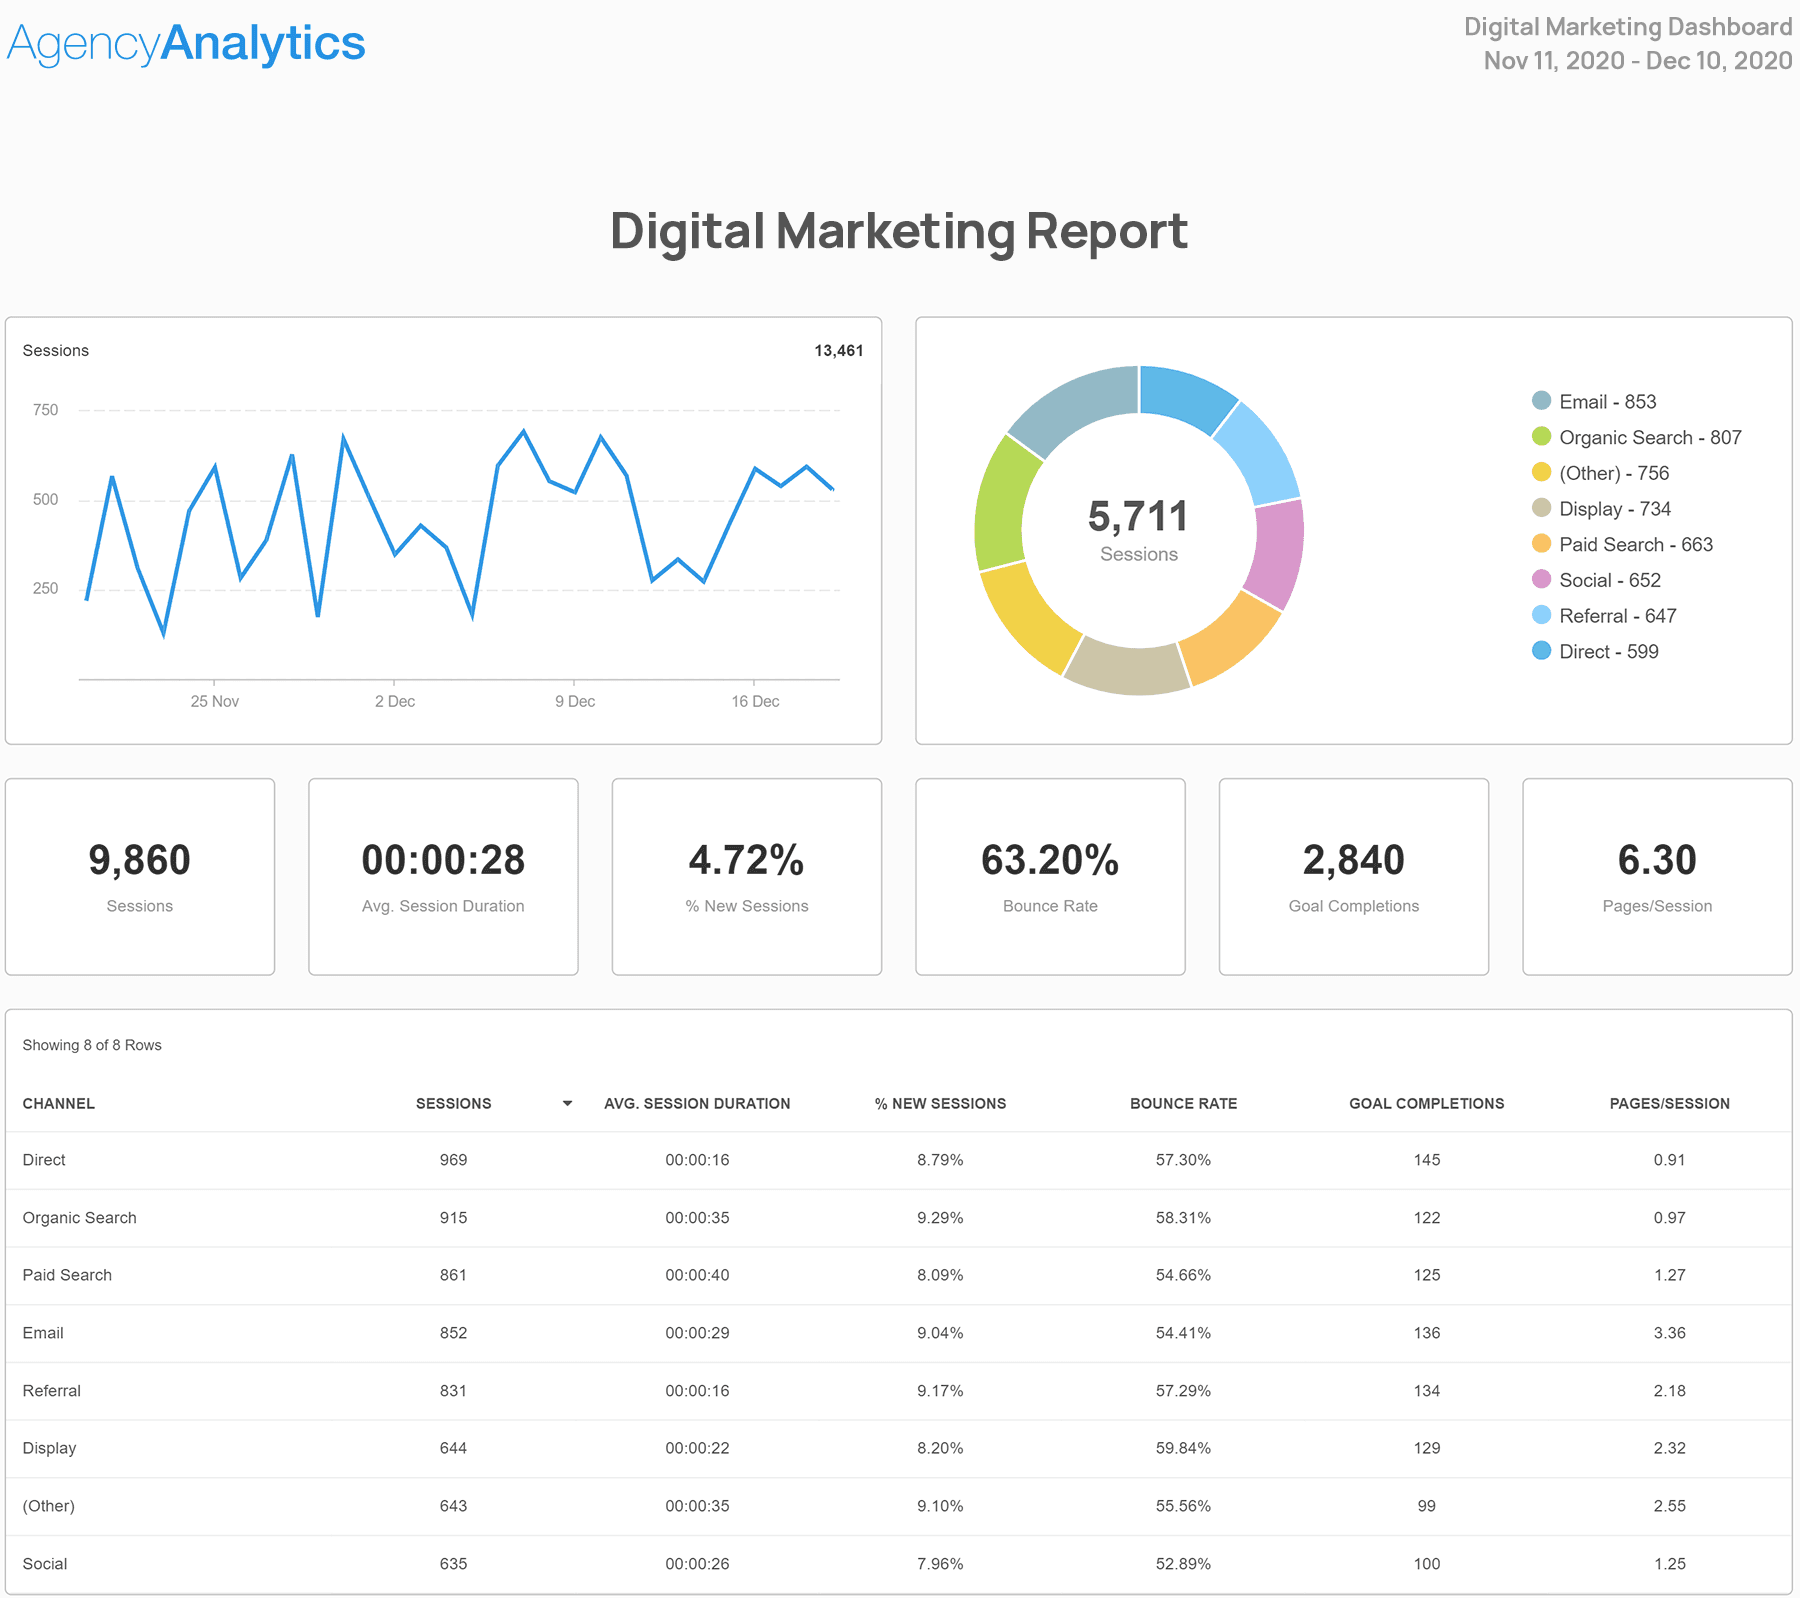
Combine B2B Sales Metrics With Other Campaign Metrics: Integrate B2B sales metrics with other data sources like Google Analytics, Google Ads, Facebook, and SEO rankings. This provides a complete picture of performance across all campaigns and helps clients see how each channel contributes to their success.
Track the Right B2B Sales Metrics: Focus on metrics that align with your clients’ goals, such as sales pipeline growth, revenue generated, and customer retention rates. Avoid overwhelming them with irrelevant data by prioritizing insights that affect their bottom line.
Focus on the Results That Matter: Highlight outcomes, not just activities. Instead of reporting on the number of sales calls, connect those efforts to measurable results like deals closed or revenue earned.
Use Automated Reporting Tools: Save time and ensure accuracy by using automated reporting platforms. Tools like AgencyAnalytics simplify the process and keep your clients informed with up-to-date insights.
Wrap Results in Your Agency’s Brand: Add your agency’s logo, colors, and formatting to your reports. Branded reports look professional, reinforce your expertise, and build trust with clients.
Follow these tips to create reports that combine clarity, value, and professionalism. Your clients will understand their progress and appreciate your role in helping them achieve their business goals.
Summary and Key Takeaways
And there you have it. Tracking sales metrics doesn’t have to be complicated. Especially now that you have this handy list whenever you need it.
Here are a few key takeaways to help you get the most out of your B2B sales metrics:
Evaluate Your Current Approach: Take a close look at how your agency tracks and reports sales performance metrics to find areas to improve.
Explore Third-Party Tools: Check out platforms like AgencyAnalytics to make tracking and reporting your sales pipeline easier.
Customize Your Reports: Adjust your reports to highlight the most important sales metrics for each client, adding your agency’s branding for a professional touch.
Set Up Automated Reports: Schedule reports to automatically send regular updates to keep clients on track toward their sales targets.
By following these steps, your agency will provide insights that sales reps, sales managers, and clients can use to improve their results. This approach builds trust and proves your agency is a partner for the long haul.

Written by
Richelle Peace is a writer with a degree in Journalism who focuses on web content, blog posts, and social media. She enjoys learning about different topics and sharing that knowledge with others. When she isn’t writing, Richelle spends time teaching yoga, where she combines mindfulness, movement, and her passion for wellness.
Read more posts by Richelle PeaceSee how 7,000+ marketing agencies help clients win
Free 14-day trial. No credit card required.


