Table of Contents
QUICK SUMMARY:
PPC metrics are data points that measure the effectiveness of paid campaigns. While PPC platforms offer dozens of metrics, not all of them are useful for guiding decisions. This article shares the 17 top PPC metrics to monitor, along with advice from expert agency leaders on how to deliver impactful insights. It also highlights the importance of using a client reporting tool to simplify data retrieval, save time, and deliver data-driven results.
Running PPC campaigns means managing tons of numbers. Clicks, impressions, conversions, ROAS, CPC... the list goes on. But as any agency knows, more data doesn’t always equal better reporting.
PPC platforms all have their nuances, each measuring things differently and labeling similar actions in their own way. With all that inconsistency, it’s easy to get buried in metrics that don’t tell the full story, or worse… leave clients unsure about their results.
That’s why it’s critical to focus on the right metrics–ones that reflect performance, align with business goals, and guide the next steps. At the end of the day, PPC success is about results clients understand and can act on.
In this article, we’ll break down the 17 PPC metrics that matter most, along with advice from agency pros who’ve been in the trenches. We’ll also explore the importance of a tool like AgencyAnalytics to streamline reporting and deliver data-driven PPC insights.
What Are PPC Metrics?
PPC metrics are data points that measure the performance of paid advertising campaigns. They’re a core part of paid search analytics, helping marketers understand how effectively ads drive traffic, engagement, and conversions, while tracking budget efficiency.
More specifically, they’re used to:
Optimize Budget Allocation: Monitor average CPC, ROAS, and CPL to focus spend on the highest-performing channels.
Improve Campaign Relevance: Use metrics like bounce rate to refine targeting, ad content, and landing page alignment.
Demonstrate Client Value: Monitor conversions, revenue, and lead quality to show how paid media contributes directly to business growth.
Tracking the right PPC metrics makes it easier to optimize campaigns, explain results, and drive better outcomes for clients. Then automate client PPC reports so those metrics roll up cleanly every cycle.
Not All Metrics Are Important
PPC advertising platforms serve up a wealth of data—dozens, sometimes hundreds of metrics. That said, they’re not equally useful when considering unique client goals and targets.
Take Post Engagement on Facebook Ads, for example. A campaign might generate tons of likes, but if those interactions don’t align with a client’s end goal (like driving purchases), they’re simply vanity metrics.
Vanity metrics are those stats that you like to show off to make the efforts you're making look good for you, but in the end, really don't mean anything, especially towards the end business goals you really want to achieve.
Nathan Hawkes, President, Arcane Marketing
Here’s another thing: Metrics carry different meanings across different platforms. For instance, a “conversion” might mean a completed sale on Google Ads. On the flip side, it could refer to a form submission via a LinkedIn ad (depending on how tracking is set up). Without clear context, these numbers could easily be misleading or misinterpreted.
To avoid confusion and keep reporting focused, here are some actionable tips to follow.
Guideline | Explanation |
|---|---|
Align With Campaign Objectives | Start by identifying the campaign goal (e.g., brand awareness, lead generation, ecommerce sales). Only focus on metrics that directly reflect progress toward that goal. |
Match the Funnel Stage | Track metrics that fit the campaign’s goal. For awareness campaigns, focus on reach and engagement. For conversion-focused campaigns, use metrics like CPA, ROAS, and total conversions. |
Prioritize Actionable Metrics | Choose performance metrics that lead to clear next steps, like CTR, bounce rate, and CPL. These reveal how users interact with your client’s ads and where to improve, unlike passive stats that offer little room for optimization (e.g., brand recall). |
Ensure Platform Consistency | Metrics like “conversion” or “engagement” mean different things across platforms. Make sure definitions are understood upfront to avoid inaccurate comparisons or reporting gaps. |
Limit to What Matters | Avoid overloading reports with every available data point. Include only those that support decision-making or tie back to client KPIs. That way, reporting remains actionable and relevant. |
Focusing on a few well-defined metrics makes it easier to evaluate performance, make decisions, and show clients exactly what’s working.
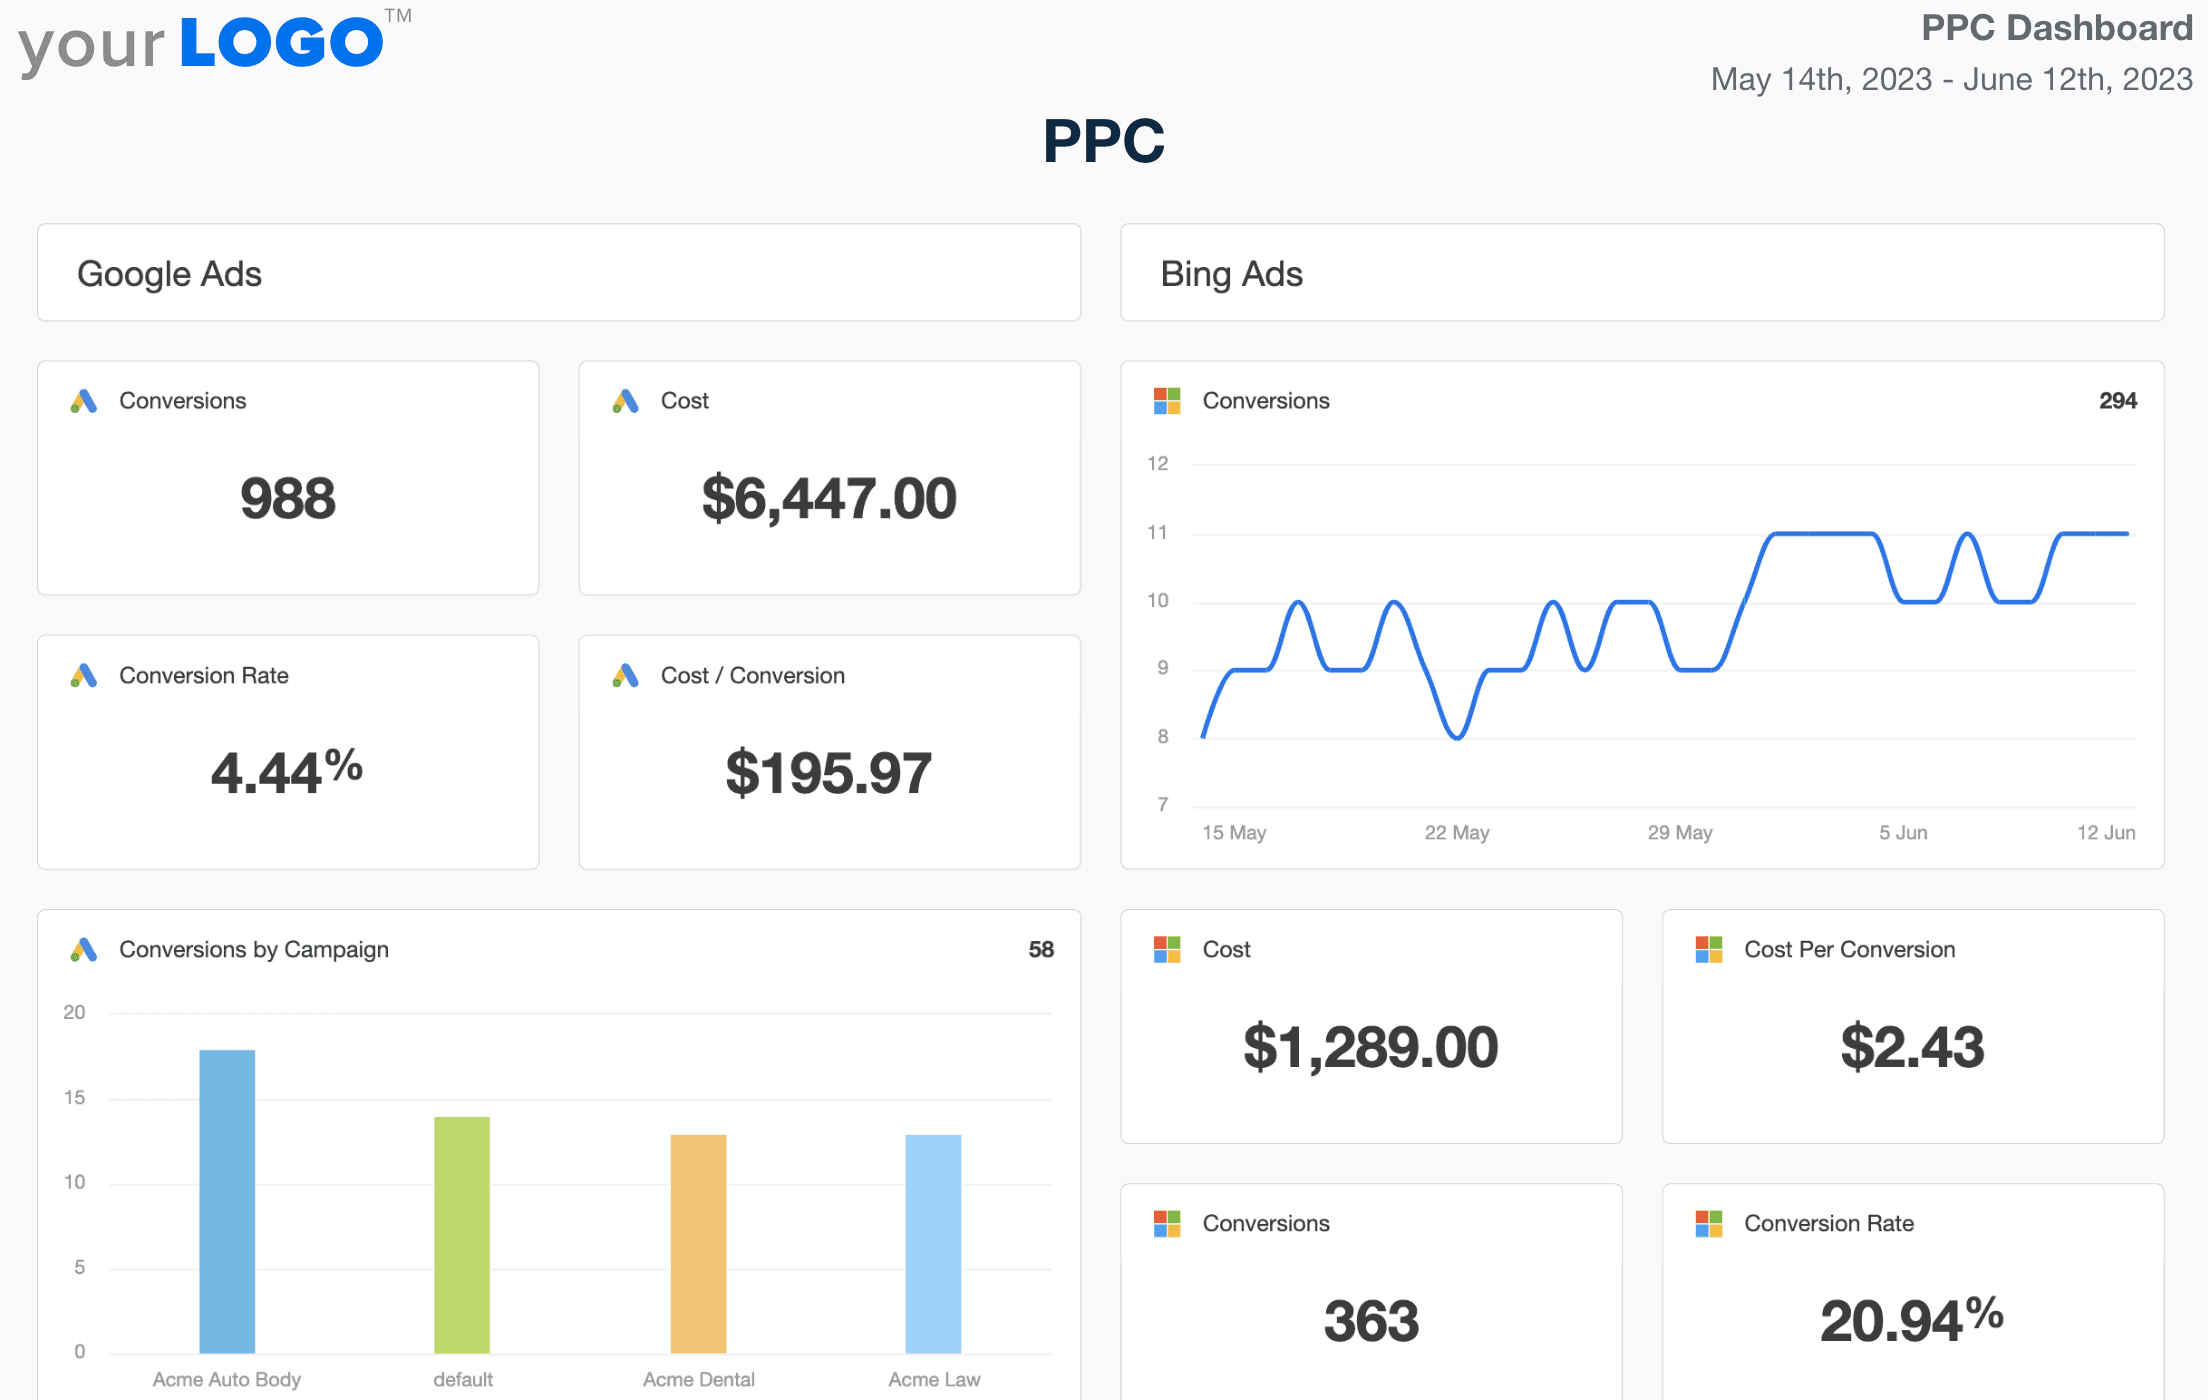
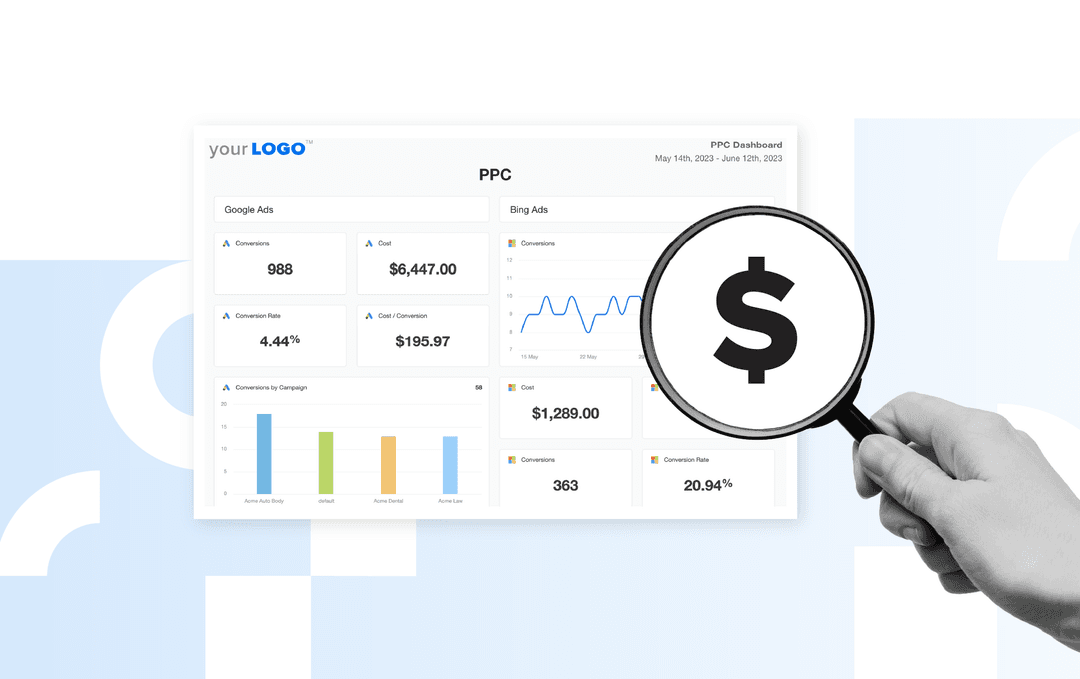
Easily report on performance across multiple PPC ads. Use a visual dashboard to track PPC metrics like click through rate, conversion value, cost per click (CPC), and more–try AgencyAnalytics, free for 14 days.
17 Most Important PPC Metrics You Should Be Tracking
With all that said, which metrics should your agency actually focus on? Here’s a list of some of the most important online advertising metrics to track, according to the stages of the marketing funnel.
Top-of-Funnel PPC Metrics
Top-of-funnel PPC metrics measure early-stage engagement and audience reach. They cover everything from the moment someone sees their very first ad to when they click through to the landing page. While these metrics don’t always translate to revenue, they shape the quality and volume of traffic moving through the funnel.
Impressions
Impressions count the number of times an ad appeared on a user’s screen, whether or not it was clicked. Also, a single user may generate multiple impressions if they see the ad more than once.
Why It Matters:
Brand Visibility: High impressions indicate strong ad delivery, indicating how often your client’s brand is being seen.
Budget Monitoring: A sudden drop may point to inadequate budget, low ad relevance, or platform approval issues. To get more impressions, improve quality scores, and consider higher bids.
Impression Share
Impression share is the percentage of total available impressions an ad receives compared to the number it could have received. For example, if a Google search ads campaign has an impression share of 40%, that means it only showed up in 4 out of every 10 eligible auctions. The remaining 60% went to competitors or weren’t served due to campaign limitations.
Understanding how many ad auctions your client is eligible for—and how often they win—helps pinpoint missed opportunities.
Why It Matters:
Competitive Visibility: A low impression share often means competitors are winning more auctions and capturing better ad positions. This is typically from bidding higher, having better ad quality, or both.
Growth Opportunity: Increasing impression share (especially for high-intent keywords) may directly improve lead volume, sales, and ad rank.
Clicks
Clicks refer to the number of times users interact with an ad by clicking on it, typically directing them to a landing page or website. While it doesn’t guarantee conversions, it shows that the ad captured attention and motivated action.
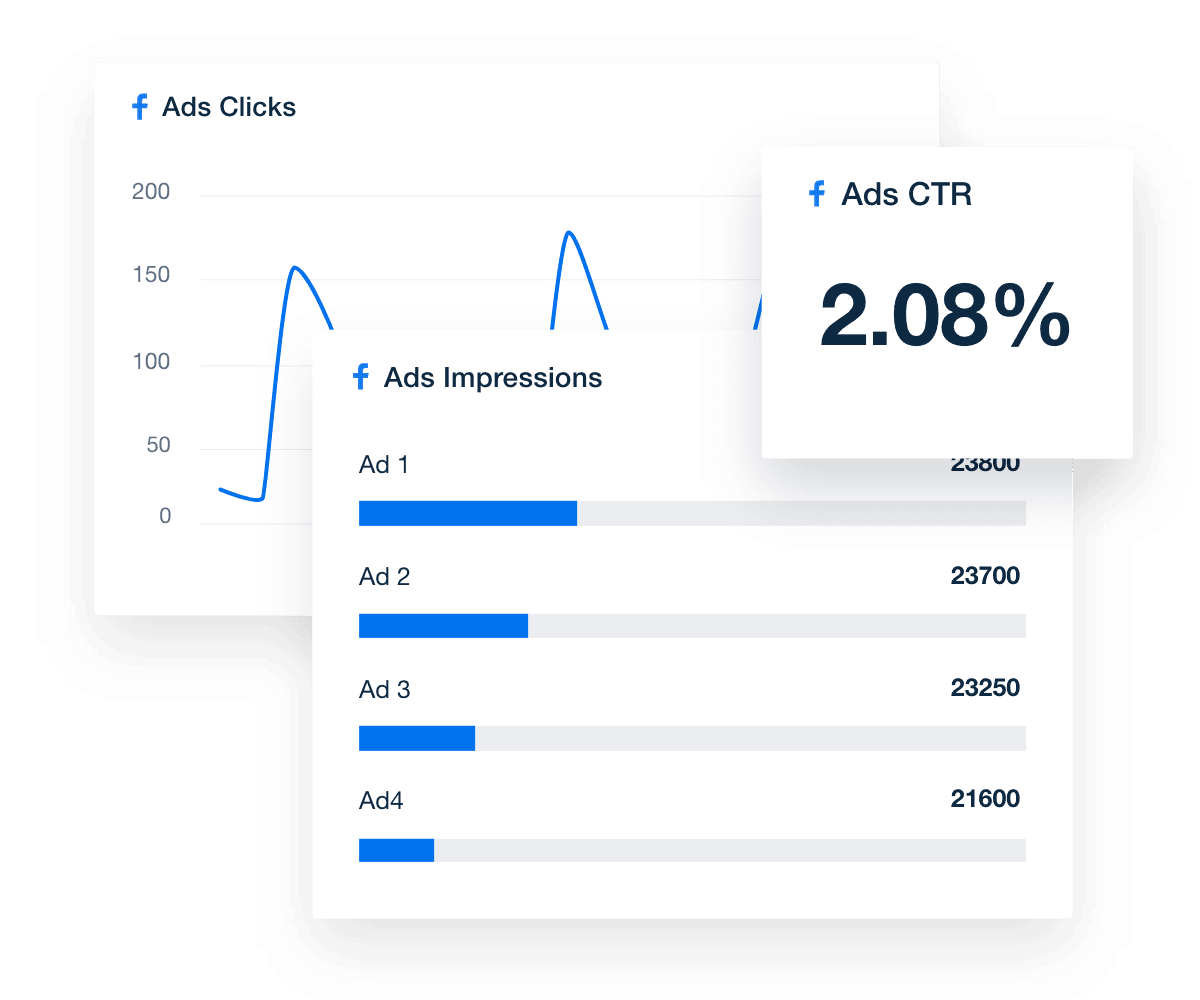
Monitor ad visibility, access target audience insights, and track top-performing search queries. Take PPC reporting to the next level–explore AgencyAnalytics, free for 14 days.
Why It Matters:
Initial Engagement: Monitor what receives the most clicks to enhance ad relevance. Use this data to tweak ad copy, improve quality score, and refine your client’s bidding strategy.
Cost Control: Since most PPC models charge per click, monitoring volume helps manage marketing budgets more effectively.
Cost Per Lead (CPL)
CPL measures the cost of generating one lead through a PPC campaign. Depending on the client's definition, a lead might be a form submission, demo request, or newsletter sign-up.
Why It Matters:
Budget Efficiency: CPL shows how efficiently the campaign is generating potential customers. A high CPL may indicate poor targeting, weak ad creatives, or a broken conversion path.
Goal Alignment: CPL is especially important for lead-gen clients (e.g., B2B, service-based businesses) where conversions don’t happen on-site but through follow-up sales processes.
Number of New Leads
This metric reflects how many prospects took an action that signals interest (e.g., submitting a contact form, booking a demo, or downloading content). These users have shown intent and provided enough information to enter the sales pipeline.
Why It Matters:
Top-Line Performance Indicator: This metric shows the raw output of a lead generation campaign. It also shows whether paid traffic is converting into potential customers.
Campaign Validation: A steady or growing number of leads suggests that ad targeting, messaging, and offer alignment are working.
Number of Calls
This metric tracks how many phone calls are driven by a PPC campaign. This primarily happens via call extensions, call-only ads, or click-to-call buttons.
It’s particularly valuable for local and service-based businesses, since phone calls often play a key role in lead conversion.
Why It Matters:
High-Intent Lead Signal: Calls represent more serious buyer intent than form submissions, especially for urgent or high-value services.
Channel Optimization: If a campaign is generating more calls than clicks, it may make sense to prioritize call-only ad placements or adjust bidding for mobile traffic.
Reach
Reach measures the total number of unique users who saw an ad at least once during a campaign.
Unlike impressions (which include multiple views from one user), reach shows how many individual users were exposed to the ad. Therefore, it’s a better indicator of audience size.
Why It Matters:
Audience Exposure: Reach reflects a campaign’s visibility, which is especially important for brand awareness, product launches, or other top-of-funnel efforts.
Channel Efficiency: Compare reach across platforms to determine where budget is generating the broadest exposure.
Bounce Rate
Bounce rate measures the percentage of users who click on your client’s ad, land on the destination page, and leave without taking any further action.
Why It Matters:
Landing Page Relevance: A high bounce rate may signal a disconnect between the ad and the landing page experience. In these scenarios, the offer or page layout may need improvement.
Optimization Insight: Bounce rate helps diagnose performance issues beyond the ad itself. It may indicate slow load times, poor mobile UX, or unclear CTAs.
Mid-Funnel PPC Metrics
Mid-funnel metrics show how engaged users are after initially clicking on your client’s ad. At this point, they’re considering the offer, evaluating the brand, or moving closer to a conversion. Use these metrics to assess lead nurturing and remarketing efforts. They’re also handy for pinpointing any friction points in the customer journey.
Click-Through Rate (CTR) on Remarketing Campaigns
This metric measures the percentage of people who click on a retargeting ad after seeing it.
Because this audience is already familiar with your client’s brand, a strong CTR indicates the ad is effectively re-engaging past visitors.
Why It Matters:
Audience Interest: Since remarketing audiences are already familiar with your client’s brand, this metric tends to demonstrate warm leads.
Budget Efficiency: Remarketing clicks are typically cheaper and more conversion-ready than cold traffic. A low CTR may mean it’s time to refresh creatives or tighten the audience list.
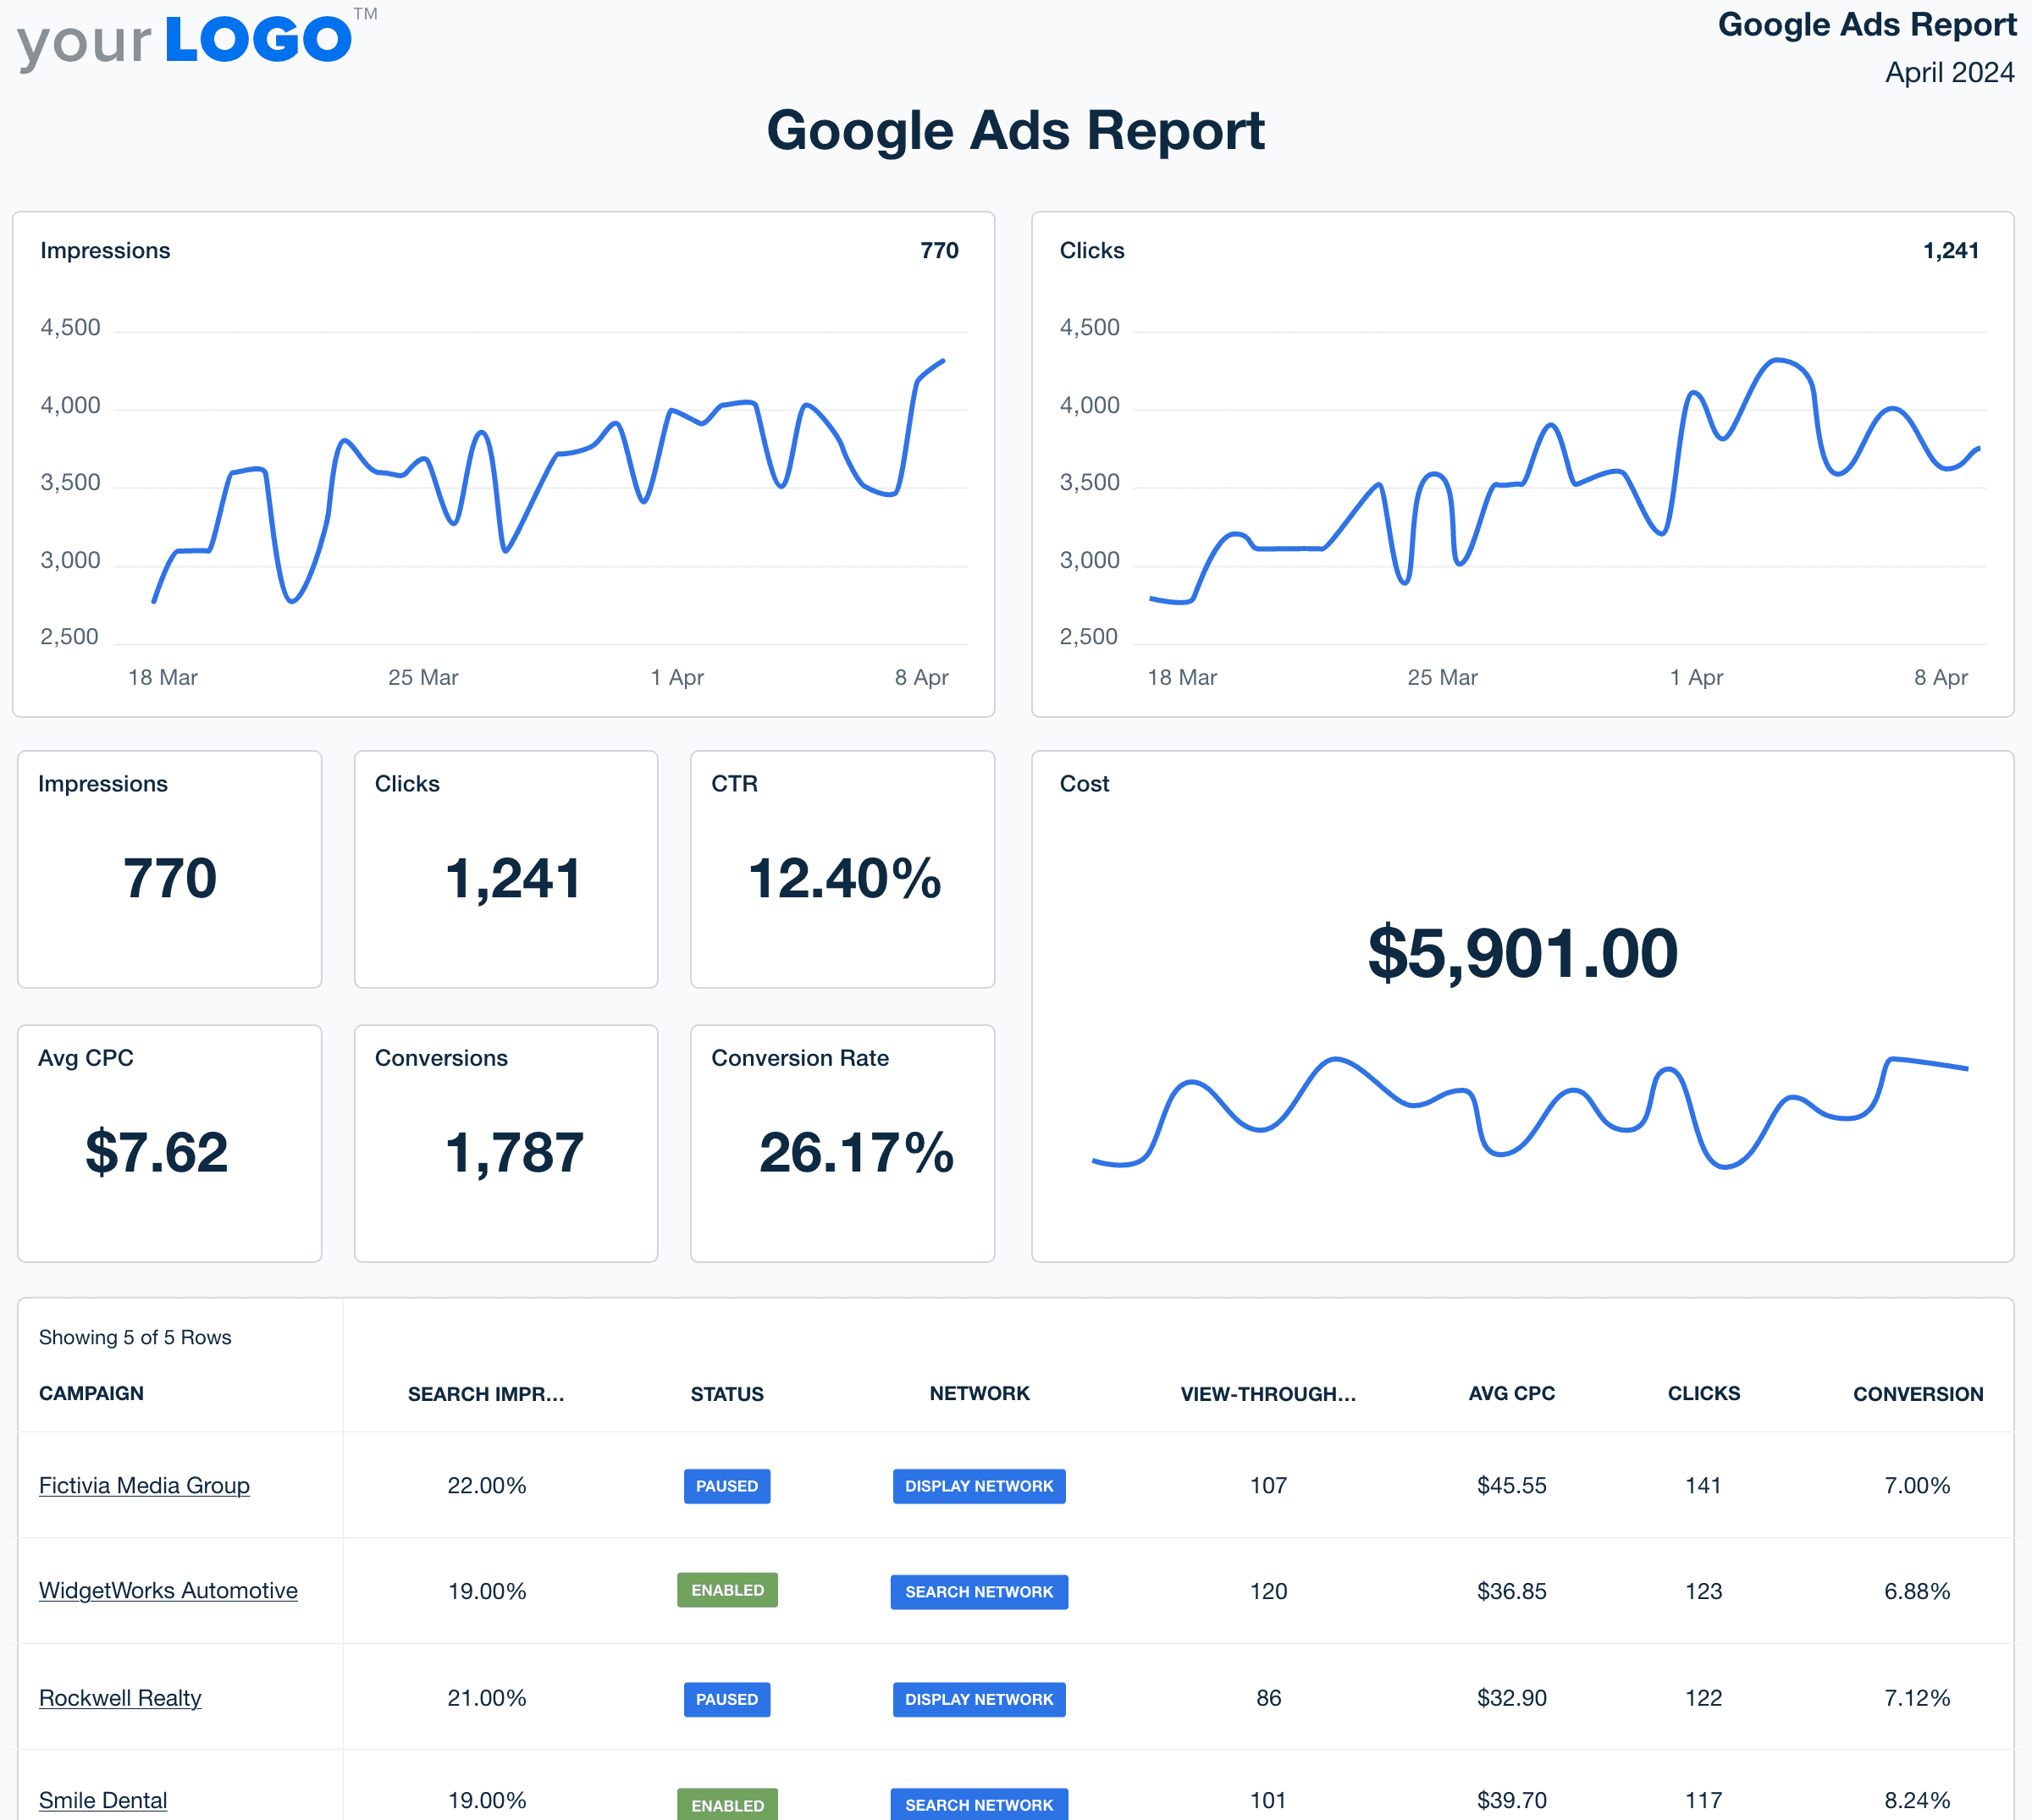
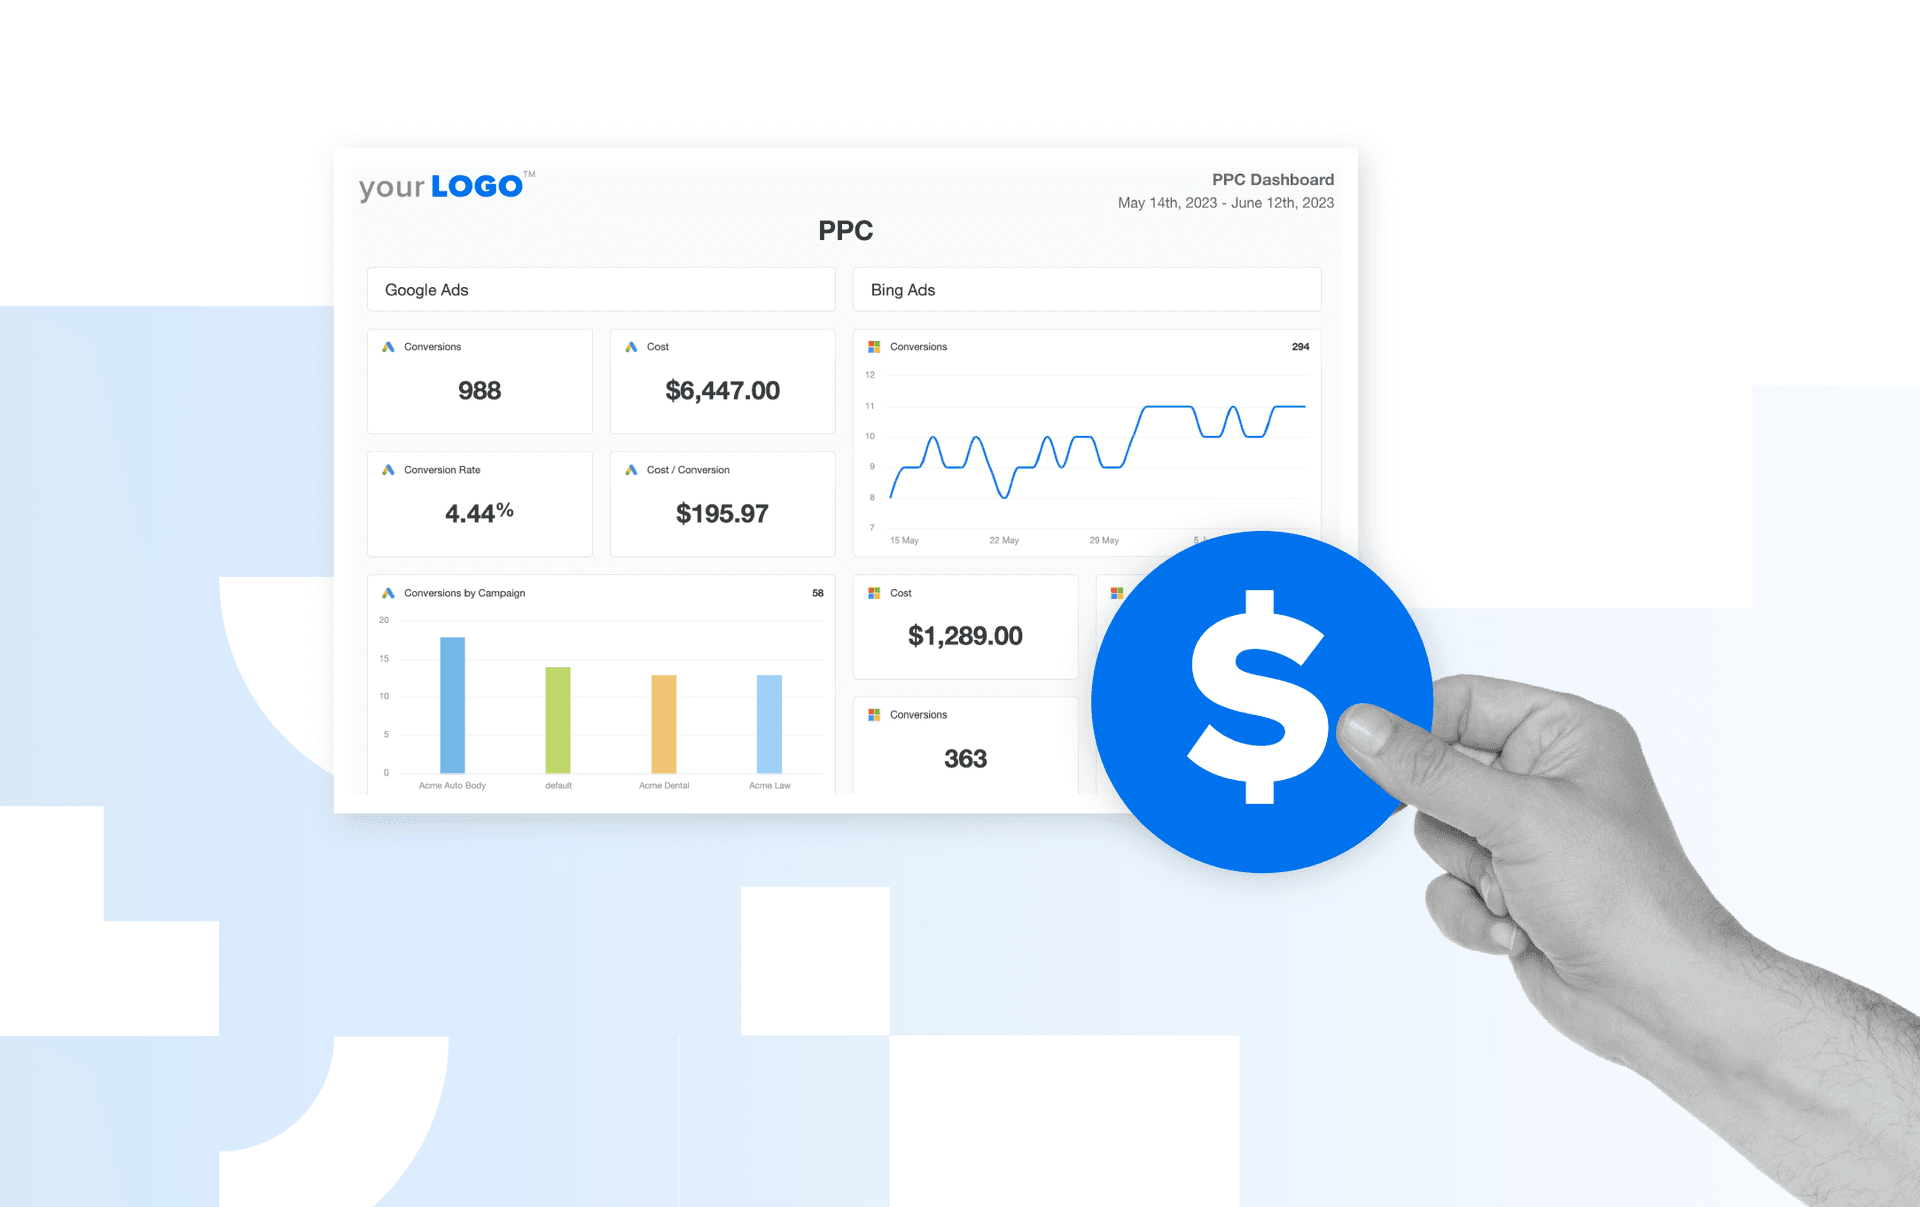
Deliver PPC insights in a professional, easy-to-understand format. Try this pre-built Google Ads report template in AgencyAnalytics–sign up for a free 14-day trial today.
Number of New Sign-Ups or Subscribers
This metric shows the number of users who provided their contact information in exchange for gated content, newsletters, free trials, or other lead magnets. These users aren’t necessarily ready to buy, but they’ve shown interest in your client’s brand and opted for ongoing communication.
Why It Matters:
Content Offer Validation: A high number of sign-ups suggests your client’s offer is compelling and well-targeted.
List Growth for Retargeting: New subscribers grow your client’s contact list, making it easier to follow up through email or refine targeting for future ads.
Number of Form Fills
This number reflects how many users completed and submitted a form after clicking on your client’s ad. This could include contact forms, quote requests, demo bookings, service inquiries, or content downloads.
Why It Matters:
Direct Conversion Signal: Form fills are often a key conversion goal, especially in B2B and service-based industries. They reflect user intent and can be directly tied to sales follow-up.
Landing Page Performance: A low number of form fills may indicate friction in the user experience. For example, this may include excessively long forms, unclear value propositions, or poor mobile optimization.
Bottom of Funnel PPC Metrics
These bottom-of-funnel metrics show whether a PPC campaign is driving real business results, relative to sales, revenue, and return. Use them to evaluate profitability, justify total ad spend, and guide long-term strategy.
Total Conversions
Total conversions track how many times users complete a specific goal after clicking on your client’s ad. This could include purchases, form fills, phone calls, or any other action.
Why It Matters:
Tangible Campaign Output: This metric reflects the actual number of desired actions taken. It provides a clear view of how well the ad campaign is delivering on its objective.
Client-Centric Performance: Conversions are often directly tied to a client’s business goals, making it one of the clearest ways to demonstrate value.
Total Revenue
Total revenue reflects the entire dollar value generated from conversions attributed to a client’s PPC campaign. This is most commonly tracked in ecommerce. However, it may also apply to service-based businesses that assign revenue values to completed actions.
Why It Matters:
Direct Financial Impact of PPC: Total revenue helps clients see exactly how much income their ad spend is generating. It keeps transparency on the table and reiterates the value of their investment.
Strategic Budgeting Decisions: Track revenue to identify which campaigns, products, or audiences are driving the highest value. Then, use this data to focus on the most revenue-generating campaigns.
Return On Ad Spend (ROAS)
Return on Ad Spend (ROAS) measures the revenue earned for every dollar spent on a PPC campaign. For example, if a client spends $2,000 and earns $10,000 in revenue, the ROAS is 5.0. This means the campaign earned $5 for every $1 spent, which indicates strong profitability and campaign efficiency.
Why It Matters:
Clear View of Profitability: ROAS is a direct measure of financial return, showing whether a campaign is generating more revenue than it costs to run.
Identification of High-Performing Channels: Compare ROAS across campaigns, ad platforms, and audience segments to pinpoint where ad spend delivers the greatest return.
Conversion Rate (AKA Close Rate)
Conversion rate measures the percentage of users who complete a desired action, such as a purchase, form submission, or call. A high conversion rate indicates that the ad, landing page, and offer are aligned and resonating with the audience.
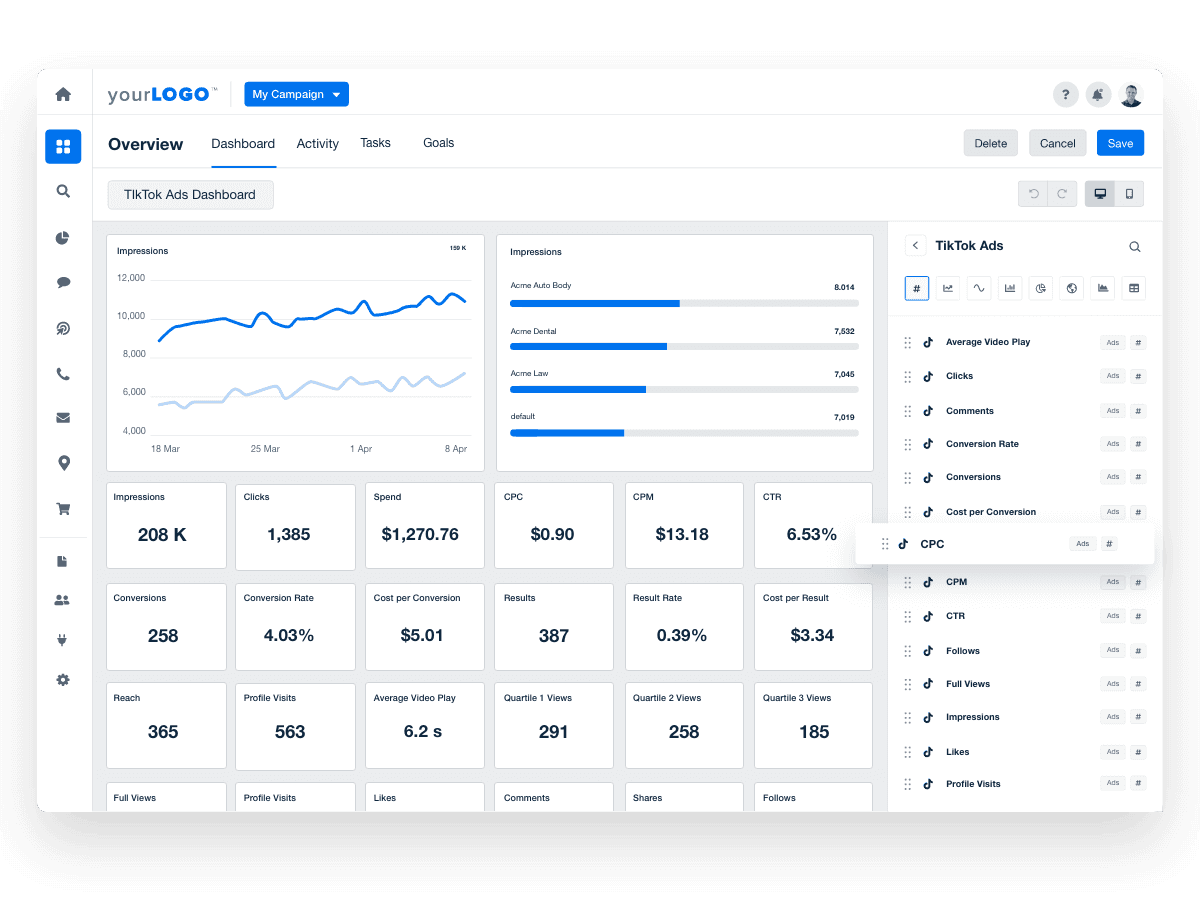
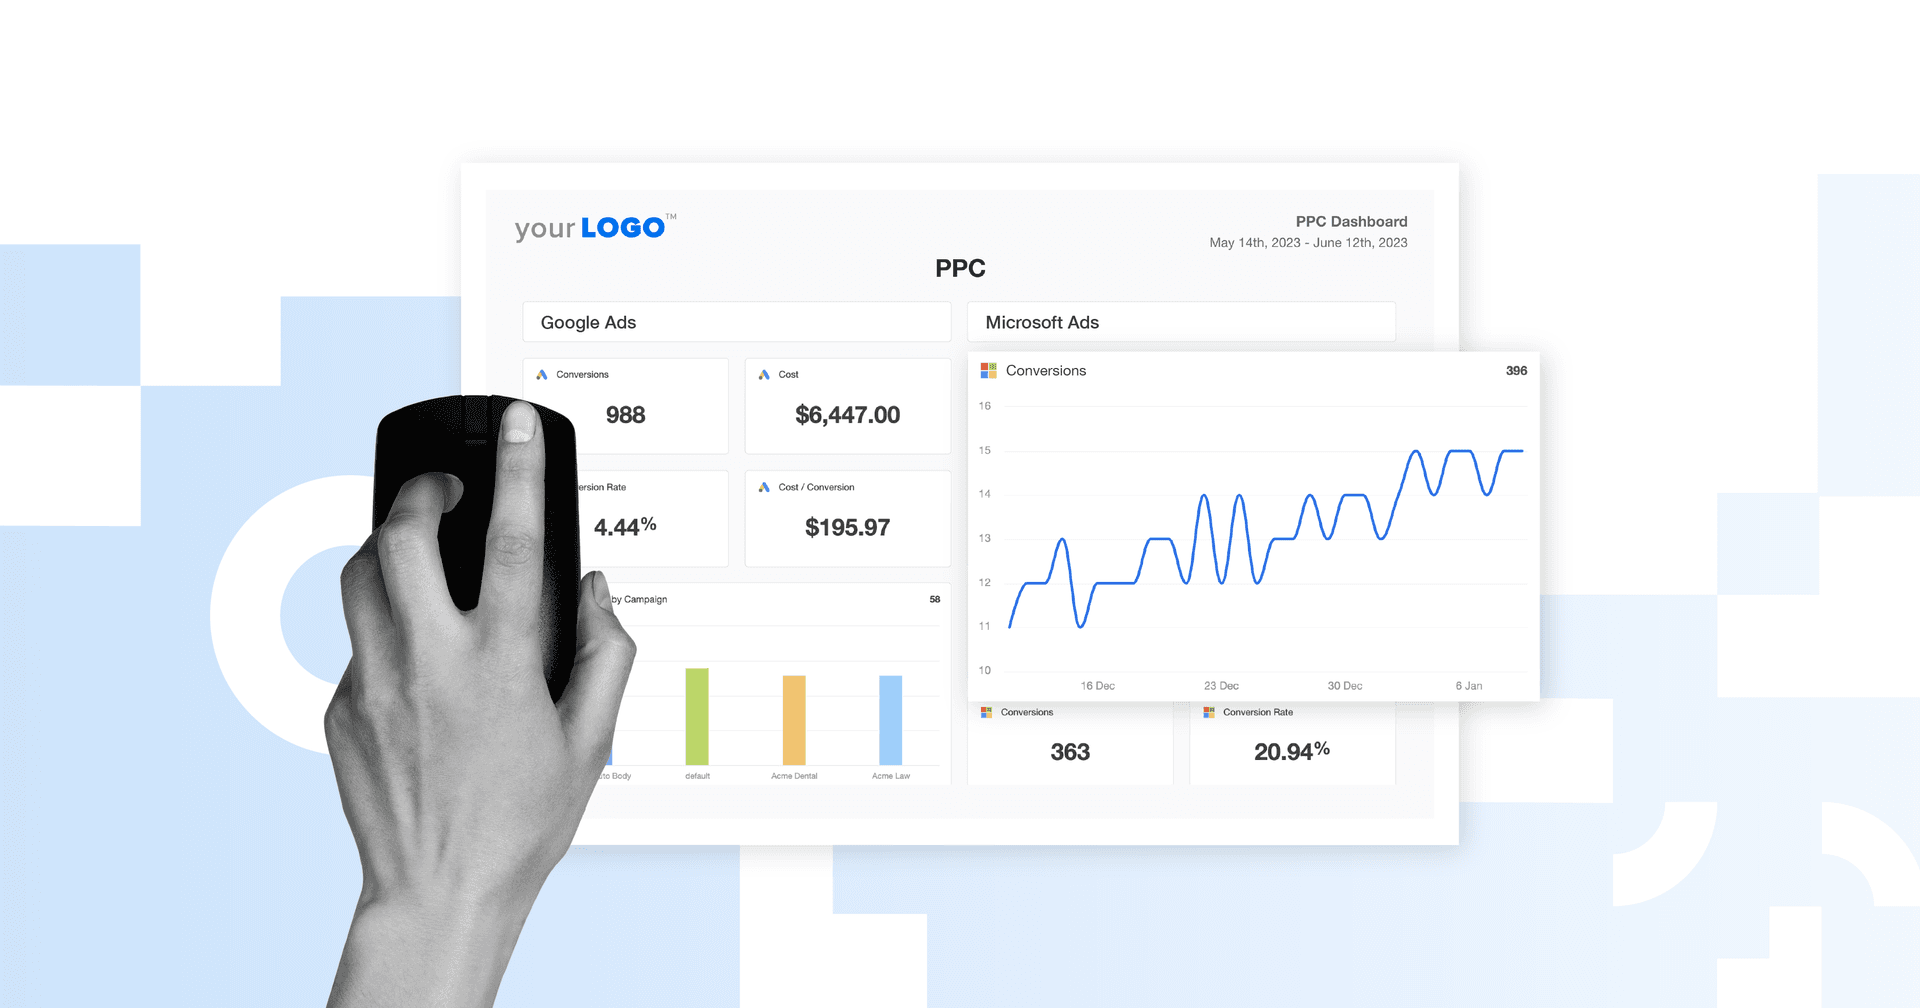
Customize PPC dashboards by swapping widgets, toggling with data visualizations, and adding comments. Explore the full range of features–try AgencyAnalytics, free for 14 days.
Why It Matters:
Funnel Friction Diagnosis: If clicks are high but conversions are low, the issue often lies in the landing page experience, form design, or overall value proposition.
Cost Efficiency: Improving conversion rate lowers the cost per acquisition, making each click more valuable and improving overall campaign ROI.
Cost Per Action (CPA)
Cost Per Action (CPA) shows how much was spent to drive a single predefined action, such as a purchase, form fill, sign-up, or phone call. The "action" varies depending on the campaign objective and client goals.
Why It Matters:
Campaign Efficiency: CPA shows how much it costs to get a user to take the desired action, making it a key metric for measuring performance against budget.
Alignment With Client Goals: Since the action is tied to what the client values most (e.g., leads or sales), CPA offers a clear view of how cost-effectively those goals are being met.
Cost Per Conversion
Cost per conversion measures how much is spent to drive one successful conversion, such as a sale, form fill, or call. While often used interchangeably with CPA (Cost Per Action), this metric typically focuses on end-goal conversions, such as completed purchases or qualified leads.
Why It Matters:
True Acquisition Cost: This metric reveals the actual cost of generating a meaningful result. Use it to evaluate whether a campaign is producing outcomes that justify the spend.
Keyword or Audience Strategy: Track cost per conversion at the keyword or audience level to pinpoint which groups are converting efficiently. If there’s wasted spend, consider adding negative keywords to improve ad relevance.
PPC Benchmarks for 2025
Metrics are a key part of the puzzle—that’s a given. That said, it’s important to consider campaign performance from a macro perspective.
Knowing how your client performs compared to their industry peers is powerful information. It answers key questions, like:
“Are we spending efficiently?”
“Is our client’s conversion rate on par with others?”
“Are we falling behind or leading in key areas like CTR, CPL, or ROAS?”
While general marketing benchmarks are useful, they’re just that… general. They don’t account for the nuances that agencies deal with, like campaign complexity, niche verticals, or the goals that truly define success for individual clients.
Instead of relying on generic numbers, explore a wealth of first-party benchmarks in AgencyAnalytics, sourced from 150,000 campaigns across 7,000+ agencies.
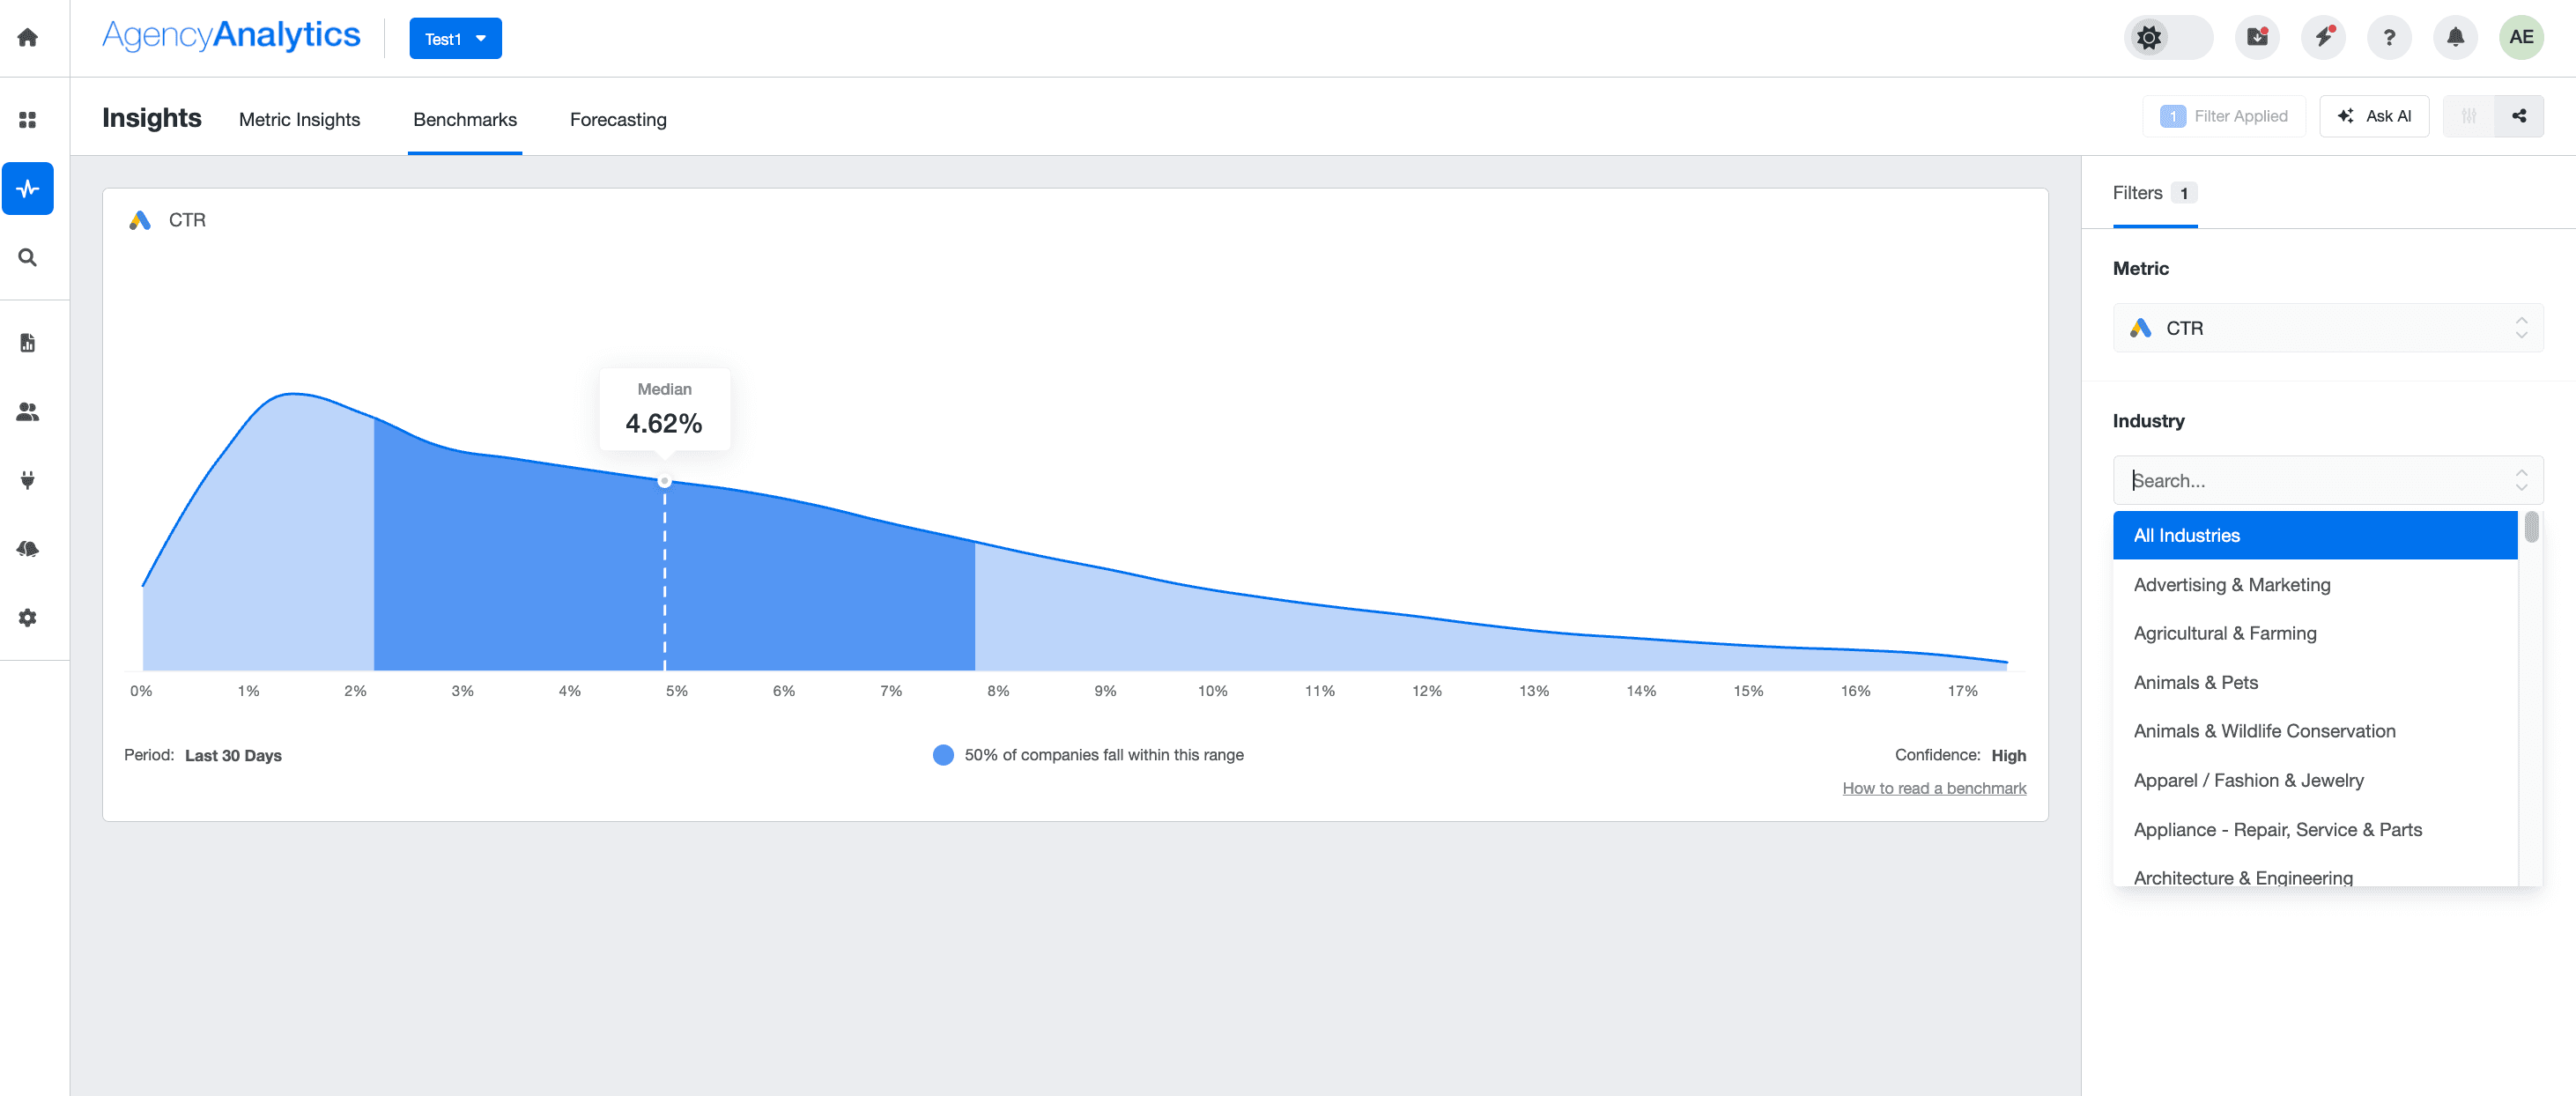
Wondering what it looks like? Here are a few top PPC benchmarks to know (across all industries).
Google Ads Benchmarks
Metric | Median Benchmark - May 2025 |
|---|---|
Average Cost Per Conversion | $33.07 |
Average Conversion Rate | 4.92% |
Average CTR | 3.57% |
LinkedIn Ads Benchmarks
Metric | Median Benchmark - May 2025 |
|---|---|
Average Cost Per Conversion | $75.86 |
Average Conversion Rate | 3.11% |
Average CTR | 0.59% |
TikTok Ads Benchmarks
Metric | Median Benchmark - May 2025 |
|---|---|
Average Cost Per Conversion | $8.45 |
Average Conversion Rate | 5.63% |
Average CTR | 0.49% |
Want access to industry-specific benchmarks across multiple marketing platforms? Check it out in AgencyAnalytics–sign up for a free 14-day trial today.
Advice on PPC Metrics From the Pros
The best advice comes from those managing PPC performance firsthand. We asked seasoned agency leaders to share one piece of advice they’d give about PPC metrics—the kind of insight that only comes from years of campaign management, client reporting, and real-world performance tracking. Here’s what they had to say.
1. Know How Metrics Are Created
PPC platforms don’t speak the same language. What one platform counts as a "conversion," another might define differently, or break into subcategories.
Each platform will use slightly different metrics or calculate them in different ways. For example, a Purchase in Meta is different than a Conversion in Google Ads. These are also different than “All Conversions”, which is a Google Ads metric, and “Web Purchases” in the Meta platform.
Tim Akers, Founder, Akers Digital
To avoid inaccuracies, always audit the ad setup (especially if your agency didn’t initially build or configure the account). Know exactly what each platform is counting before comparing performance. Misaligned definitions lead to bad decisions and misinformed clients.
2. Use Metrics to Guide Ad Budget Decisions
Data is your most important asset–use it to your advantage. Instead of reviewing performance in silos, compare results across channels to see what’s gaining traction. When one platform slows down, identify where another is performing better and shift spend accordingly.
We work to use the data presented from all channels to pivot when needed. As we see specific platforms' performance shifting, we take an overhead look at other channels that might be outperforming. From there, we reallocate budgets and continue to optimize. Without clear data, we're unable to make calculated decisions.
Christopher Marrano, Founder & CEO, Blue Water Marketing
By taking this proactive approach, you’ll deliver more effective paid campaigns and demonstrate expertise that clients will value.
3. Know What Your Agency Brings to the Table
ROI is important, but it doesn’t always tell the whole story.
Agencies often influence results through strategy, positioning, and knowledge through experience—factors that can’t always be tied to a click or conversion.
Explaining the return ROI can be challenging because it isn't as simple as equating ROI to ad spend or PPC budget—the agency's impact extends beyond direct advertising efforts to some unmeasurable factors, like our expertise in branding, market research, competitor analysis, and customer journey mapping.
Steph Busia, Account Manager, Moxie Tonic
When you report on performance, don’t limit the conversation to media spend and revenue. Include the less visible wins, too, such as improved campaign structure, a clearer brand voice, or smarter audience insights. Those contributions play a major role in long-term success, even if they aren’t always reflected in this month’s ROAS.
4. Report on What Your Clients Care About
A data-heavy report might look impressive, but if it doesn’t speak to what the client actually values, it creates confusion instead of clarity.
Find out what the client cares about the most and show them that information. Clients don't need to be given data they don't understand, EVEN if it makes you look good. Give them only what they want.
Rebecca, Marketing Director, Investigator Marketing
Before building reports, get aligned on what success looks like to the client. Then structure reporting around those KPIs. When clients see metrics that match their goals, they’re more likely to trust your strategy and stay with your agency longer.
Streamline Your PPC Metrics Reporting
As any experienced agency knows, tracking every metric doesn’t lead to better reporting. The key is zeroing in on what matters.
Focus on metrics that align with campaign goals, guide optimization, and make sense to the client. Whether it’s ROAS, CPL, or conversion rate, clarity beats volume every time.
When it’s time to bring everything together, AgencyAnalytics makes it easy to centralize PPC data in one place. Instead of relying on outdated or manual reporting methods, use this PPC reporting tool to:
Automatically retrieve data from 80+ platforms, including Google Ads, LinkedIn Ads, TikTok Ads, Google Analytics, and more.
Access a pre-built PPC dashboard template that streamlines data-tracking and the initial setup.
Deliver professionally designed PPC reports that capture your client’s most important metrics.
View first-party, in-platform PPC benchmarks sourced from 7,000+ agencies, not just general businesses.
Generate quick, actionable insights about PPC performance and other digital marketing efforts via a built-in Ask AI feature.
Spend less time pulling numbers and more time acting on them. Explore everything AgencyAnalytics has to offer–sign up for a free 14-day trial today.

Written by
Faryal Khan is a multidisciplinary creative with 10+ years of experience in marketing and communications. Drawing on her background in statistics and psychology, she fuses storytelling with data to craft narratives that both inform and inspire.
Read more posts by Faryal KhanSee how 7,000+ marketing agencies help clients win
Free 14-day trial. No credit card required.


