Ad Revenue
Performance Benchmarking
Compare total Ad Revenue across campaigns to identify top-performing strategies.
Budget Allocation
Adjust ad spend based on advertising revenue trends to maximize ROI.
Audience Targeting
Analyze ad impressions by segment to refine targeting and improve conversions.
Client Reporting
Showcase Ad Revenue in reports to highlight ROI and agency impact.
Why Ad Revenue Is Important
Ad Revenue is the income earned specifically from placing advertisements on digital platforms. It provides a direct measure of how well ads are performing and generating revenue, making it essential for evaluating marketing success. For a website owner, collecting Ad Revenue creates another income stream, driving sustainable growth.
Tracking total Ad Revenue over time allows businesses to identify trends, optimize ad placements, and adjust strategies to maximize earnings. It also provides agencies with a clear way to measure and showcase ROI in client reports. By consistently tracking and improving online Ad Revenue, businesses make data-driven decisions that enhance both engagement and profitability.

Stop Wasting Time on Manual Reports... Get PPC Insights Faster With AgencyAnalytics
How Ad Revenue Relates To Other KPIs
Ad Revenue is directly influenced by key performance indicators like Fill Rate, which measures the percentage of available ad slots filled with paid advertisements. A low fill rate indicates missed revenue opportunities, while a high rate ensures maximum monetization.
Additionally, Viewability and Ad Placement impact revenue by determining whether ads are effectively seen by users. Ads positioned in high-visibility areas tend to generate better engagement and higher earnings.
Audience Demographics and Traffic Sources also play a role in Ad Revenue performance. Advertisers are willing to pay more for targeted, high-intent audiences, meaning premium traffic sources—such as search-driven visitors—often result in higher revenue per user.

Key Factors That Impact Ad Revenue
Several factors influence Ad Revenue, from audience engagement to ad placement. Attracting advertisers that align with a website’s target audience is key, as well-matched demographics lead to better conversions and higher earnings.
Ad formats and ad networks also impact revenue. Video ads often outperform static banners, while premium online advertising placements command higher rates. Platforms like Google Ads and Google AdSense help website owners monetize traffic, but optimizing ad campaigns and placing advertisements for products strategically is essential.
Beyond format and placement, factors like seasonality and competition affect total Ad Revenue. Regular tracking and adjustments help maintain steady growth and profitability.

KPIs allow us, as the agency, to demonstrate our value to the client. Ultimately, what is their ROI from our efforts? When you can clearly demonstrate this month over month, it increases your retention rate and keeps clients paying you month after month.
How To Calculate Ad Revenue
Ad Revenue is income earned from advertising products or services on digital platforms. It is calculated based on how ads are priced, using models like CPM (cost per thousand impressions), CPC (cost per click), or revenue share agreements. However, to provide more context, here's a breakdown of a simplified Ad Revenue formula for a CPC model:
CPC (Cost Per Click) Ad Revenue is calculated by multiplying the total number of ad clicks by the cost per click (CPC). This model is commonly used in Google Ads, paid advertisements, and other ad networks where advertisers pay only when a user clicks on an ad.
Ad Revenue Formula Example
What Is a Good Average Ad Revenue?
A good average Ad Revenue varies by industry and ad type but generally falls within a profitable range that ensures sustainable returns. Agencies using Google Ads or working with ad networks typically aim for a revenue per ad that surpasses their cost per acquisition (CPA) while driving meaningful engagement. Higher-performing video ads and targeted online advertising campaigns often yield strong revenue, particularly in high-intent industries.
What Is a Bad Average Ad Revenue?
A bad average Ad Revenue occurs when placing ads fails to generate sufficient returns to cover costs. If the marketing KPI example Ad Revenue metric remains below industry averages or shows declining trends despite optimization, it signals inefficiencies. This often results from poor audience targeting, ineffective creative assets, or inefficient bidding strategies. Agencies using services on behalf of clients should monitor revenue per ad closely to prevent excessive spending without performance gains.
How To Set Ad Revenue Benchmarks and Goals
Rather than relying solely on industry averages, agencies should use their own historical data to set realistic benchmarks. By reviewing past digital marketing KPI examples, marketers can spot trends in audience engagement, seasonality, and platform performance. Combining historical insights with third-party data from ad networks helps refine expectations and improve the success rates.
Why Ad Revenue Matters to Clients
For businesses, Ad Revenue is a key measure of whether their advertising efforts are profitable. Clients want to see how much they’re earning specifically from placing ads on their website and how effectively this strategy translates into measurable returns. Tracking advertising revenue helps them determine which placements, ad formats, and audiences drive the most valuable results.
Beyond just earning money, publishers use Ad Revenue insights to optimize their monetization strategies. By analyzing which ad placements, formats, and traffic sources generate the highest returns, they refine their site layout and content strategy to maximize earnings. A well-optimized ad strategy ensures a steady income stream without compromising user experience, helping clients balance engagement with profitability.
For clients, Ad Revenue makes it possible to make smart, data-driven decisions that drive long-term business growth, not just generate income.

Why Ad Revenue Matters to Agencies
For agencies, Ad Revenue is proof of performance. Clients expect measurable results, and advertising revenue is a key metric that demonstrates the value of an agency’s strategy. A strong Ad Revenue report shows clients exactly how ad campaigns are driving real financial impact, reinforcing trust and long-term retention.
Beyond client reporting, agencies use advertising revenue to optimize strategy and scale success. By tracking trends, they can test ad placements, refine paid ads, and allocate budgets where they generate the highest returns. The ability to present clear, data-driven insights gives agencies a competitive edge, helping them secure renewals and win new business.
With the right tools, agencies efficiently track and report advertising revenue, proving ROI without spending hours on manual reporting—so they can focus on what really matters: growing their clients’ success and their own.

Save Time and Money By Automating Your Client Reporting
Best Practices When Analyzing and Reporting on Ad Revenue
Understanding Ad Revenue means looking beyond total earnings to see what’s driving results. Here are a few best practices to follow that ensure clients achieve maximum profitability.
Ensure Data Accuracy
Breaking down Ad Revenue by individual campaigns helps marketers determine which efforts yield the highest return on investment. Identifying top-performing campaigns allows businesses to replicate successful strategies and scale what works.
Analyze Over Time
Ad Revenue fluctuates—it’s expected. The key is tracking patterns over time to catch shifts in seasonality, campaign growth, or underperformance. Looking at daily, weekly, and monthly trends helps businesses stay ahead of budget adjustments and capitalize on high-performing moments.
Put in Context
Compare revenue against costs, engagement metrics, and conversion rates. Understanding how revenue aligns with broader marketing KPIs ensures a well-rounded approach to performance evaluation.
Visualize Performance
Data visualization simplifies complex Ad Revenue reports, making it easier to identify trends and share insights with stakeholders. Charts, graphs, and dashboards provide a clear overview of revenue performance across time, channels, and campaigns, enhancing insights for services on behalf of clients and internal teams.
Align to Client Goals
Ad Revenue analysis should tie back to broader business objectives. Measuring revenue in alignment with key targets ensures advertising efforts are strategically focused. Defining success metrics that support long-term growth helps businesses maximize ad impact.
Include Actionable Recommendations
To maximize Ad Revenue, businesses need more than just data—they need a clear strategy. Testing different creative approaches and optimizing ad placements ensures that every dollar spent contributes to growth. A data-driven approach turns insights into impactful decisions that drive long-term profitability.
KPIs are important to clients because they want to understand how much they are spending, what they are spending it on and most importantly, what is the return on their spend. They also want to be able to measure the progress of the marketing campaigns month over month.
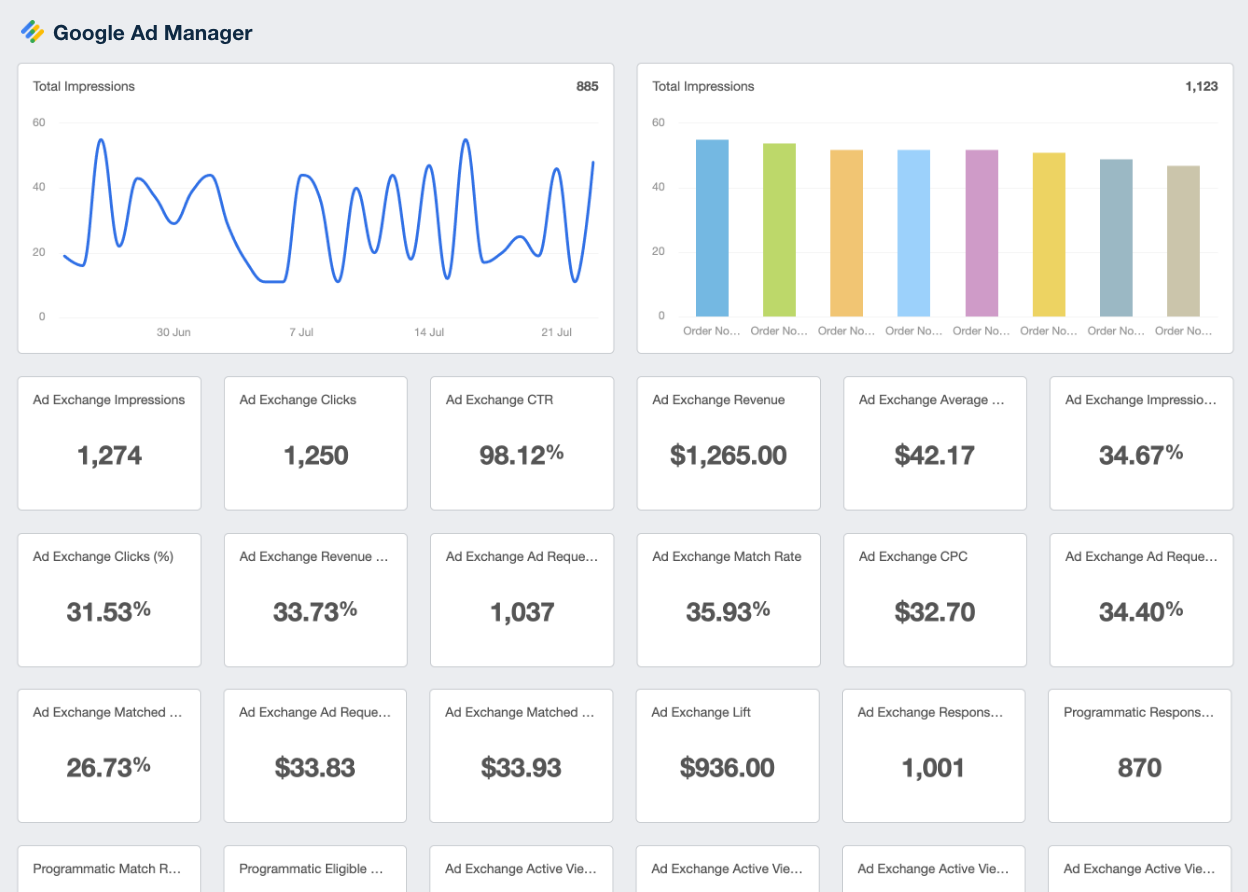
Google Ad Manager Dashboard Example
Related Integrations
How To Improve Ad Revenue
Boosting Ad Revenue starts with refining placements, optimizing pricing, and leveraging audience insights. Here are three quick tips to help maximize returns.
Improve Audience Targeting
Align ad content with audience preferences to boost engagement and conversion rates, ultimately driving more Ad Revenue with a better-focused approach.
Optimize Ad Placement
Test different placements like above-the-fold or in-content ads. Use heatmaps and A/B testing to find what drives the most engagement and conversions.
Adjust Pricing Strategies
Adjust CPC and CPM strategies based on market trends. Automated bidding can help optimize costs and increase revenue. Monitor market trends and adjust bids accordingly to maintain a competitive edge.
Related Blog Posts
See how 7,000+ marketing agencies help clients win
Free 14-day trial. No credit card required.


