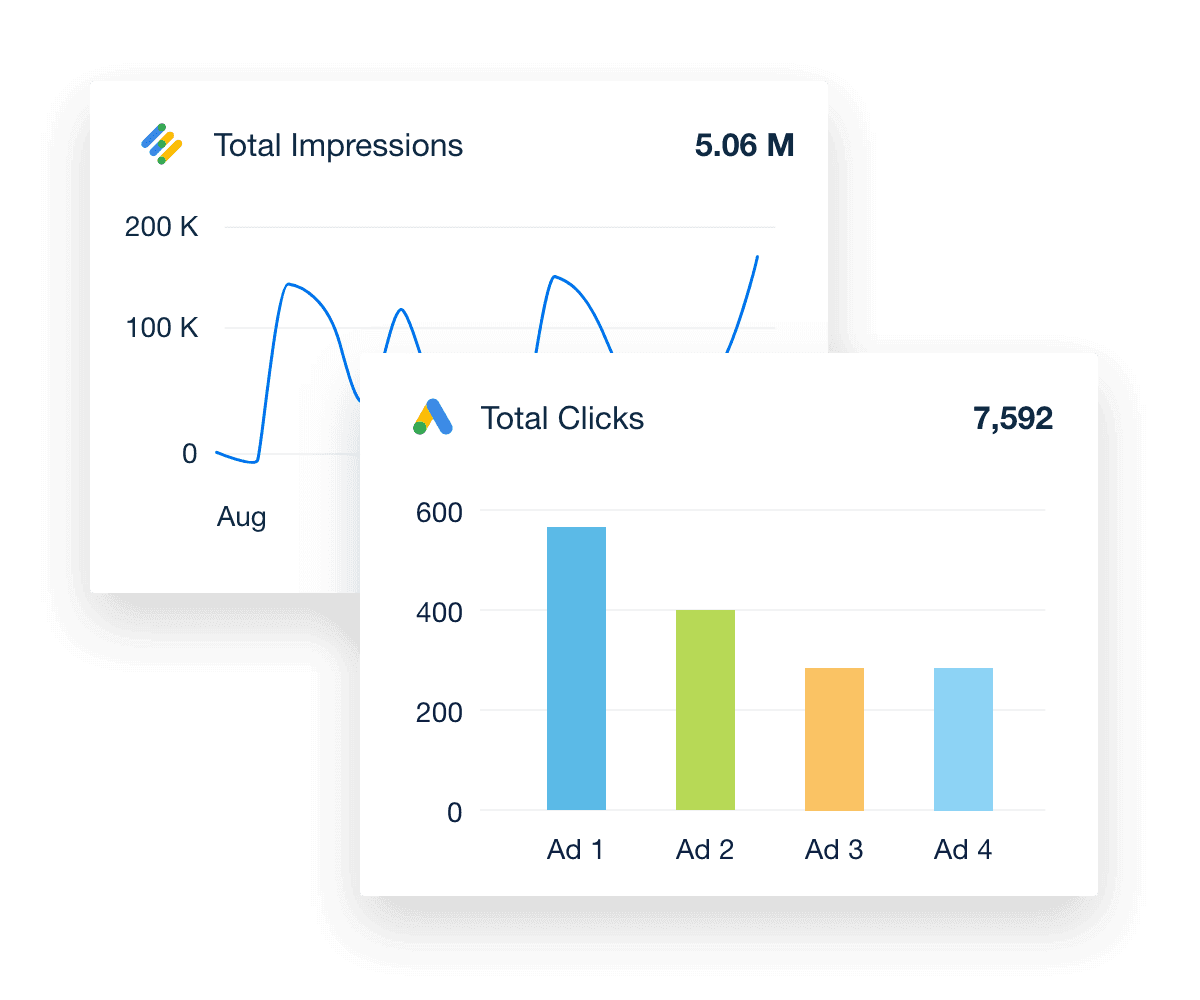
Google Ad Manager Reporting
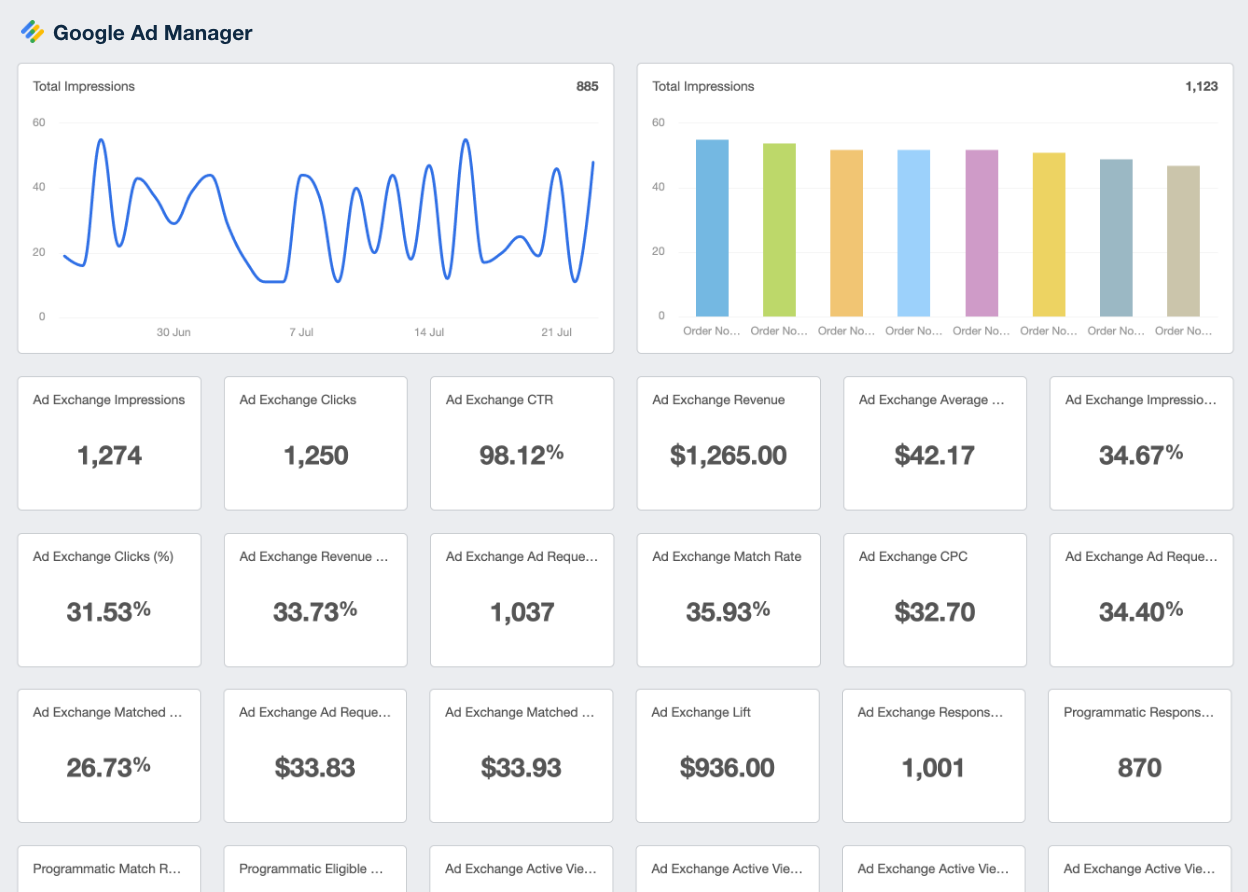
Bring Google Ad Manager data into focus
Transform complex metrics into clear, client-friendly reports that reveal what's working and where to improve.
Monitor Inventory Performance
View impressions, clicks, revenue, & more for your clients’ orders, line items, & creatives
In-Depth Analysis
Track how key values & placements of ad units are performing within your clients’ ad inventory
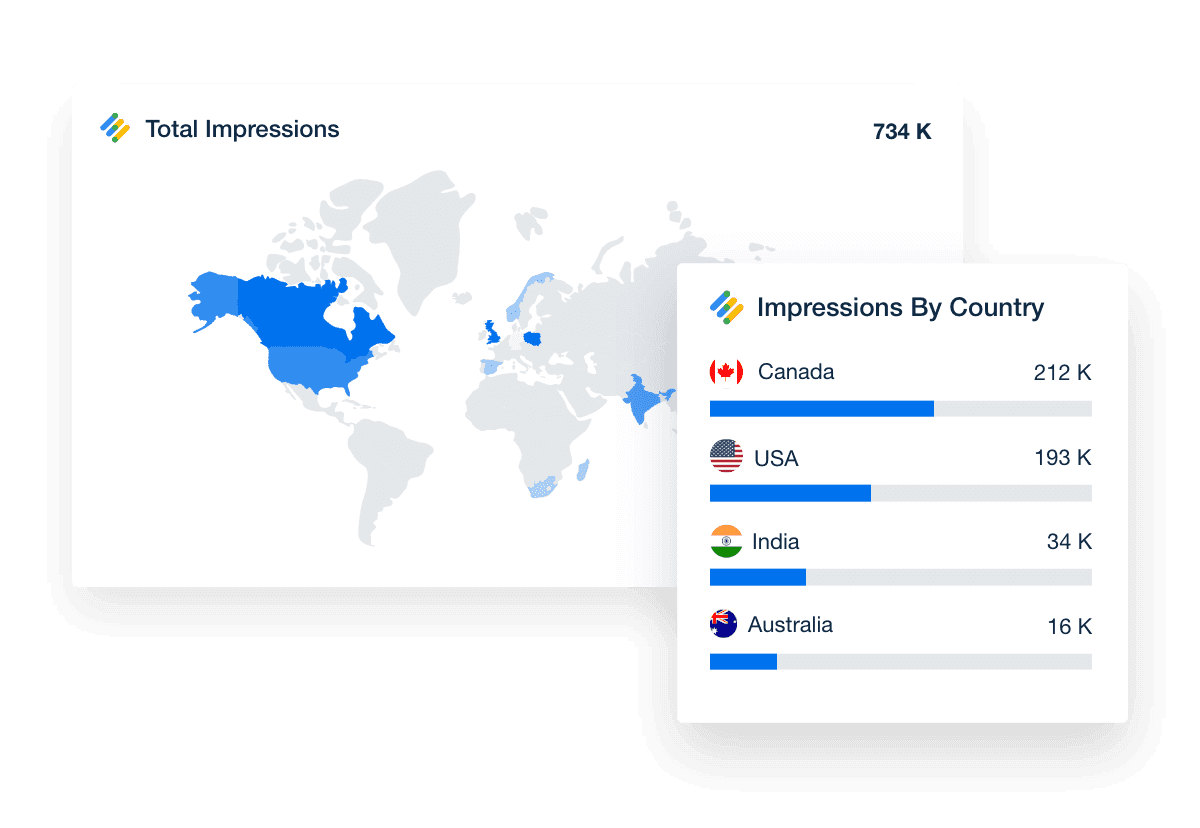
Track Demographics
Understand which countries, devices, browsers, & OS drive ad inventory performance
Build Custom Dashboards
Create intuitive dashboards that help you manage ad inventory & audiences served
Track & Manage Clients’ Ad Inventory
If you’re leveraging Google Ad Manager to monetize your clients’ prime digital ad space—whether it’s on their website, app, or elsewhere—you need to maximize their returns. Clearly track ad inventory impressions, clicks, revenue, and more through orders, line items, and creatives. Easily identify areas of growth and take action on low performing ad units.
Explore All Available Google Ad Manager Metrics
- Ad Exchange Active View Average Viewable Time
- Ad Exchange Active View Eligible Impressions
- Ad Exchange Active View Measurable Impressions
- Ad Exchange Active View Measurable Impressions Rate
- Ad Exchange Active View Viewable Impressions
- Ad Exchange Active View Viewable Impressions Rate
- Ad Exchange Cost Per Click
- Ad Exchange Lift Earnings
- Ad Exchange Line Item Level Average Ecpm
- Ad Exchange Line Item Level Clicks
- Ad Exchange Line Item Level CTR
- Ad Exchange Line Item Level Impressions
- Ad Exchange Line Item Level Percent Clicks
- Ad Exchange Line Item Level Percent Impressions
- Ad Exchange Line Item Level Revenue
- Ad Exchange Line Item Level With Cpd Percent Revenue
- Ad Exchange Match Rate
- Ad Exchange Matched Request CTR
- Ad Exchange Matched Request Ecpm
- Ad Exchange Responses Served
- Ad Exchange Total Request CTR
- Ad Exchange Total Request Ecpm
- Ad Exchange Total Requests
- Ad Server Active View Average Viewable Time
- Ad Server Active View Eligible Impressions
- Ad Server Active View Measurable Impressions
- Ad Server Active View Measurable Impressions Rate
- Ad Server Active View Revenue
- Ad Server Active View Viewable Impressions
- Ad Server Active View Viewable Impressions Rate
- Ad Server All Revenue
- Ad Server Clicks
- Ad Server Cpd Revenue
- Ad Server CPM And CPC Revenue
- Ad Server CTR
- Ad Server Impressions
- Ad Server Line Item Level Percent Clicks
- Ad Server Line Item Level Percent Impressions
- Ad Server Line Item Level With Cpd Percent Revenue
- Ad Server Responses Served
- Ad Server Unfiltered Begin To Render Impressions
- Ad Server Unfiltered Clicks
- Ad Server Unfiltered Impressions
- Ad Server With Cpd Average Ecpm
- Adsense Active View Average Viewable Time
- Adsense Active View Eligible Impressions
- Adsense Active View Measurable Impressions
- Adsense Active View Measurable Impressions Rate
- Adsense Active View Viewable Impressions
- Adsense Active View Viewable Impressions Rate
- Adsense Line Item Level Average Ecpm
- Adsense Line Item Level Clicks
- Adsense Line Item Level CTR
- Adsense Line Item Level Impressions
- Adsense Line Item Level Percent Clicks
- Adsense Line Item Level Percent Impressions
- Adsense Line Item Level Revenue
- Adsense Line Item Level With Cpd Percent Revenue
- Adsense Responses Served
- Date
- Dropoff Rate
- Inserted At
- Programmatic Match Rate
- Programmatic Responses Served
- Row ID
- Sdk Mediation Creative Clicks
- Sdk Mediation Creative Impressions
- Total Active View Average Viewable Time
- Total Active View Eligible Impressions
- Total Active View Measurable Impressions
- Total Active View Measurable Impressions Rate
- Total Active View Revenue
- Total Active View Viewable Impressions
- Total Active View Viewable Impressions Rate
- Total Ad Requests
- Total Code Served Count
- Total Fill Rate
- Total Inventory Level Unfilled Impressions
- Total Line Item Level All Revenue
- Total Line Item Level Clicks
- Total Line Item Level CPM And CPC Revenue
- Total Line Item Level CTR
- Total Line Item Level Impressions
- Total Line Item Level With Cpd Average Ecpm
- Total Programmatic Eligible Ad Requests
- Total Responses Served
- Total Unmatched Ad Requests
- Video Trueview Skip Rate
- Video Trueview Views
- Video Trueview Vtr
- Video Viewership Auto Plays
- Video Viewership Average View Rate
- Video Viewership Average View Time
- Video Viewership Click To Plays
- Video Viewership Complete
- Video Viewership Completion Rate
- Video Viewership First Quartile
- Video Viewership Midpoint
- Video Viewership Start
- Video Viewership Third Quartile
- Video Viewership Total Error Count
- Video Viewership Total Error Rate
- Video Viewership Video Length
- Yield Group Estimated CPM
- Yield Group Estimated Revenue
- Yield Group Impressions
- Yield Group Mediation Chains Served
- Yield Group Mediation Fill Rate
- Yield Group Mediation Passbacks
- Yield Group Mediation Third Party Ecpm
AD INVENTORY REVENUE TRACKING
Clearly Present Your ROI
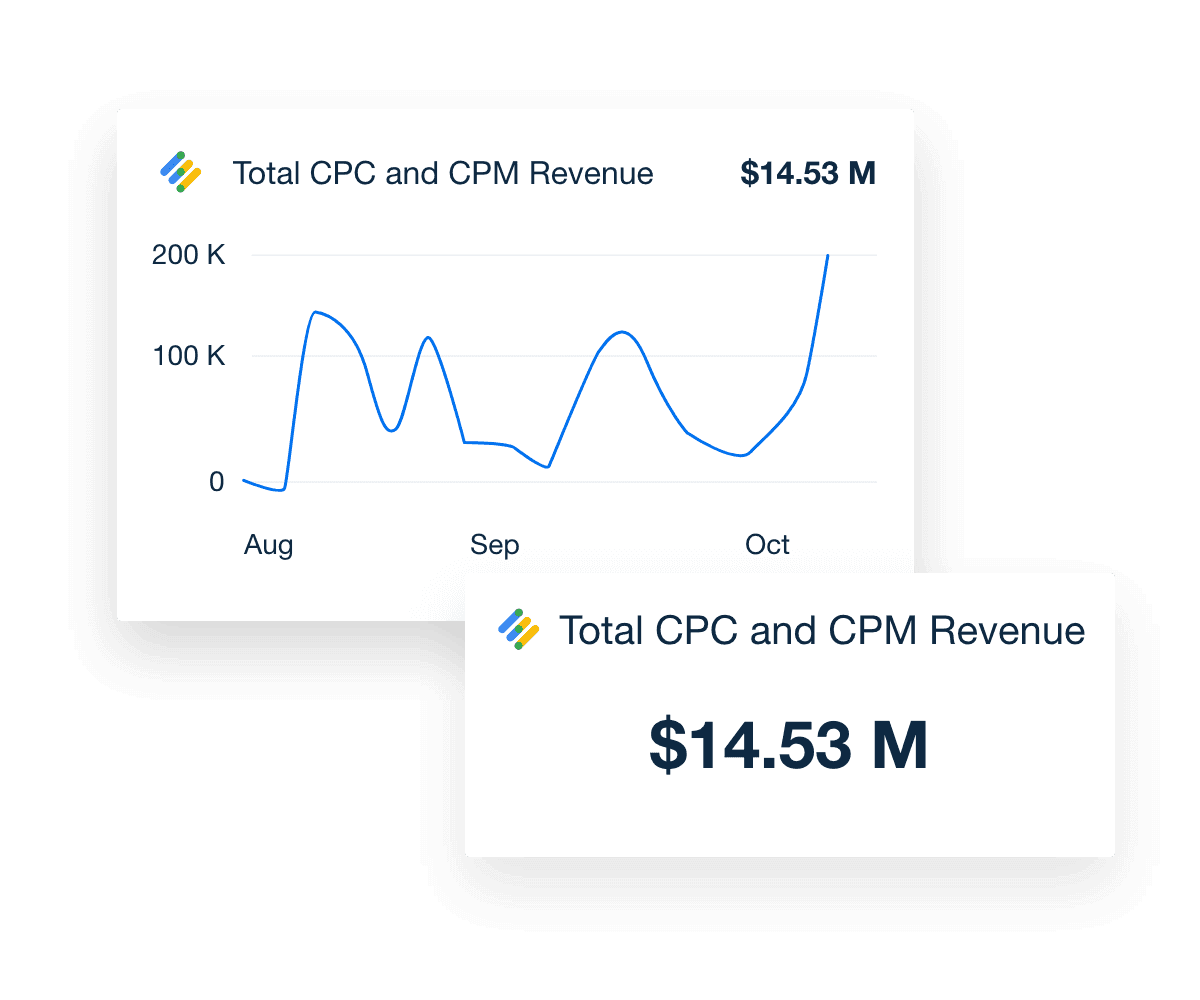
Demonstrate exactly how the performance of your client’s ad inventory is impacting their bottom line over time. Display the CPC and CPM revenue and layer in CPD and vCPM to show how much is being earned from ads. Track eCPM to further report on the average revenue generated from ads in your clients’ inventory.

REFINE YOUR TARGETING AND OFFERINGS
Compare Performance of Key Values and Ad Unit Placements
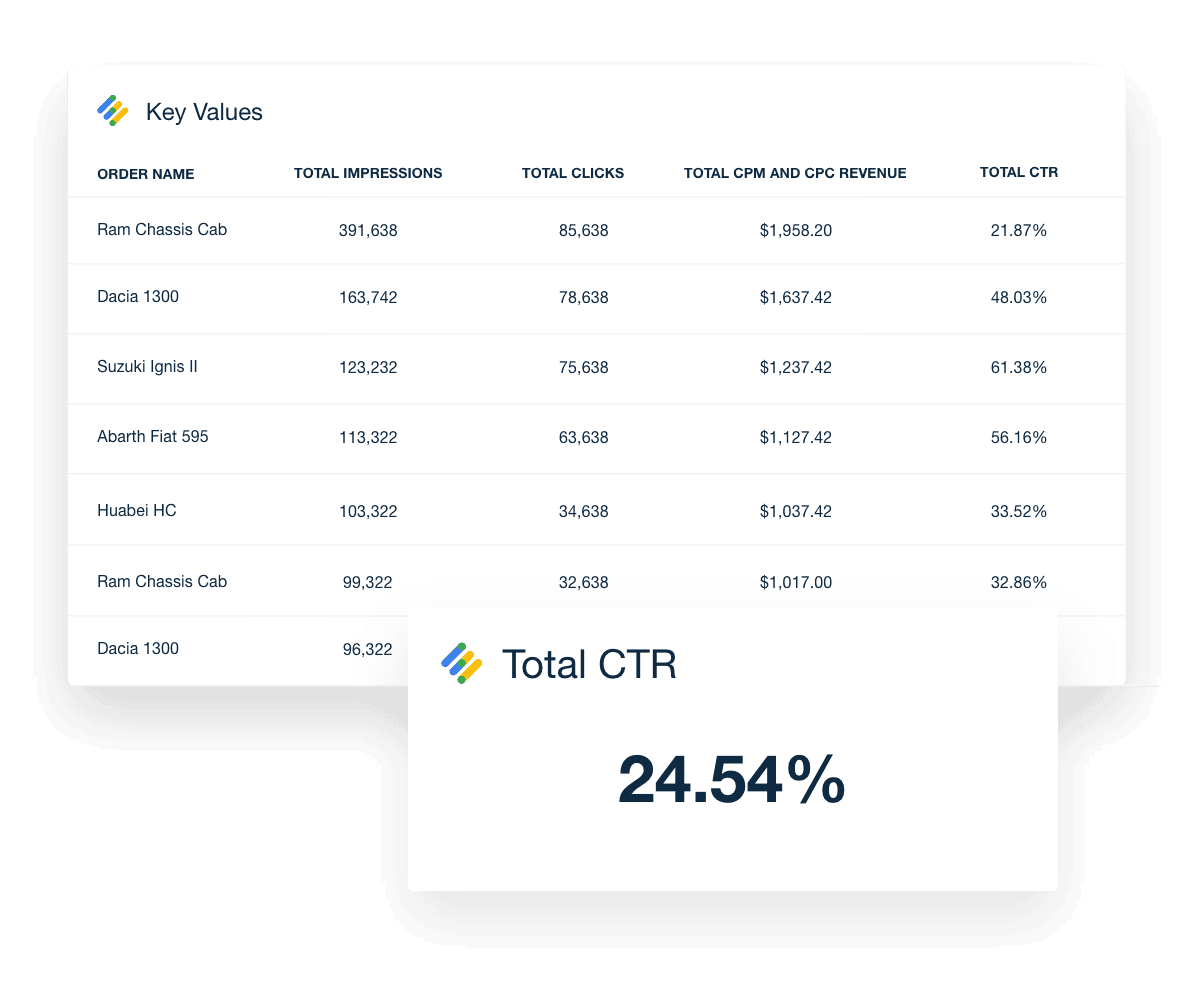
Adding value and ROI to your clients’ inventory of ad offerings has a direct impact on demand from advertisers and buyers. Understand which types and groupings of ad units are performing for a client by monitoring and reporting on the performance of Key Value and Placements performance. Drill into impressions, clicks, and revenue by orders, line items, and creatives for detailed insights.

TAILOR YOUR AD INVENTORY STRATEGY
Detailed Demographic Reports
Knowing your market is key. Track the most impactful audience for your client’s ad inventory so you know exactly who to target in your ad management strategy. Dissect ad performance by geographic location, device, browser, and operating system.



FAQs About Google Ad Manager Reporting for Marketing Agencies
Need clarity on ad inventory performance? These answers help agencies track key metrics, automate reports, brand deliverables, and scale reporting across publisher clients.
Focus on impressions, clicks, and revenue across orders, line items, and creatives. For deeper insight, include CPM, CPC, and eCPM by placement or demographic segments to show monetization effectiveness.
Yes. Agencies automate Google Ad Manager reporting by scheduling automated reports or creating live dashboards that pull these key metrics directly from Ad Manager. Once configured, reports and dashboards update automatically—delivering up-to-date ad inventory performance without manual exports.
Agencies white label Google Ad Manager reports on select AgencyAnalytics plans by applying their branding—logo, colors, layout, and custom portal URLs—through central settings. Reports retain consistent branding across every dashboard and export with no extra setup.
Creating a custom Google Ads Manager report is easy. Simply select metrics that matter—such as revenue by placement or impressions by device—then arrange visual widgets using the drag-and-drop editor. Agencies further enhance reports with custom commentary, automated goal tracking, and advanced data visualizations to create client-specific insights in minutes.
Agencies streamline multi-client reporting with reusable dashboard templates that auto-fill with up-to-date Google Ad Manager data. Templates are duplicated in seconds, enabling the fast rollout of consistent, branded reports that scale effortlessly across client portfolios.
More integrations
Everything your agency needs

Automated Reports

White Label Dashboard

Client & Staff Access

Connect Your Data

AI Powered
Goal & Budget Tracking
See how 7,000+ marketing agencies help clients win
Free 14-day trial. No credit card required.


