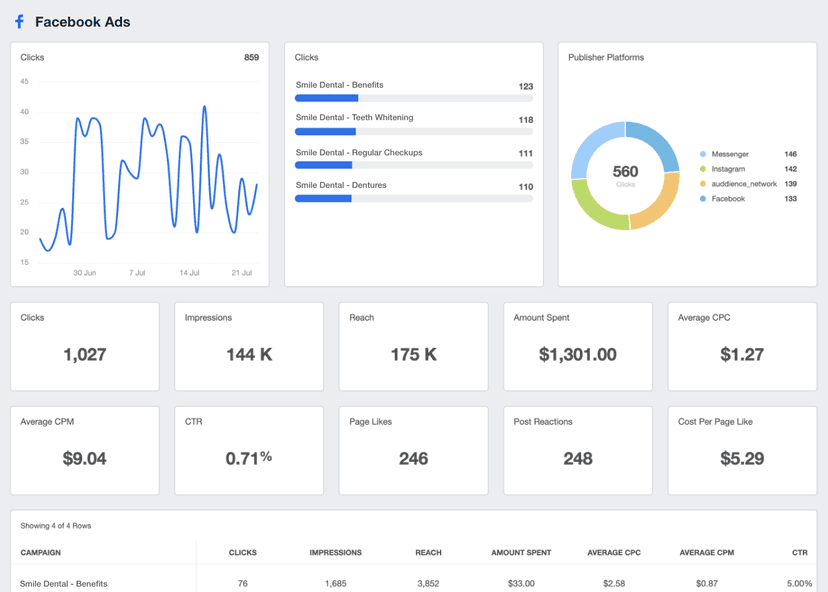
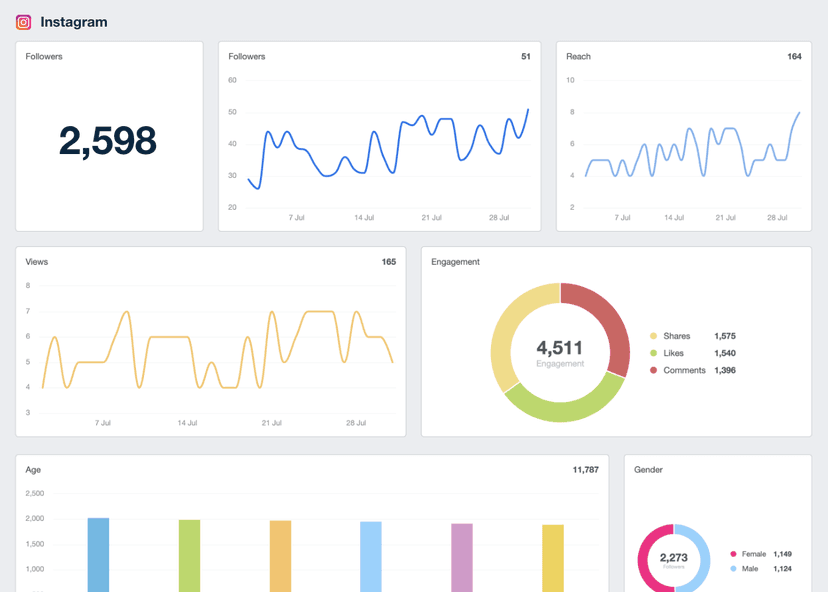
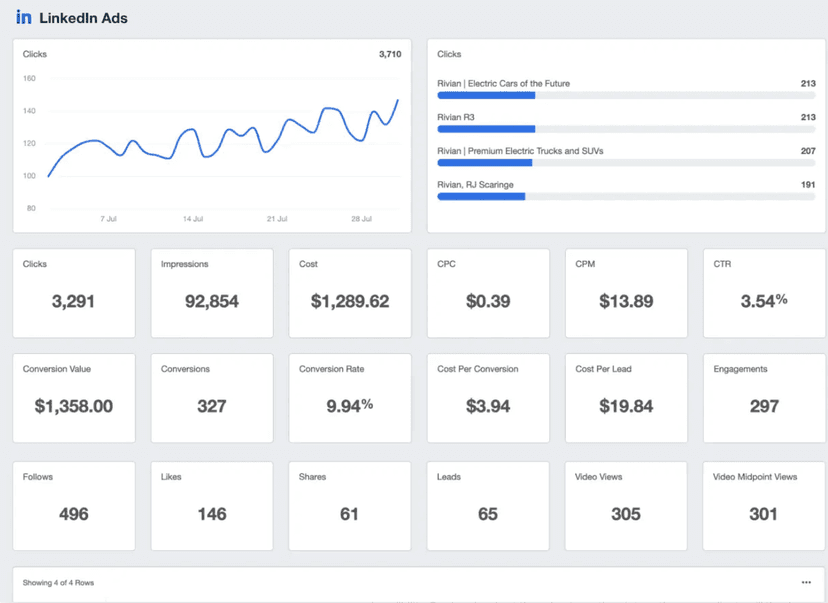
Impressions
Refining Ad Placement
Monitor Impressions across different platforms to optimize positioning for maximum visibility.
Calculating CPM
Gauge effectiveness of ad expenditure by determining the cost per every 1,000 ad views.
Understanding Audience Insights
See which demographics view the content to know whether it’s reaching intended audiences.
A/B Testing
Run A/B tests to pinpoint the creative that gets the most Impressions and use it to create impactful ad content.
Why Impressions Are Important
Impressions are particularly crucial in the awareness stage of the marketing funnel, where the primary goal is to grab attention and make a brand known to potential customers or advocates.
Additionally, Impressions assess which platforms generate the most visibility, helping to allocate resources strategically.
Lastly, Impressions highlight the virality of content. If Impressions are soaring, it indicates that messaging is being seen by many users and gaining traction.
While Impressions don’t give the complete picture (e.g., it doesn’t show a user’s perception or actions), it’s helpful to understand whether the content is being seen by the right people.
Stop Wasting Time on Manual Reports... Get Insights Faster With AgencyAnalytics
How Impressions Relate To Other KPIs
Considering Impressions as a standalone number may result in a vanity metric situation and muddy the overall marketing picture. That’s why Impressions should be considered alongside other Digital Marketing Key Performance Indicators (KPIs).
For example, consider engagement (e.g., Clicks, Shares) as a sibling to Impressions. While Impressions measure how often content is seen, engagement reveals deeper insights and whether messaging resonates.
On the other hand, Click-Through Rate (CTR) and Conversion rate estimates how many viewers turn into visitors, and how many of those visitors become actual customers.
Monitoring these metrics to understand user behavior and make informed marketing decisions.
Paid Impressions vs. Organic Impressions
The differentiation between paid and organic Impressions sheds light on the effectiveness of paid advertising efforts versus the organic reach of content. Paid Impressions are those garnered through paid ads on platforms like Google Ads or social media advertising. These are purposeful investments aimed at boosting visibility.
On the other hand, organic Impressions emerge naturally from non-paid sources. They are the result of SEO efforts, the inherent appeal of content, and social media shares. Tracking both provides a complete picture of a campaign's reach, allowing for an informed strategy that balances organic appeal with paid visibility.

A good metric is something that can be quickly and easily translated into a result, whether that be positive or negative. If the goal is to increase brand awareness, then impressions or reach become extremely important. If sales are the end game, then ROAS is king.
How To Measure Impressions
Impressions represent the number of times a piece of content shows up on someone's screen. Most advertising platforms already offer Impressions as a native metric, simplifying the tracking process.
While this metric counts multiple appearances to the same user, agencies calculate Impressions manually by multiplying content reach by the frequency of its display.
For instance, if a social media post is seen by 100 users and appears 30 times across various time periods, the total Impressions come to 3000.
Impressions Formula Example
What Is a Good Number of Impressions?
A good average number of Impressions varies based on industry and target audience. While there isn’t a one-size-fits-all, it’s crucial to understand Impressions in relation to more actionable metrics (unless reach or brand awareness is the primary goal of the campaign).
For example, 100,000 Impressions may seem fantastic, but the quality of those Impressions matters, too. It may not mean as much if there was an aggressive conversion goal for a campaign and the end result was two online sales.
On the other hand, 200 Impressions for a newly launched local business may lead to brand recognition, in-person walk-ins, and increased revenue. It all boils down to how success is defined.
What Is a Bad Number of Impressions?
Conversely, a low average number of Impressions may suggest that content isn't gaining enough visibility.
For example, very few Impressions could mean that further content refinement is needed (e.g., using high-resolution images and adjusting text-to-image ratio).
For paid ads, a low number of Impressions typically indicates that bids aren’t competitive enough or the targeting is too narrow, including keywords and audience segments.
When impressions fall far below expectations, consider it a sign to review audience targeting, messaging, and bidding strategies. This focuses on the users who are most likely to be interested in the content and take action later.
How To Dig Deeper Into Impression Date
To gain deeper insights, consider segmenting Impressions by demographics, locations, or devices. Analyzing performance by subsets reveald valuable insights for example, a high number of Impressions in a specific geographic location. Over time, use these historical insights as benchmarks to determine whether there’s the same visibility as before. This helps to monitor content performance and optimize it over time.
Why Impressions Matter to Clients
Impressions are more than numbers–they signal how often potential customers see a client’s content. The more Impressions the content receives, the broader a client's message spreads.
That means a client’s brand is more likely to be remembered when customers are ready to engage further or make a conversion-driven decision like an online sale or website click, for example. Impressions are the initial gateway that fosters brand recognition and gets a client’s name out there.

Why Impressions Matter to Agencies
At a marketing agency, Impressions are useful to demonstrate the initial impact of client campaigns. For example, tracking ad impressions helps agencies understand the breadth of their client’s brand reach and whether campaign improvements are needed, such as increasing ad spend or fine-tuning creative.
Coupled with other relevant metrics, Impressions indicate whether a client’s strategy is on the right track for achieving more tangible results, whether it's an ad view or a visit to a web page. Analyzing Impressions across various channels helps agencies refine marketing strategies and dedicate resources strategically.

When looking at metrics, it’s important to prioritize them based on the most important KPIs. For example, a local restaurant just in the midst of launching may focus on impressions for awareness purposes. Always consider what’s the number one thing that will help move the needle.
Better, Faster & Easier Client Reports Are Just a Few Clicks Away
Best Practices When Analyzing and Reporting on Impressions
To get the most from Impressions data, here are a few actionable steps to follow.
Monitor Impressions Over Time
Keeping an eye on historical Impressions reveals patterns and trends. For example, are there specific days, weeks, or months when served impressions peak? Understand these fluctuations to execute timely campaigns with maximum impact.
Explore Impressions Across Channels
Compare Impressions across digital channels like social media, display ads, and email marketing. Identifying which channels generate the most Impressions to allocate resources effectively.
Assess Impressions Across Campaigns
Evaluate how Impressions vary across platform-specific campaigns. Consider which campaigns are driving higher Impressions and why. Use this to replicate successful strategies per platform and strengthen overall online presence.
Put Impressions in Context
Use annotations on a marketing dashboard or create a comprehensive report summary to explain how Impressions fit into the bigger picture, for example, how they influence metrics like CTR, conversion rate, and ROI.
Visualize Impressions Performance
A picture is worth a thousand words. Use appropriate data visualization, like pie charts and bar graphs, for example, to illustrate changes in Impression growth rate over time. Visual data is more digestible and memorable, making reports more engaging than numbers alone.
Align With Client Goals
Whether it's brand awareness, lead generation, or sales, explain how Impressions are propelling clients toward success. Linking Impressions to specific OKRs or KPIs sets the stage for meaningful conversations and aligns with broader business goals.
FAQs About Impressions in Digital Marketing
Still have questions about impressions? Don’t worry—we’ve got you covered.
Impressions refer to the number of times a piece of content like an ad or social media post is displayed on a screen. This metric indicates potential visibility and brand exposure, showing how often content is being served, regardless of clicks or user interaction.
Impressions count every instance content is shown, including multiple views by the same person. Reach, on the other hand, measures the number of unique users who saw the content. High impressions with lower reach usually mean content is repeatedly shown to the same audience.
Brand awareness starts with visibility. Impressions show how often a message appears in front of an audience, helping marketers evaluate how well their campaigns are increasing recognition. They're essential for measuring exposure at the top of the funnel.
No. A high impression count means the content is seen, but it doesn’t reflect engagement or conversion. Without clicks, interactions, or follow-through, impressions alone don’t indicate performance. They must be paired with actionable metrics to assess real impact.
Impressions should be viewed in context with CTR, engagement rate, and conversions. For example, high impressions and low clicks may suggest weak messaging or poor targeting. Pairing impressions with performance data gives a clearer picture of campaign effectiveness.
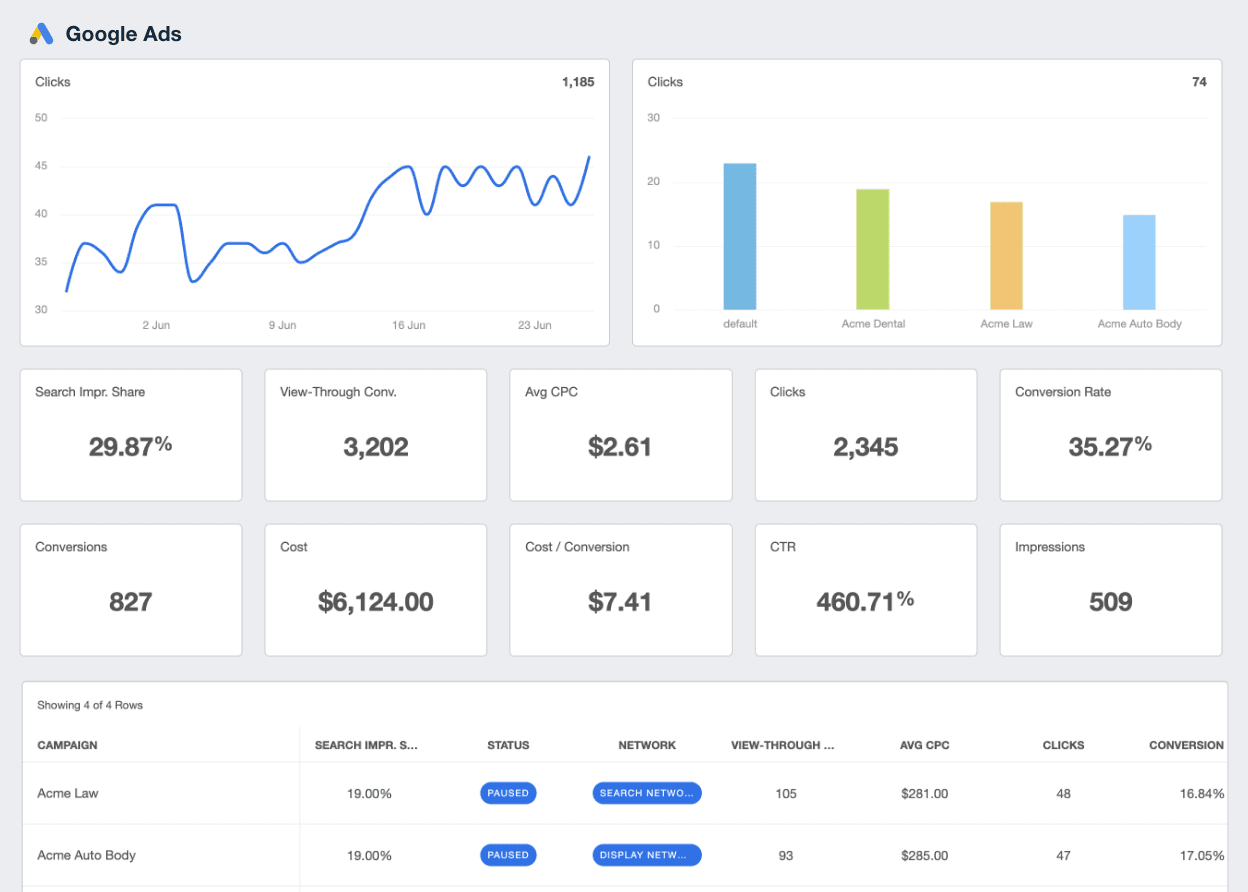
Google Ads Dashboard Example
Related Integrations
How To Drive More Impressions
Looking to increase the visibility of online campaigns? Impressions serve as a critical barometer for how often ads or content is viewed. Here are a few actionable tips to help pump up those numbers.
Focus On Relevant Content
Define a target audience and create high-quality, valuable content that addresses consumer's needs, pain points, and interests.
Optimize Content for Reach
Use demographic targeting where applicable and infuse user-relevant keywords, hashtags, and captions.
Optimize Bid Strategies
Evaluate performance metrics regularly and adjust bidding to favor higher-performing ads. This maximizes the budget and increases the frequency with which ads are shown.
Related Blog Posts
See how 7,000+ marketing agencies help clients win
Free 14-day trial. No credit card required.


