Table of Contents
QUICK SUMMARY:
Data visualization tools are used to simplify complex data, highlight performance trends, and present insights in an easy-to-understand format. Because they’re all built to cater to different needs, choosing the right platform depends on your agency’s workflow, client volume, and data requirements. This article explores 11 top options, including paid and free data visualization tools. It also covers specific use cases and pricing, along with the advantages of using an all-in-one reporting solution like AgencyAnalytics.
Running campaigns is one thing. Sharing clear, digestible results is another.
Making sense of the numbers could feel like its own full-time job, especially when you’re juggling multiple deliverables, managing different data sources, and meeting tight deadlines. Still, turning raw data into actionable takeaways is a key part of the job. After all, it’s what drives smarter decisions, strengthens client trust, and proves your agency’s value. And let’s be honest—rows of disconnected numbers won’t do that on their own.
That’s why a reliable data visualization tool is non-negotiable. It’s used to simplify complex results, create a compelling data narrative, and present performance in a way that actually lands. To help you find the right fit, we’ve compiled a list of 11 marketing data visualization tools, including both free and advanced options. We’ll break down the details of each platform, highlight agency-specific use cases, and share standout features. That way, you’ll be better equipped to choose the one that fits your workflow, client needs, and reporting style.
What Is Data Visualization?
Data visualization tools are software platforms for taking raw, fragmented data and turning it into visual formats like charts, graphs, and dashboards. They’re built to simplify large datasets, surface trends, and present performance in a way that’s easy to interpret.
Agencies use these tools to centralize data across multiple platforms, create dynamic reports, and present impactful findings. For clients, it offers a clear view of progress without having to sift through dense datasets or arbitrary numbers. See which marketing agency tools integrate tightly with visualization workflows.
Why Use Data Visualization Tools?
As your client roster grows, reporting gets more complex–it’s just a given. In these scenarios, many teams end up jumping between platforms, stitching together numbers, or relying on subpar tools that don’t quite do the job. This spirals into chaos, resulting in inaccuracies, missed deadlines, or worse… compromised client trust. The right data visualization tool is a fix to these woes. It’s used to:
Automatically Retrieve Data: These tools pull metrics directly from connected platforms and create visual reports without excessive manual effort. This saves time, ensuring that data is accurate and reflects real-time performance.
Make Sense of Complex Datasets: Rather than presenting raw numbers, use visual formats that make data easier to understand at a glance. These tools help highlight patterns, simplify comparisons, and offer a wide range of visualization types. This may include pie charts, scatter plots, heat maps, line graphs, and geographic maps.
Analyze Trends Over Time: Use a visualization tool to view week-over-week or month-over-month performance. Monitor historical data, identify campaign wins, pinpoint underperforming channels, and make adjustments when needed.
Here’s the thing, though—data visualization platforms aren’t built the same. Some freeze under the weight of large datasets, lack key integrations, or require far too much manual effort to be sustainable.
It underscores the importance of choosing the right tool–one that’s built to handle high data volumes, cross-channel complexity, and evolving client needs.
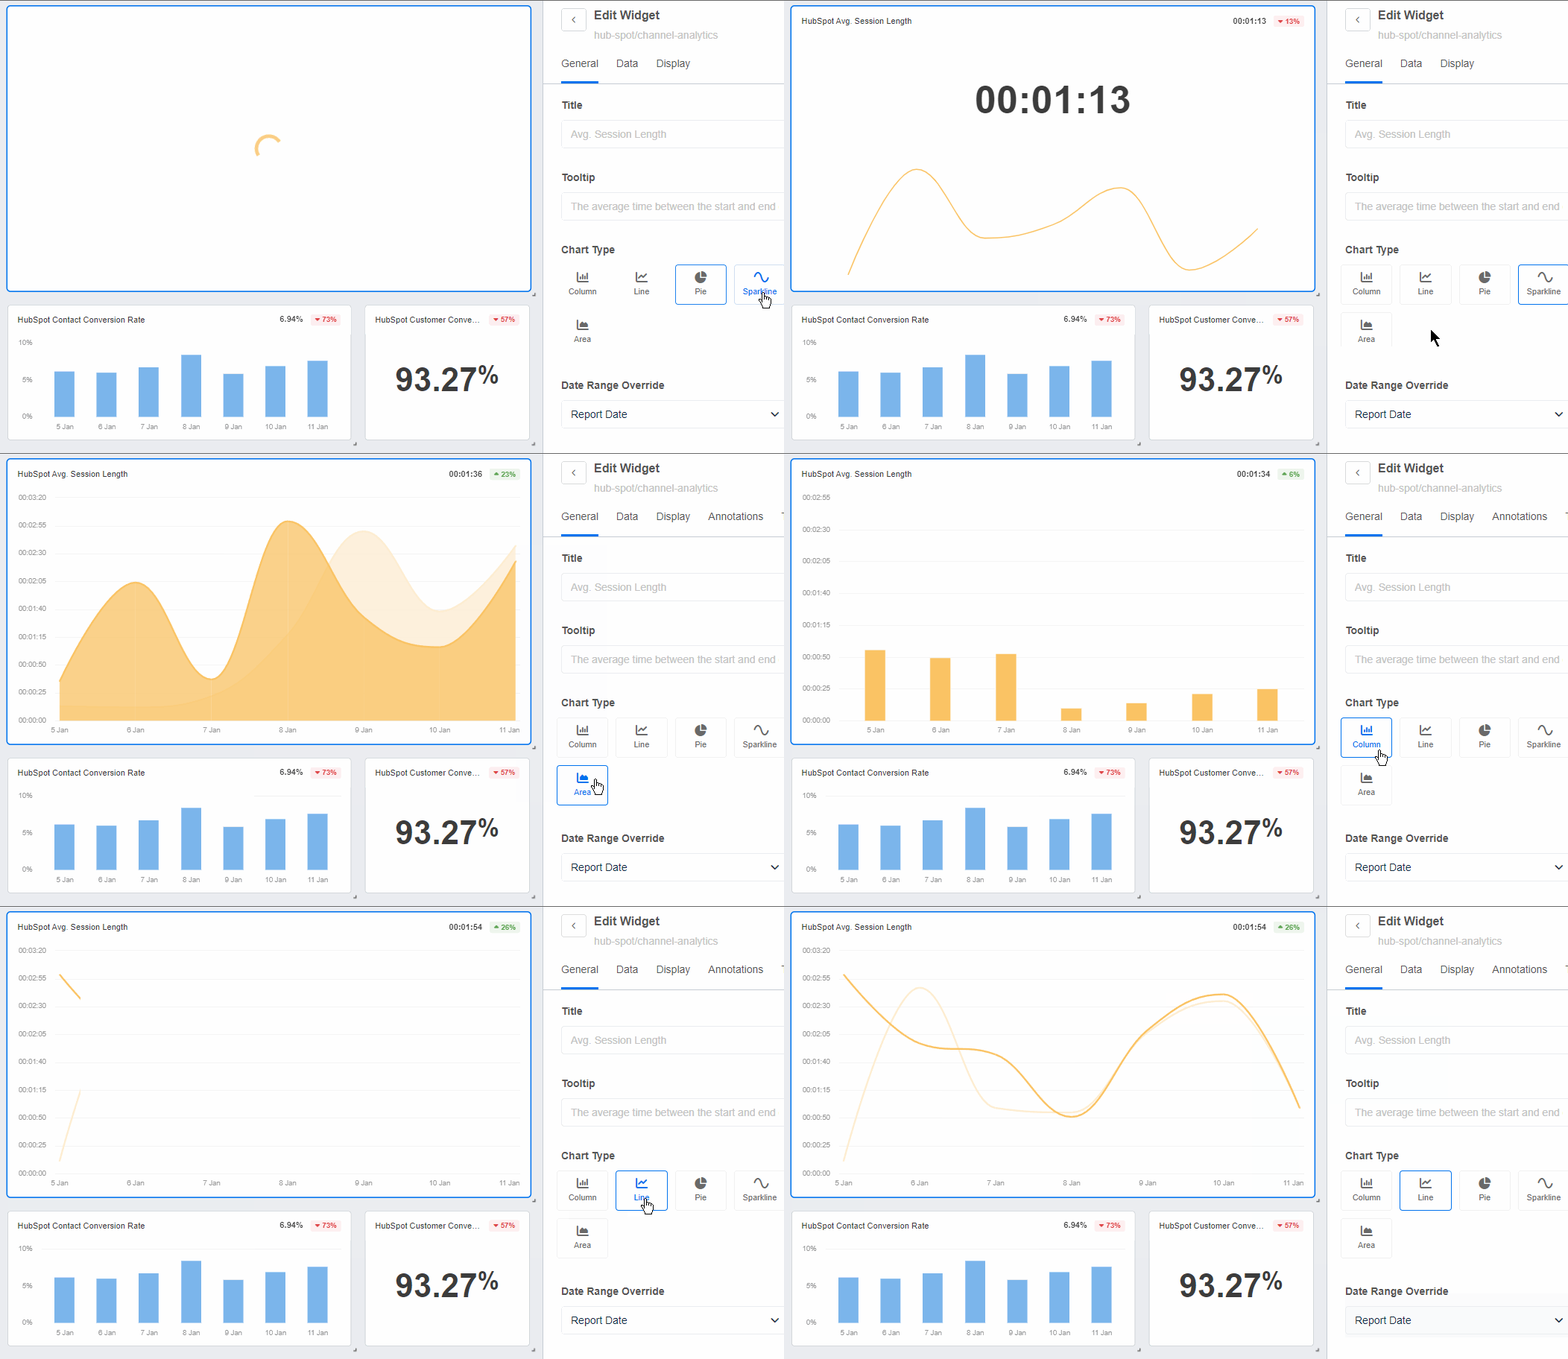
Integrate data across 80+ platforms, explore data visualizations that tell a story, and show clients the bigger picture. Invest in a reporting system that doesn’t freeze or glitch as data volumes increase. Try AgencyAnalytics, free for 14 days.
11 Must-Have Marketing Data Visualization Tools
Choosing the right data visualization tool isn’t always straightforward, especially with so many options on the table. To make the search easier, here’s a curated list of free and paid options, each offering a unique blend of automation, customization, and reporting features. Let’s dive in.
1. ChartBlocks
ChartBlocks is a browser-based tool for building custom charts without any coding. It allows users to import data, choose from a variety of chart types, and export visuals in multiple formats.
Because of its simplicity, ChartBlocks is a good option for agencies that need quick, standalone visuals, especially for smaller reports or one-off presentations.
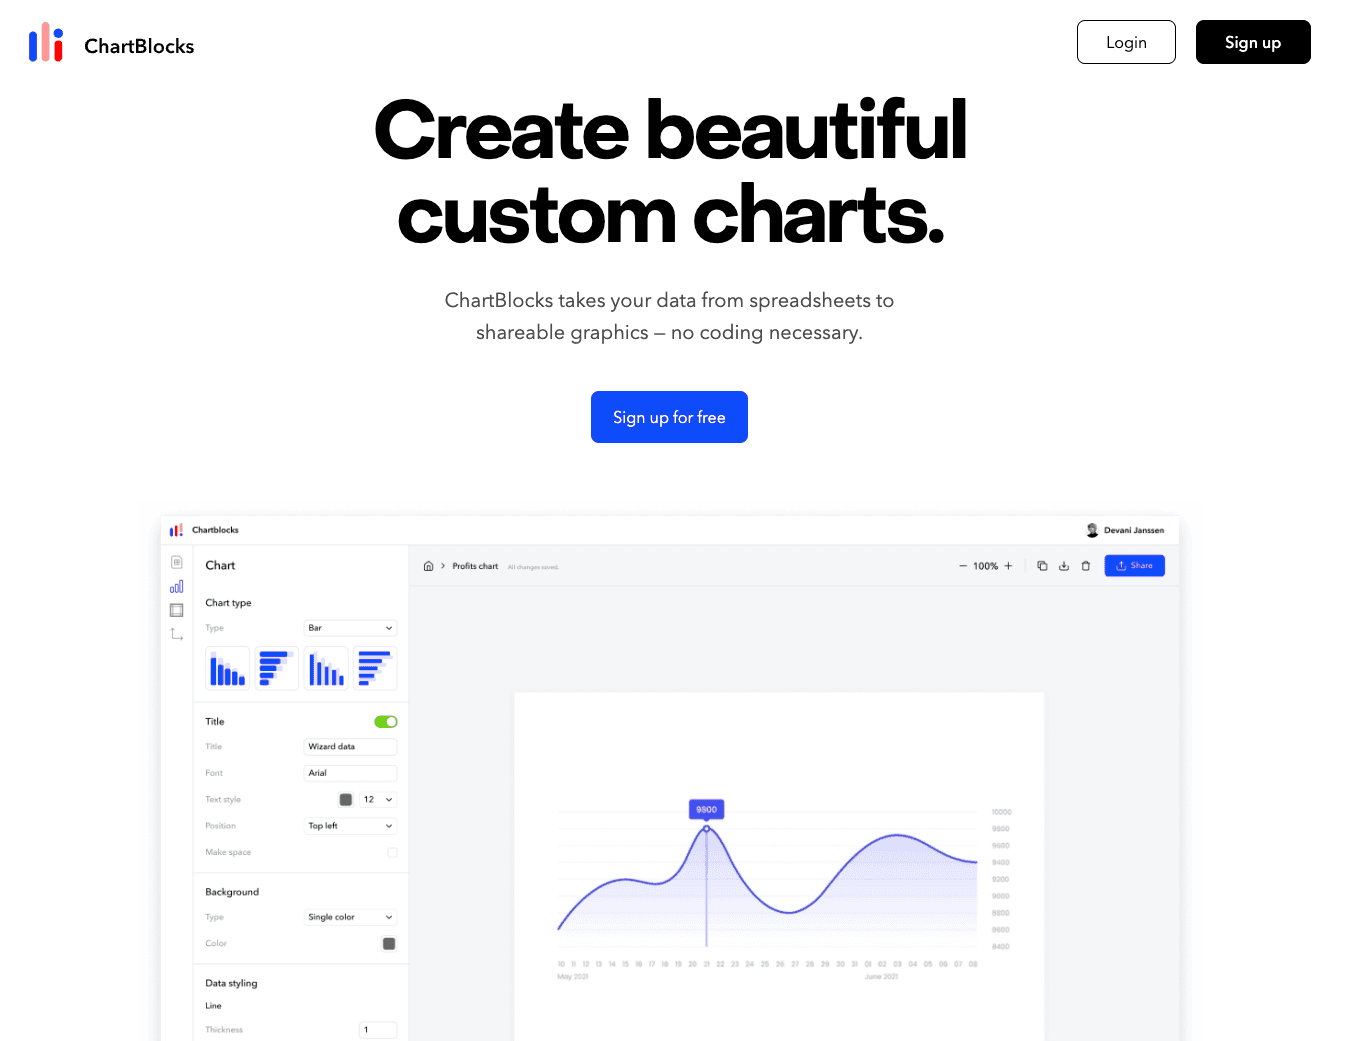
Key Features:
Flexible Data Import: Upload data from spreadsheets and databases. Alternatively, input it manually for quick chart creation.
Customizable Chart Design: Adjust colors, labels, axes, and layouts across various types of visualizations.
Multiple Export Options: Download charts as PNG, SVG, or PDF files. Choose the visual representation that works best (e.g., line charts, area charts, or another format).
A free plan is available with core features, while tiered pricing starts at $8/month. Higher plans include increased chart limits, branding customization, and advanced data security options.
2. Google Charts
Google Charts is a free, developer-focused tool for building interactive, browser-based charts using HTML and JavaScript. It’s lightweight and flexible, making it a great option for agencies that want to build straightforward visuals.
It’s especially useful if your clients need very specific charts, like custom time comparisons or regional breakdowns.
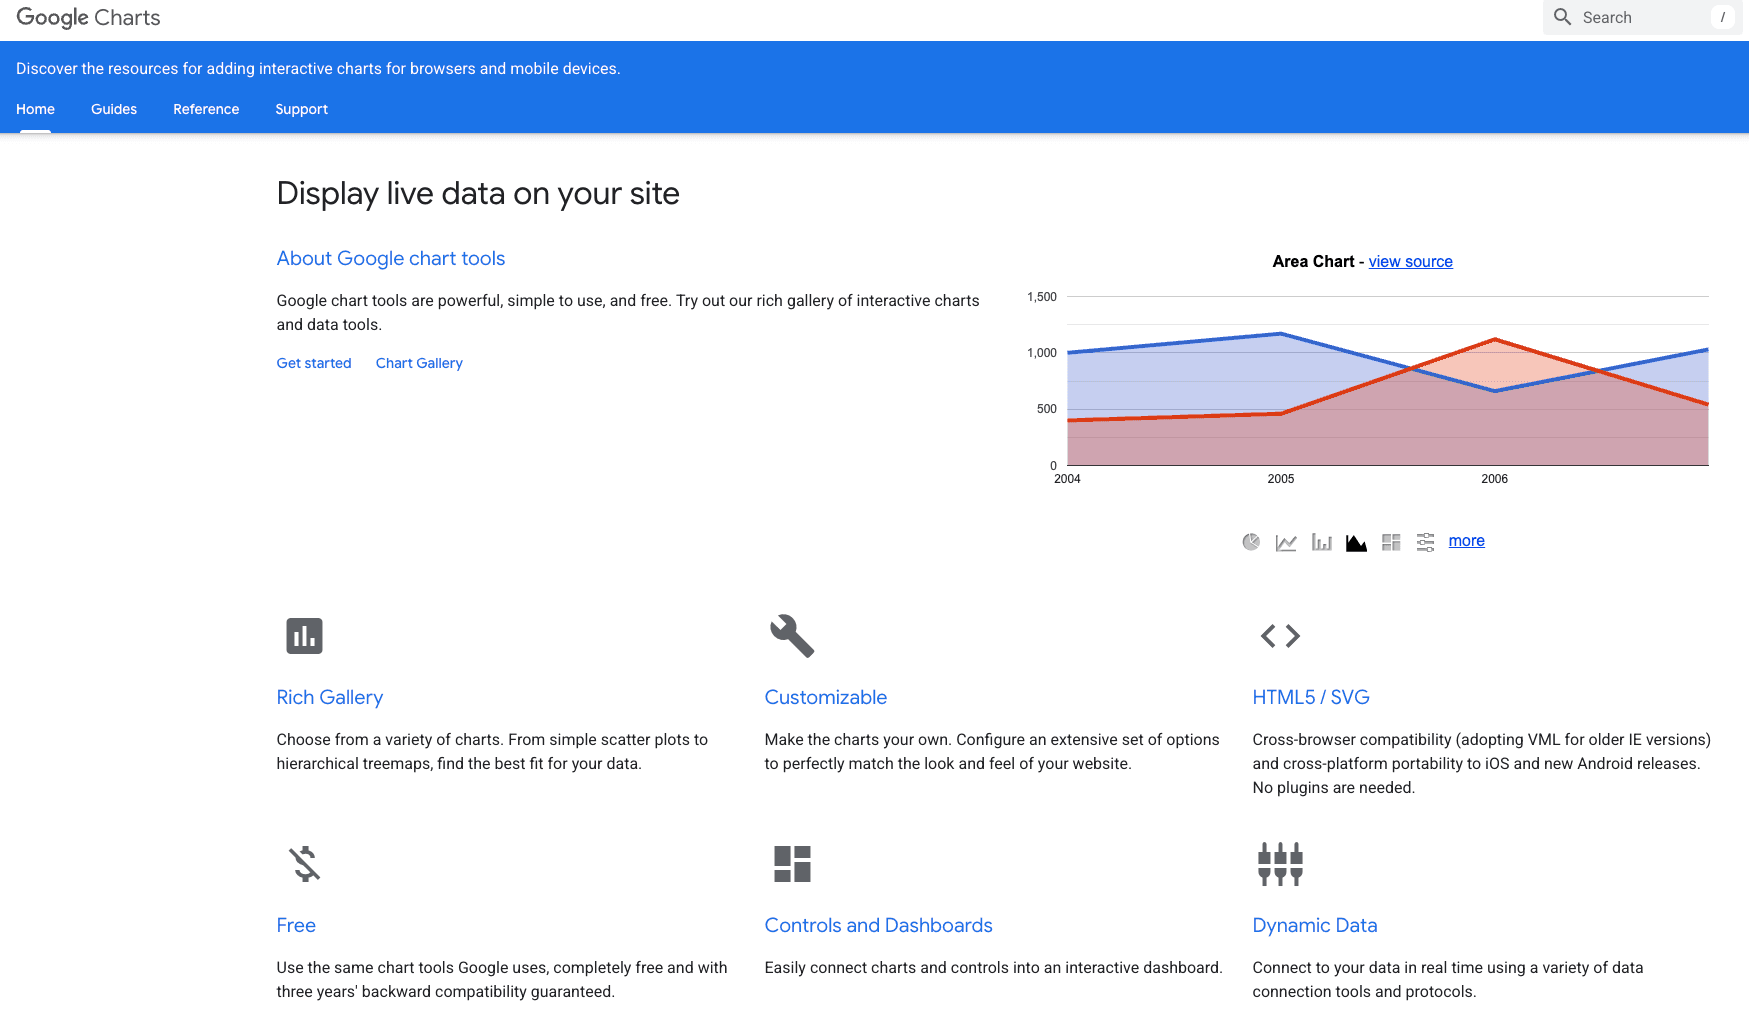
Key Features:
Interactive Visualizations: Build live, clickable charts that update with new data, which is great for showcasing ongoing performance.
Diverse Chart Options: From basic bar graphs to geographic maps, Google Charts offers a broad range of visualization types.
Seamless Integration: This platform works well with Google Sheets, BigQuery, and other database sources.
Google Charts is free to use, with no licensing or subscription fees.
3. Looker Studio
Looker Studio is a free dashboard and reporting tool from Google that streams data into interactive, visual reports. It supports live data connections and customizable layouts, making it useful for building data-driven dashboards.
Agencies managing a handful of clients across Google platforms may find Looker Studio a practical entry point.
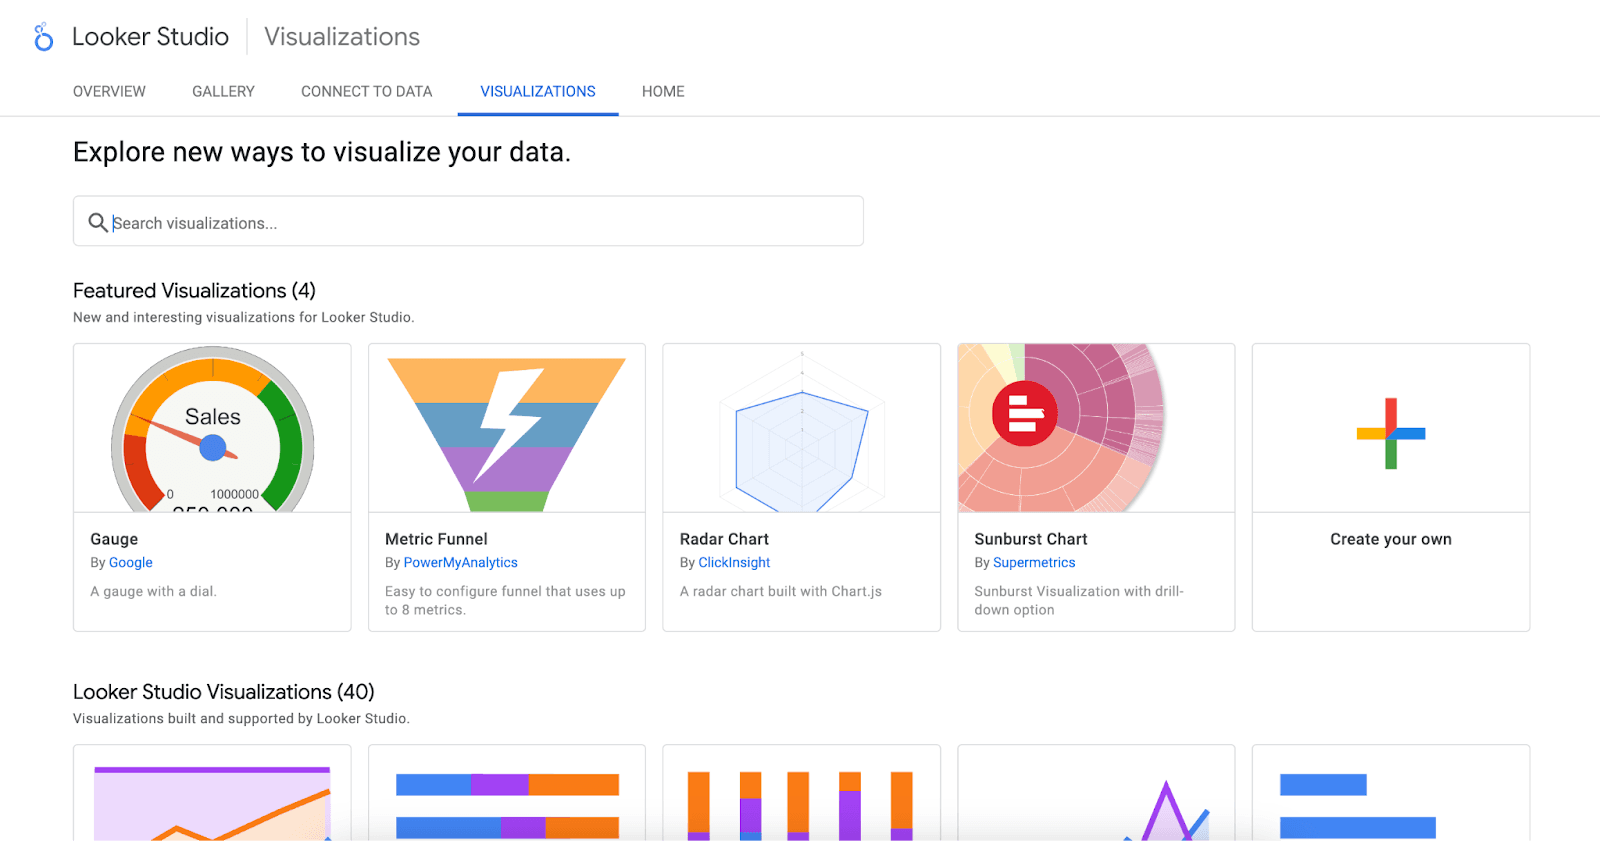
Key Features:
Live Google Integrations: Connect seamlessly to platforms in the Google ecosystem, like Google Ads, GA4, and GSC.
Custom Dashboard Design: Use a drag-and-drop editor to adjust graphical representation as needed.
Customizable Styling: Tailor chart colors, fonts, labels, and animations to match branding.
Looker Studio is free to use. For more advanced features (like team collaboration and dedicated customer support), Looker Studio Pro is available with enterprise pricing.

4. Infogram
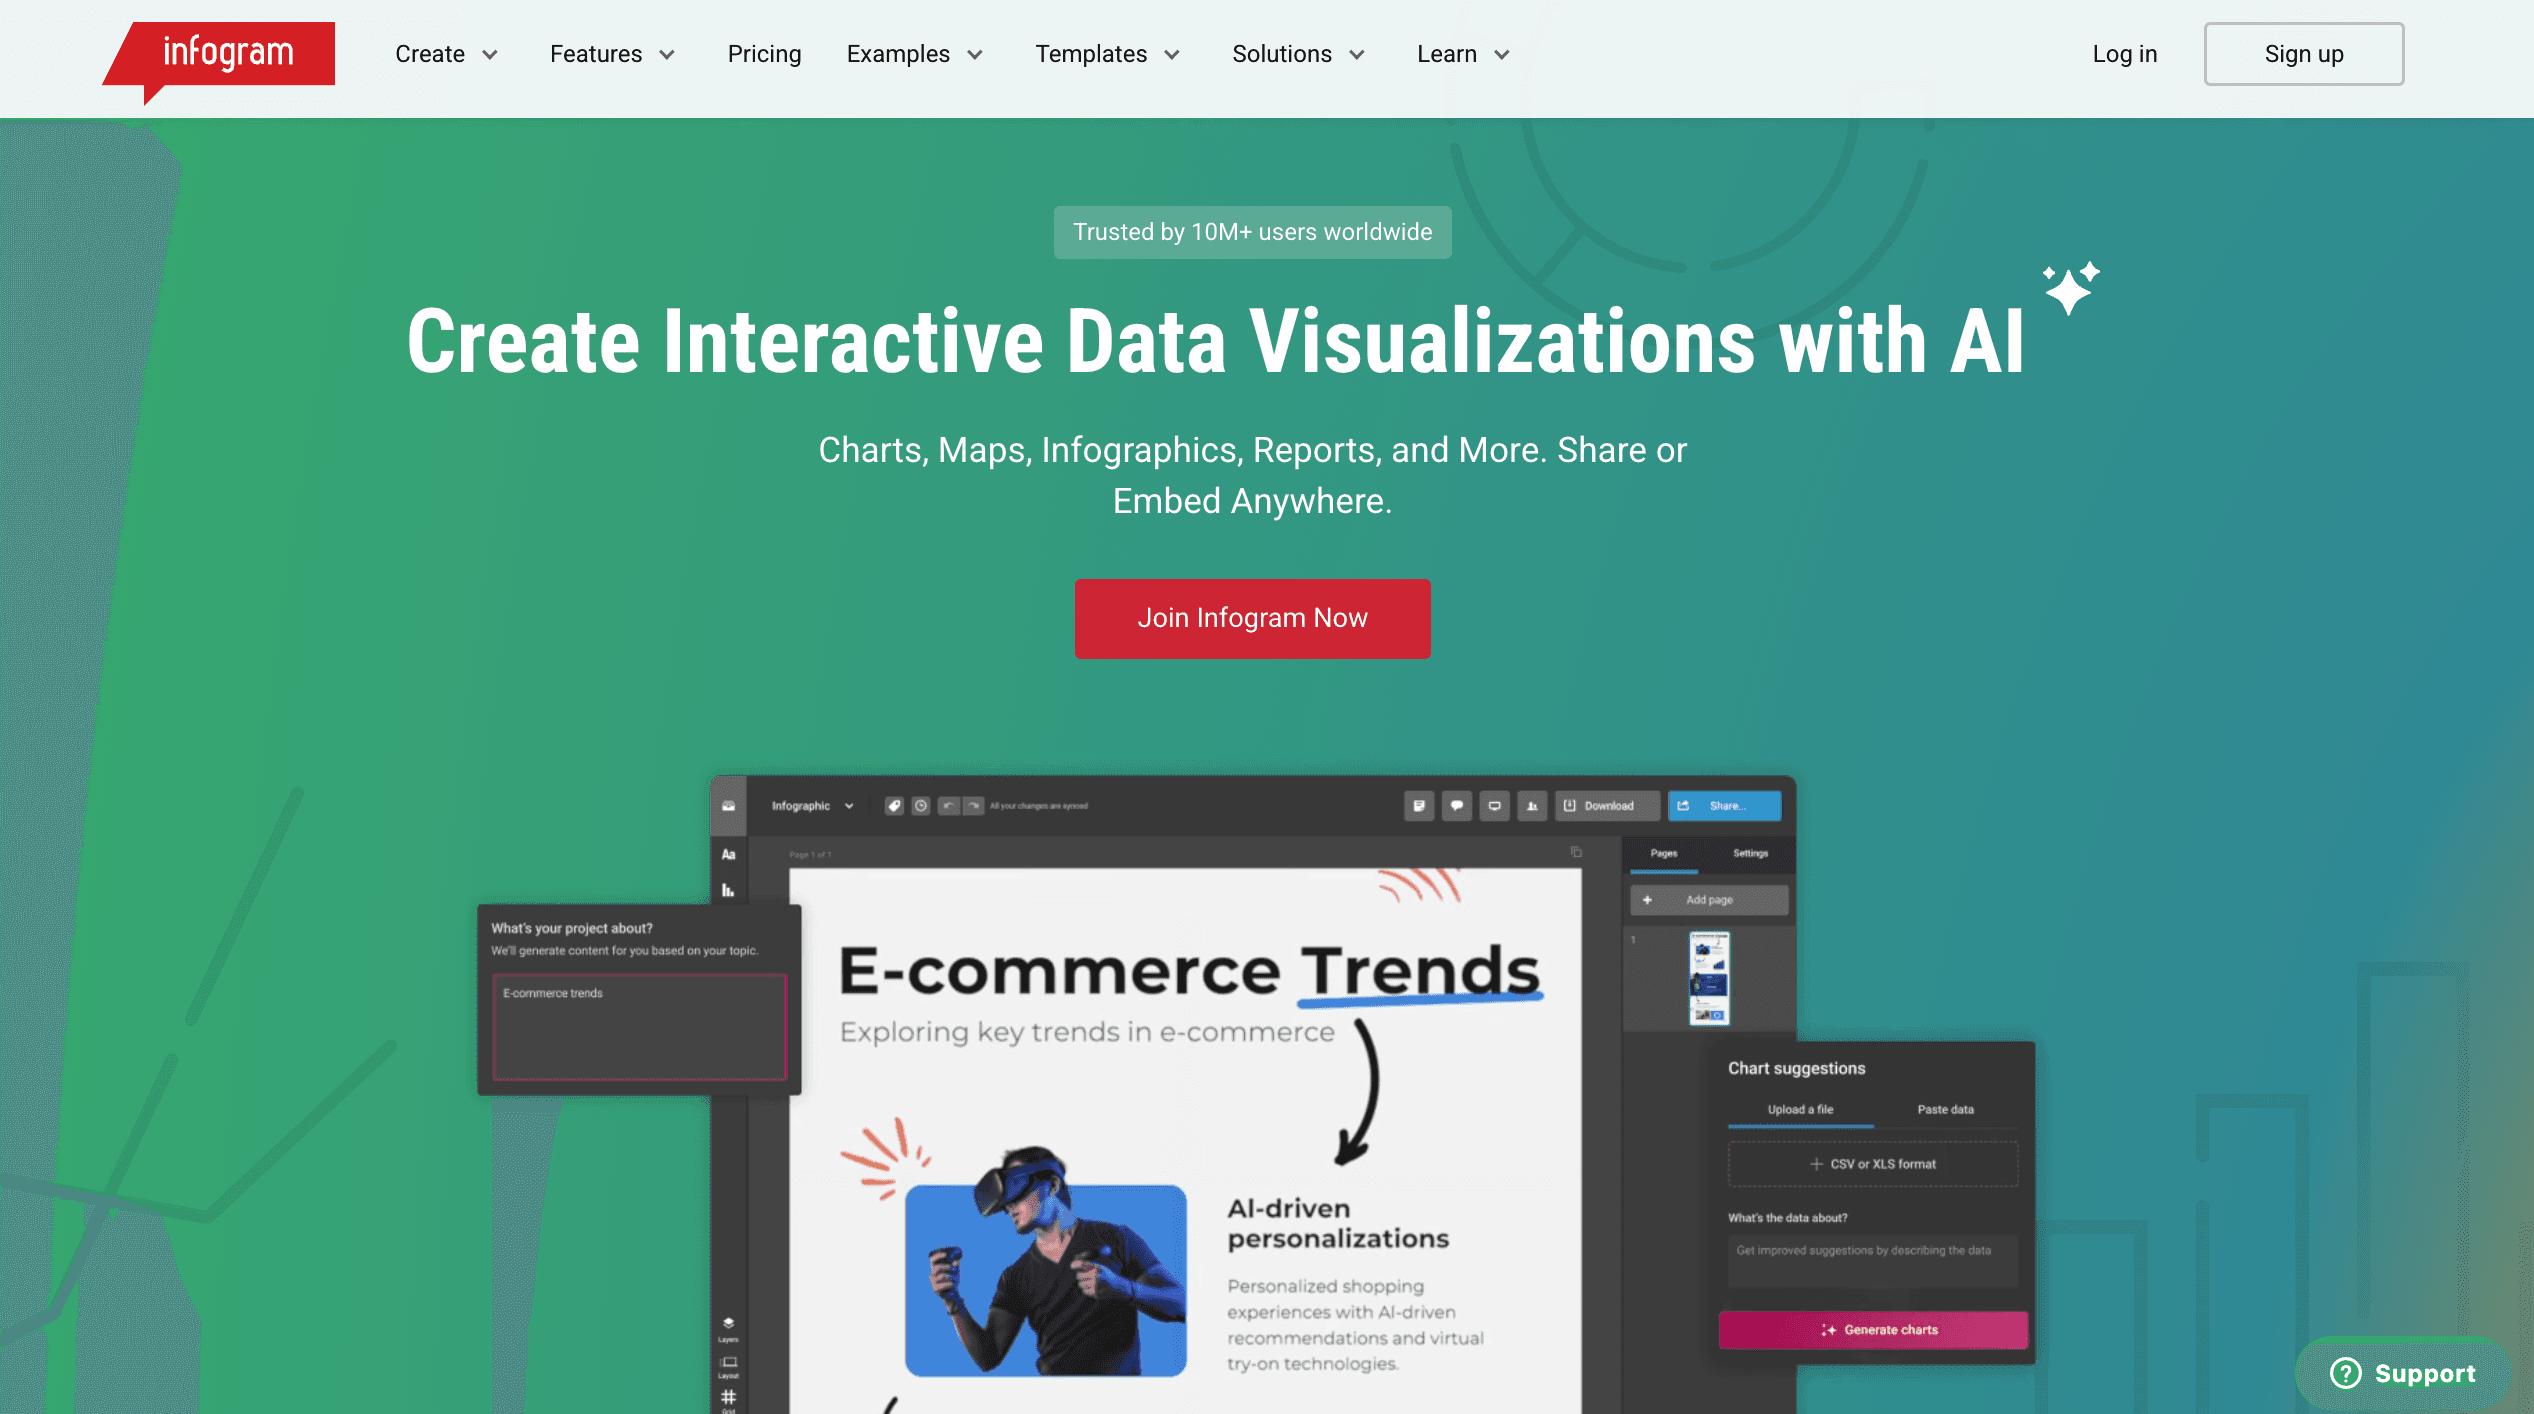
Infogram is a web-based, drag-and-drop tool for creating interactive charts, infographics, and dashboards. It offers a wide range of templates, making it a quick way to turn datasets into presentation-ready visuals.
Agencies that produce a lot of visual content—like social media performance summaries or client presentations—may find this platform useful.
Key Features:
Branded Visuals at Scale: Use custom color palettes, logos, and fonts to keep every report on-brand.
Interactive Charts & Maps: Choose from a range of visualizations, which come with clickable elements and hover effects.
Team Collaboration: Edit, comment, and manage version history across projects with built-in teamwork tools.
Infogram has a free option, with paid plans starting at $19/month. Their Business and Team tiers include additional branding, analytics, and user access.
5. Microsoft Excel
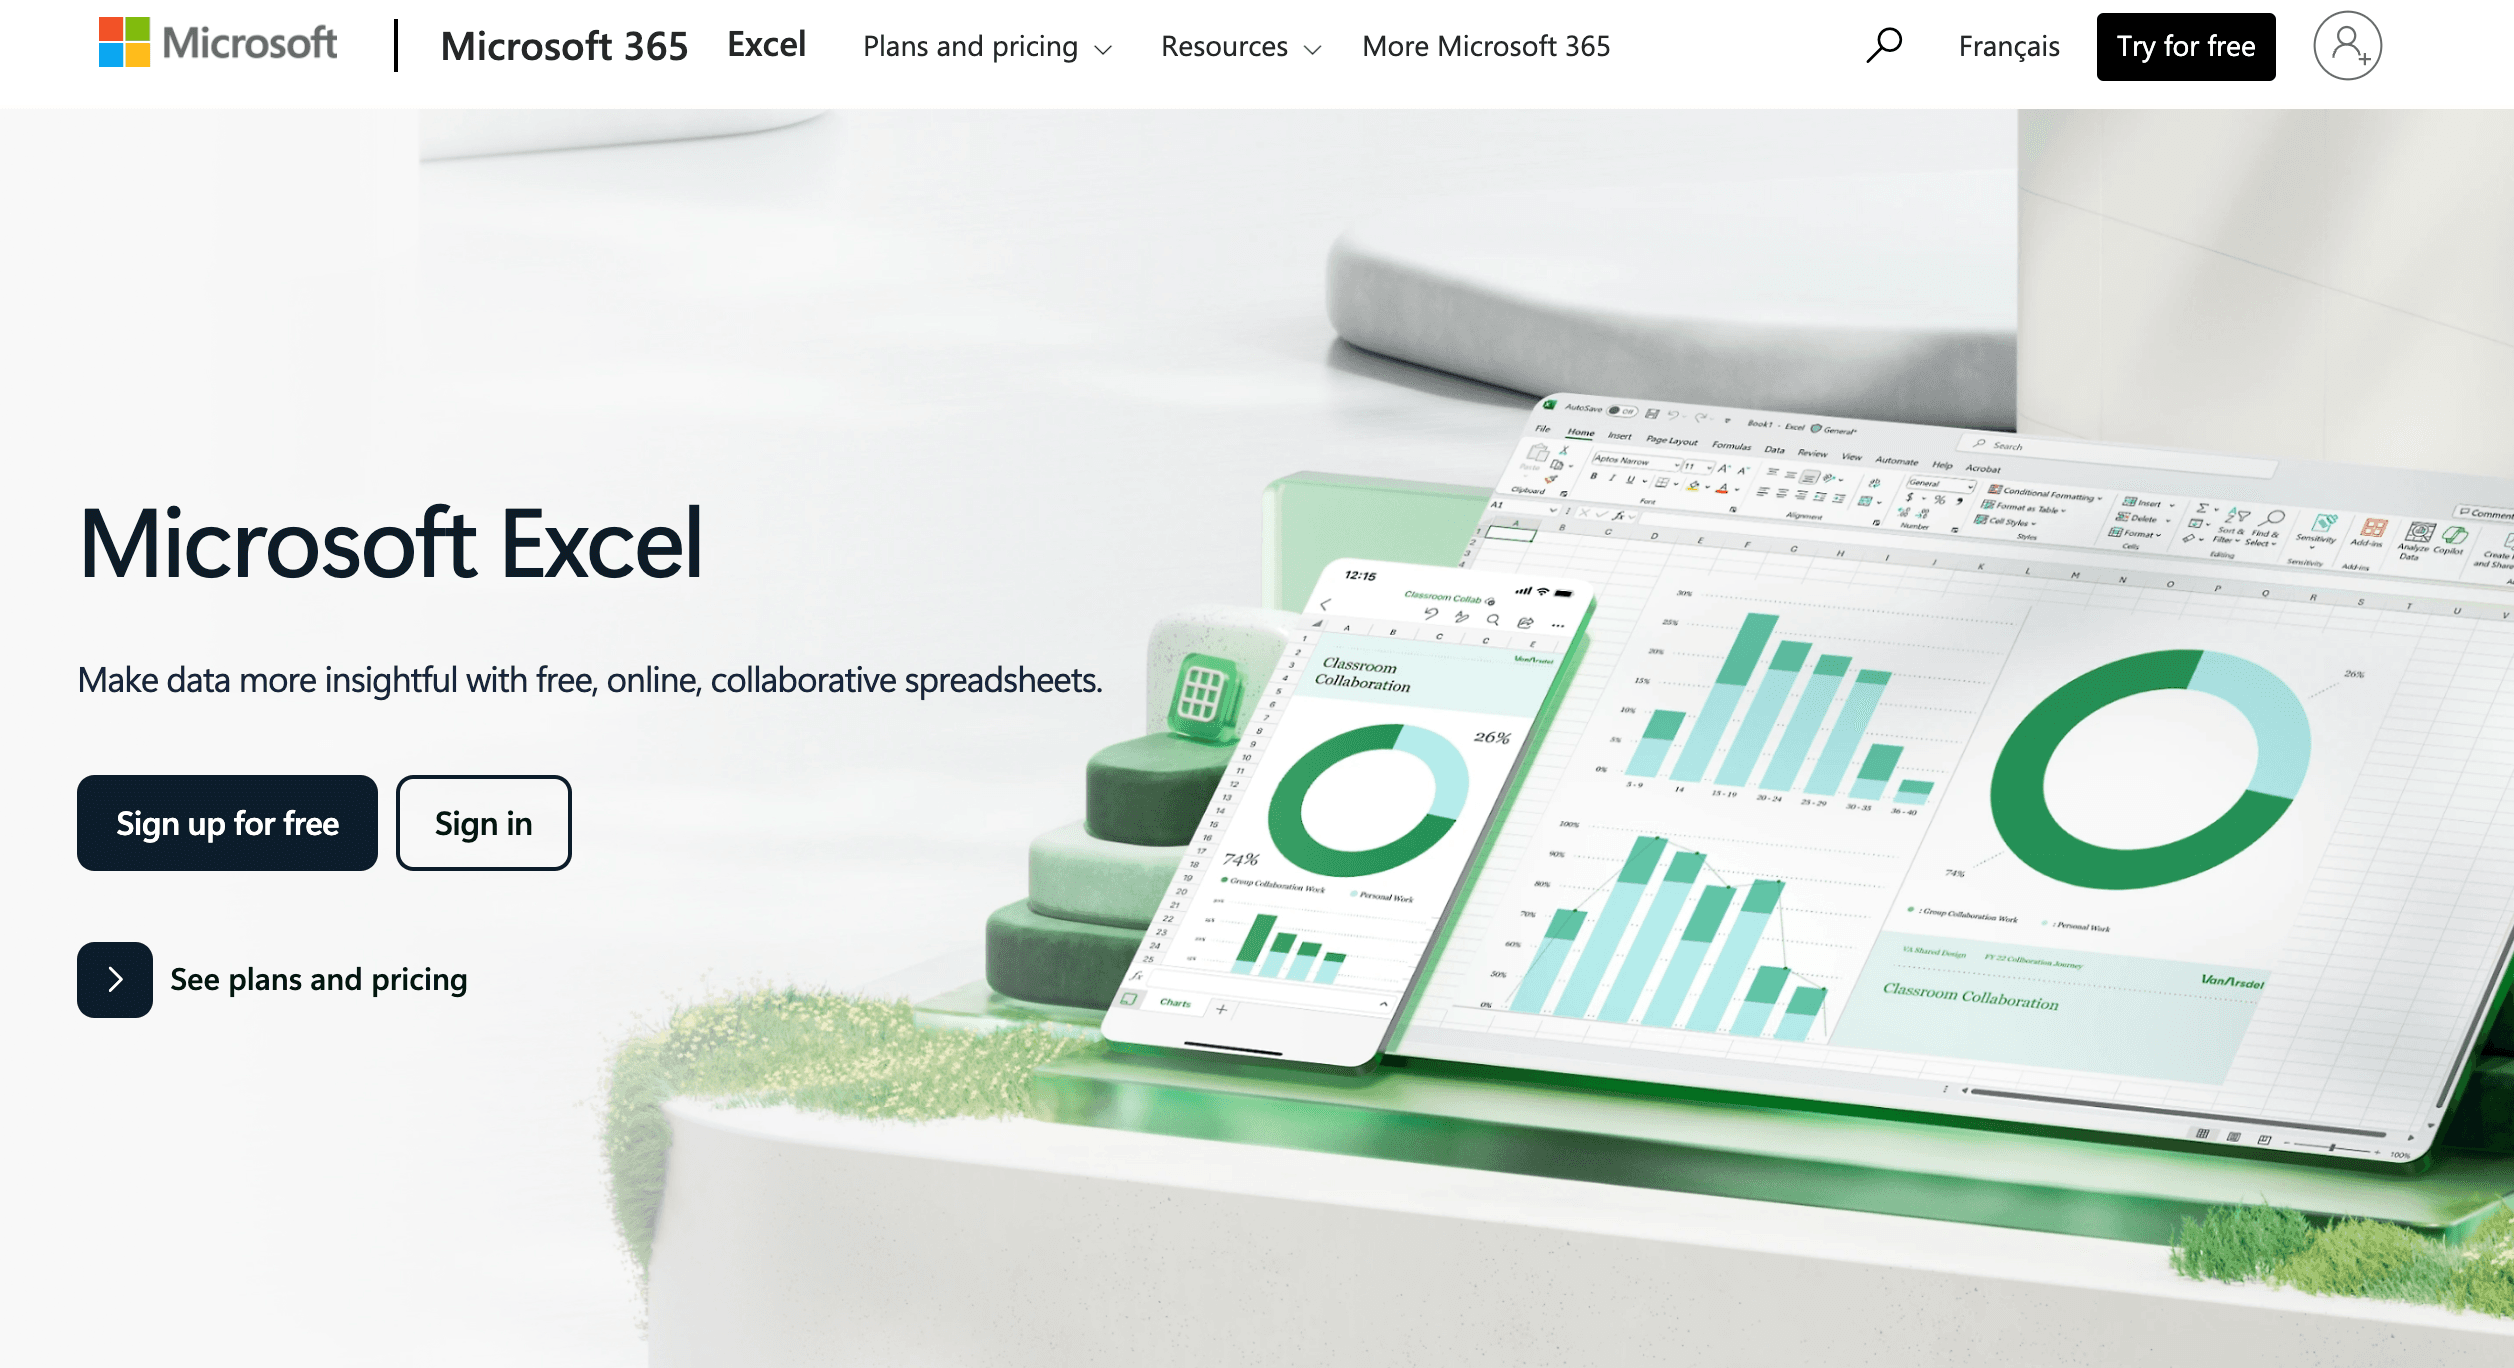
Microsoft Excel is a widely used spreadsheet software that helps teams organize, analyze, and visualize data. While not built specifically for data visualization, its charting tools, pivot tables, and formulas make it a practical option for creating basic performance visuals.
This powerful tool is a practical choice for campaign planning, budget tracking, or related operational tasks.
Key Features:
Custom Charts & Pivot Tables: Easily transform data points into bar charts, line graphs, heatmaps, and other visualizations.
Advanced Formulas & Automation: Use formulas, scripting, and conditional formatting to streamline workflows.
Widespread Compatibility: Easily share reports with clients or stakeholders in XLSX or PDF formats.
Excel is included with Microsoft 365 subscriptions, starting at $8.25/month per user for business plans. It’s also available with a one-off purchase of $159.99 (valid for one device).
6. Tableau
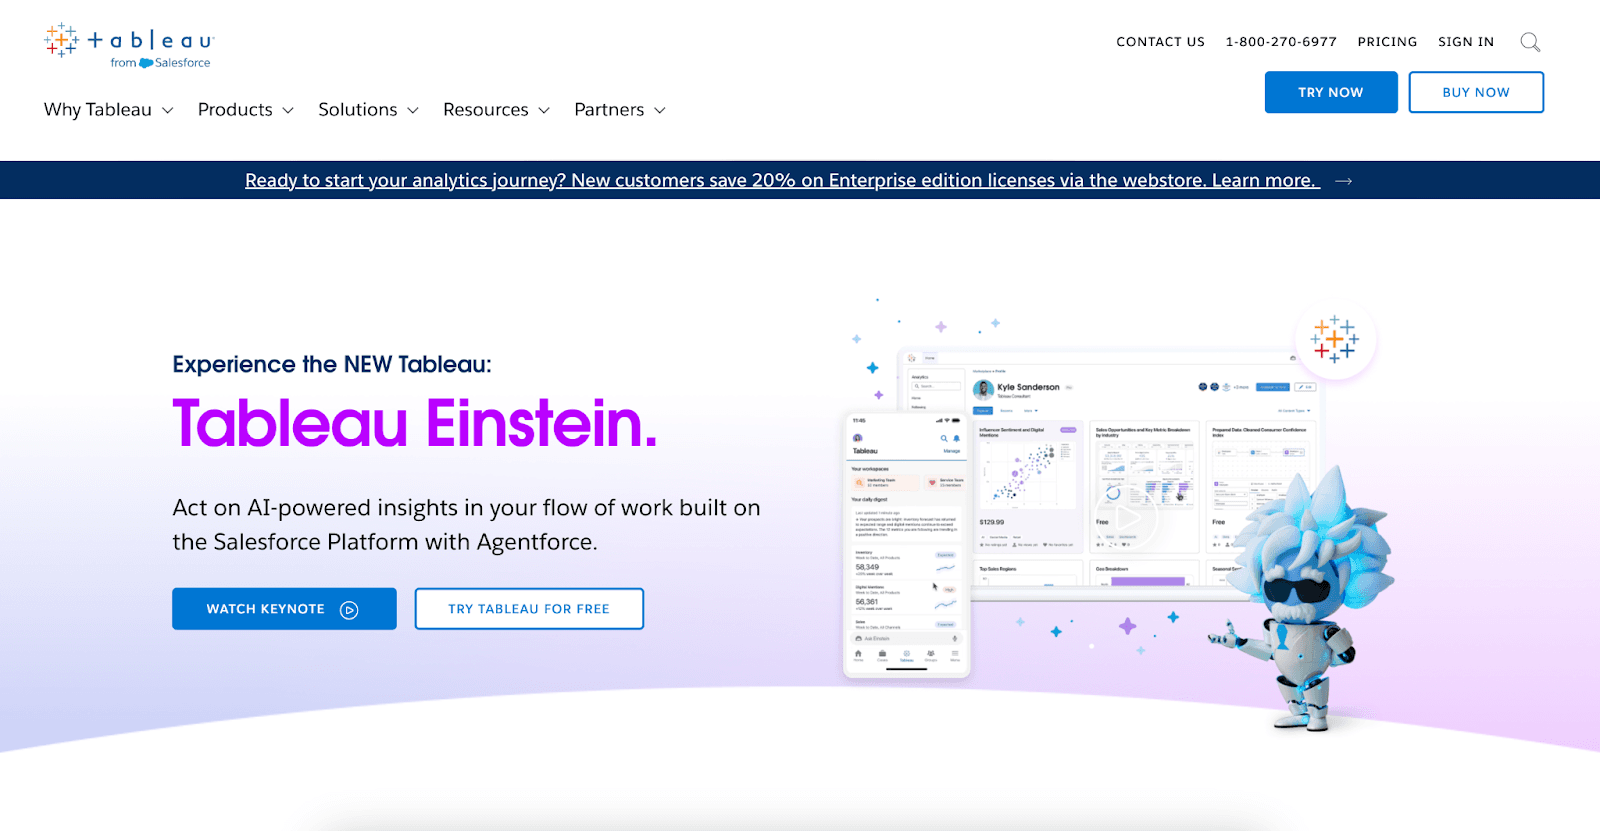
Tableau is a powerful data visualization and business intelligence platform built to handle complex, multi-source datasets. It’s known for its ability to create highly interactive dashboards that are suited for deep analysis.
Because of its advanced data visualization capabilities, it’s a good option for agencies that need custom data models or multi-touch attribution reporting.
Key Features:
Interactive, Real-Time Dashboards: Build dynamic visuals that update automatically with live data connections.
Cross-Platform Integrations: Connect to Google Ads, Facebook, database, spreadsheets, and other tools.
Data Storytelling: Layer in filters, highlights, and tooltips to help clients make sense of complex insights.
Tableau offers an Enterprise Creator version starting from $115/user per month, which includes one license, data management, and access to eLearning. Their premium pricing is available by consultation only.
7. Datawrapper
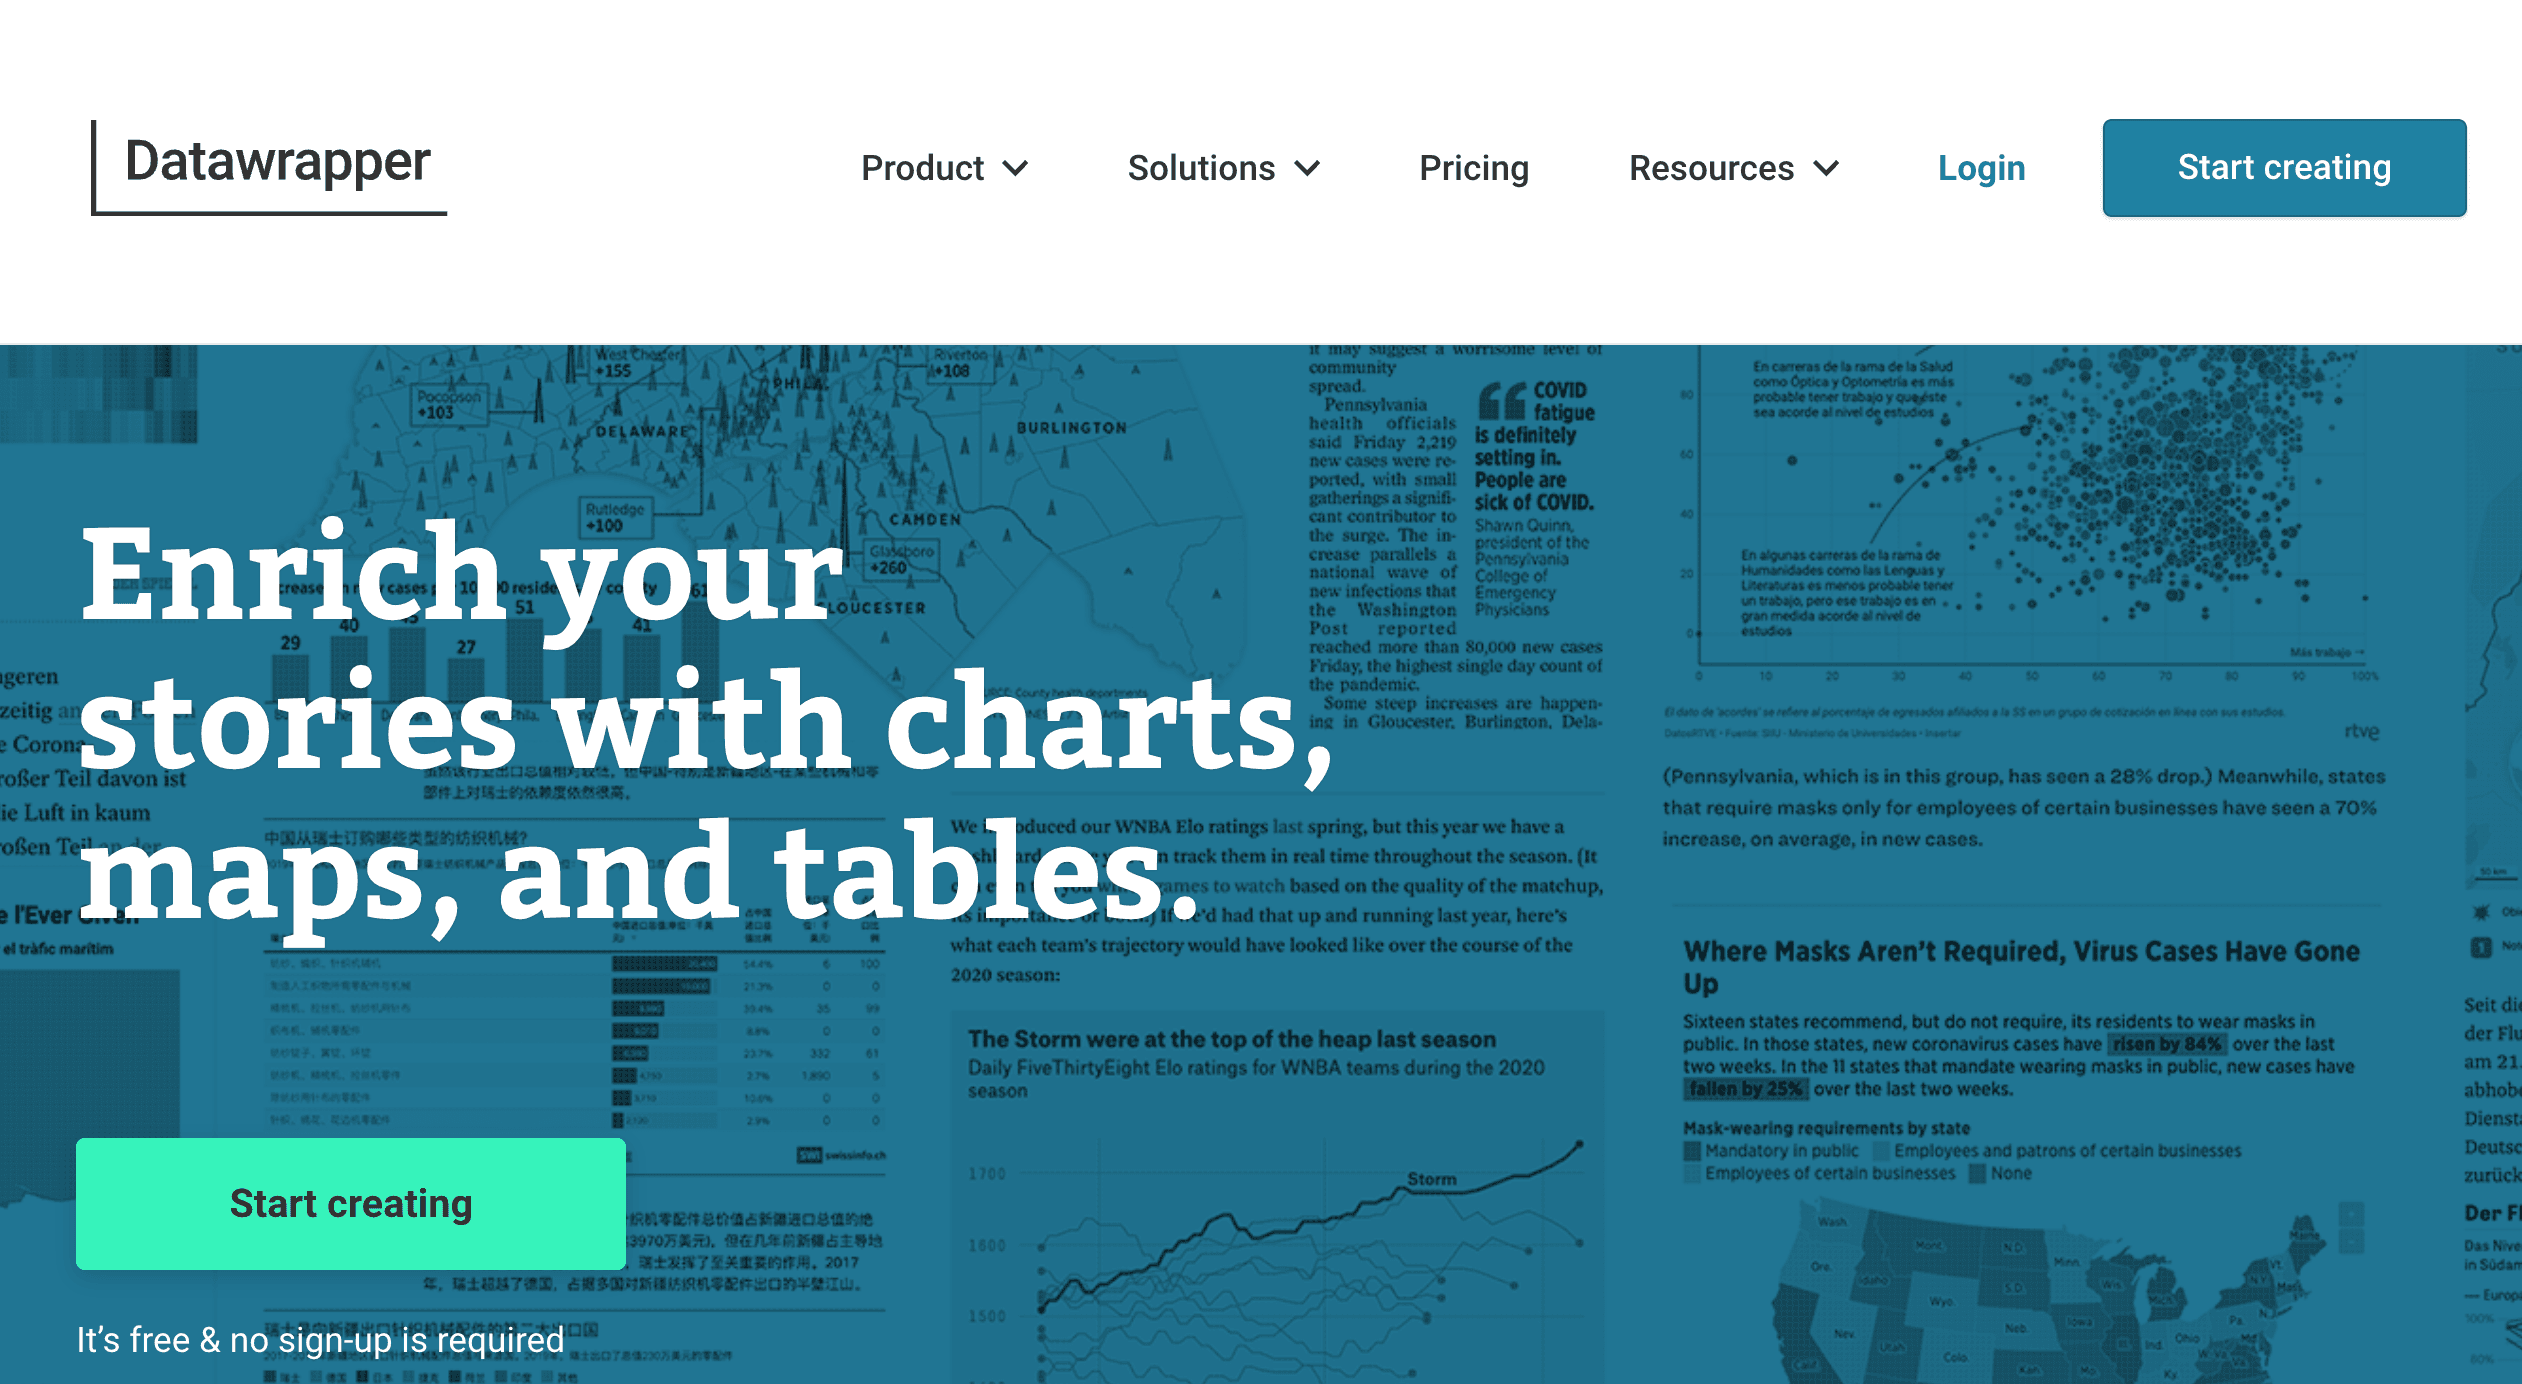
Datawrapper is a no-code data visualization tool for building interactive charts, maps, and tables. This platform focuses on clean design, accessibility, and responsiveness, making it ideal for creating visuals that work well across devices.
Agencies that need to publish sleek, on-brand charts for blogs, press releases, or reports will find value in a tool like Datawrapper.
Key Features:
No-Code Visualizations: Design a variety of charts and maps without any coding, which streamlines the creation process.
Custom Branding: Apply your agency's or client's branding, including colors, fonts, and logos.
Team Collaboration: Utilize shared folders and team features to collaborate more seamlessly on projects.
Datawrapper offers a robust free plan with unlimited chart creation and PNG exports. For advanced features, a Custom plan is available at $599/month.
8. Zoho Analytics
Zoho Analytics is a self-service BI and data analytics platform that helps agencies visualize, analyze, and consolidate multiple data sets. It offers a range of advanced features, including the ability to create data pipelines, access machine learning models, and build custom analytics apps. Therefore, it’s a solid solution for agencies that need to manage complex, multi-source datasets and deliver tailored insights.
Key Features:
Multi-Source Data Blending: Connect data from select platforms, including Microsoft Ads, Facebook, and YouTube.
Custom Dashboards: Easily build interactive dashboards with a drag-and-drop tool in just a few clicks.
Client-Friendly Sharing: Share dashboards securely with clients or embed them in portals with custom access controls.
Zoho Analytics offers a free version with limited features. Paid plans start at $30/month, with higher tiers offering more user profiles and increased data capacity.
9. Ruler Analytics
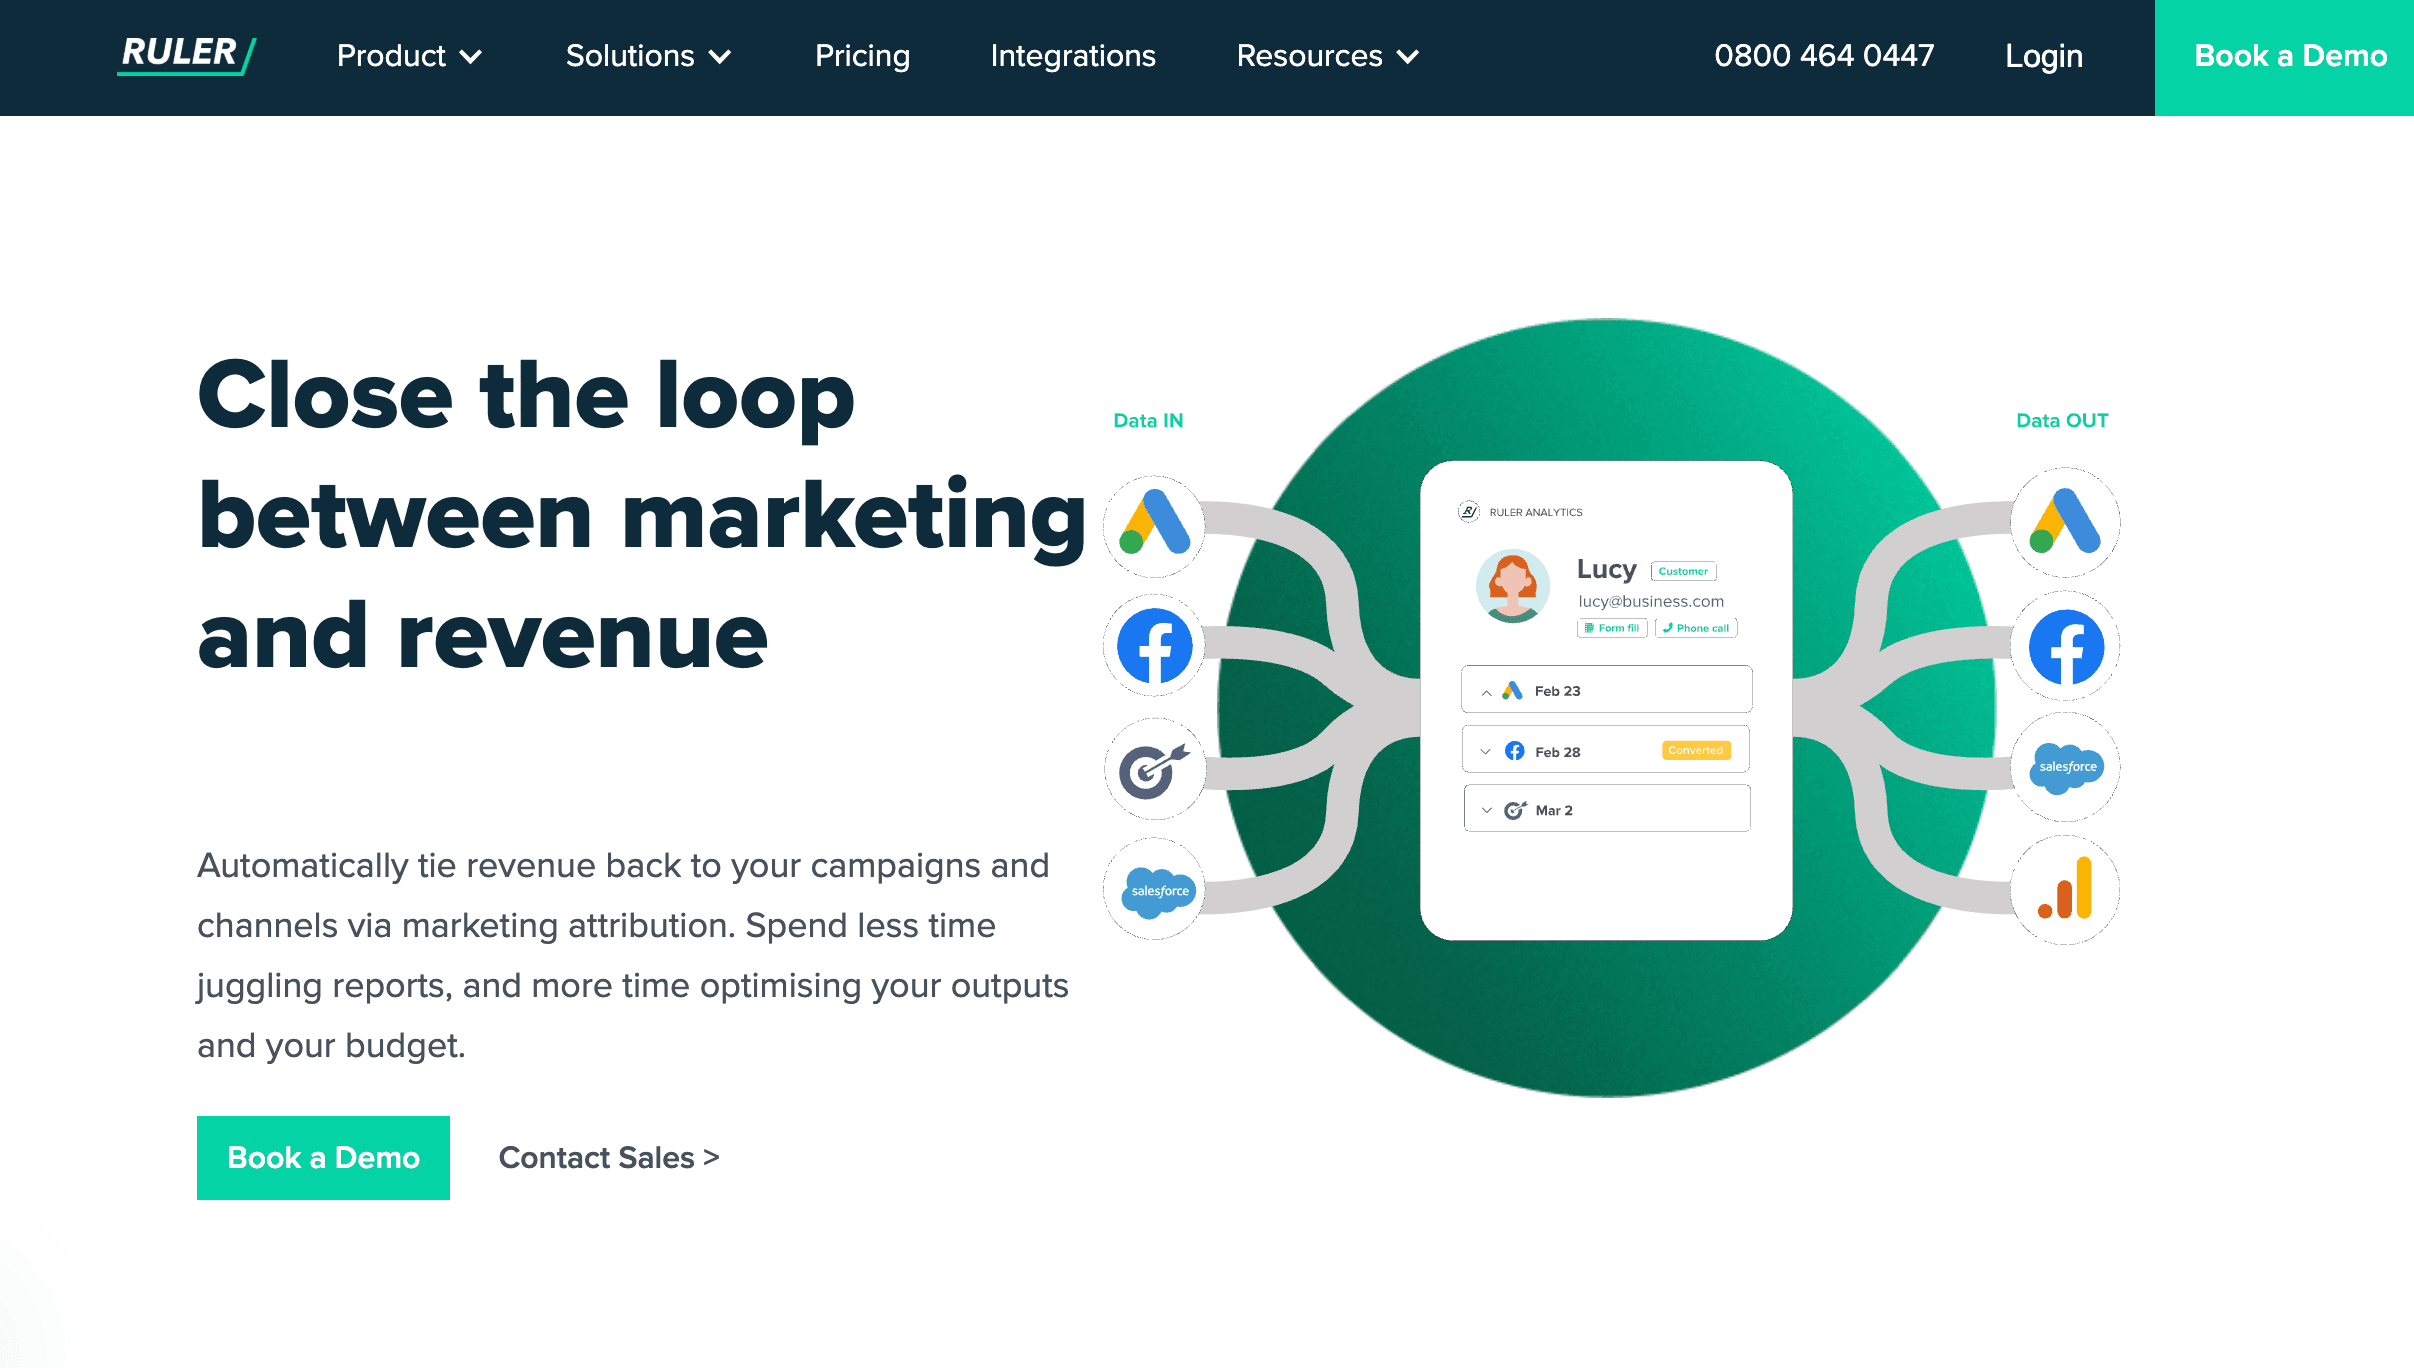
Ruler Analytics is a marketing attribution and call tracking platform that helps agencies link leads and revenue back to specific campaigns. It tracks the entire customer journey across both online and offline channels.
It’s a strong fit if your clients primarily rely on lead generation, phone inquiries, or multi-touch conversion paths.
Key Features:
Multi-Touch Attribution: Track and credit every interaction in the customer journey using first-click, last-click, linear, or time-decay models.
Call and Form Tracking: Capture lead data from phone calls, forms, and live chat across campaigns.
CRM and Ad Platform Integration: Sync revenue and conversion data with tools like HubSpot, Salesforce, and Google Ads.
Plans start at $149/month, based on monthly website traffic. Higher tiers are available for growing teams and enterprise needs.
10. Microsoft Power BI
Microsoft Power BI is a business intelligence and data visualization platform that streams complex data into interactive, real-time dashboards. It’s made for advanced analysis, custom data modeling, and seamless integration with Microsoft products.
It’s best suited for agencies working with large datasets that require granular filtering and enterprise-grade data security.
Key Features:
Centralized Data Modeling: Connect and blend data from spreadsheets, CRMs, ad platforms, and SQL databases.
Interactive Dashboards: Build highly customizable visuals with drilldowns, filters, and time-based comparisons.
Enterprise-Ready Sharing: Create effective visualizations and share them across internal teams or clients.
Power BI offers a free desktop version. Paid plans start at $14/user per month, which includes the ability to publish and collaborate on reports.
11. AgencyAnalytics
AgencyAnalytics is a purpose-built reporting platform designed specifically for marketing agencies. It automates data retrieval, centralizes performance metrics from 80+ integrations, and offers effective data visualization, all under one roof.
It’s an ideal choice for scaling or well-established agencies, especially those that are handling a growing volume of client data. Plus, this platform makes it easy to streamline workflows, monitor real-time performance, and deliver professionally designed reports.
We needed a place where clients could look at stats that are easily digestible. The AgencyAnalytics reporting platform provides great visuals for our clients–they're beautiful and easy to read.
Rachel Jackson, Lead SEO, Wit Digital
Key Features:
Pre-Built Templates: Access an extensive library of replicable, fully customizable reports and dashboards. Move widgets around with a drag-and-drop editor, include custom annotations for context, and schedule reports in advance.
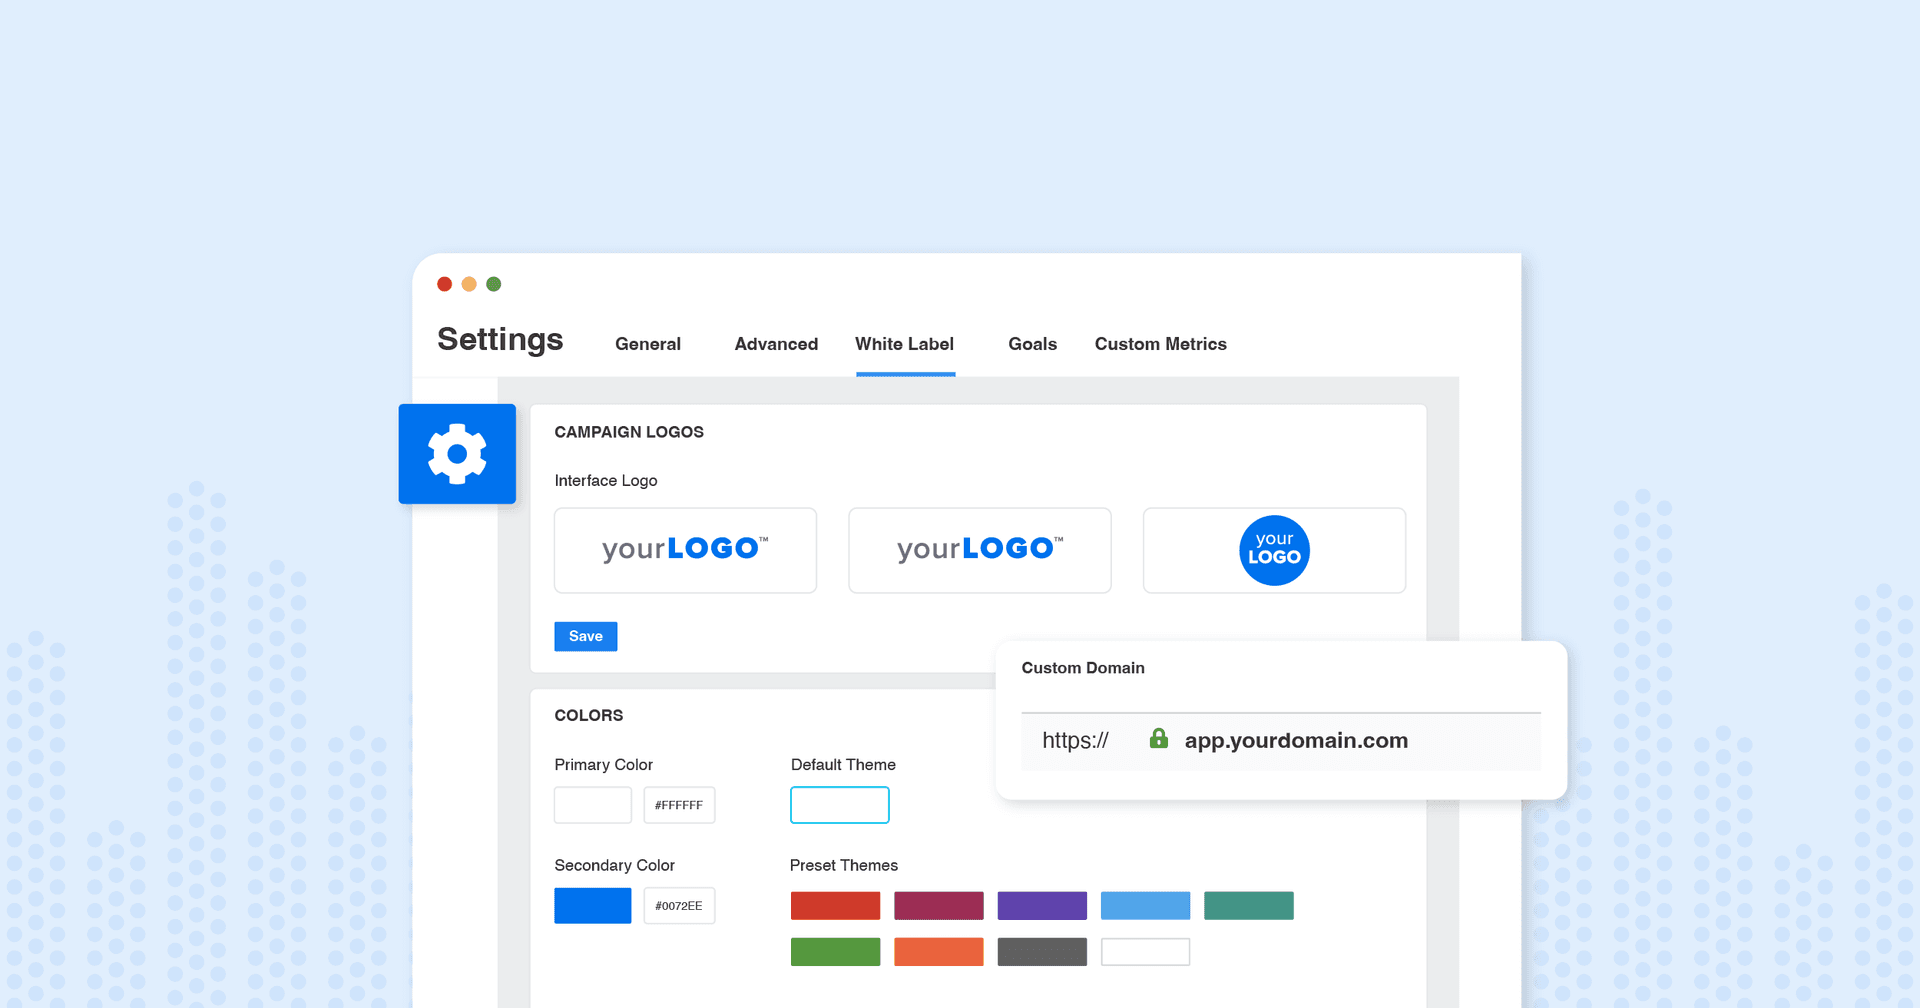
White Label Reporting: Easily infuse your client’s logo and unique brand colors. Create a custom domain with your agency’s branding, which enhances the overall experience when clients log in to the dashboard portal.
Smart Dashboards: In just 11 seconds, generate an auto-populated dashboard with your client’s unique metrics. To create a static format, start with a Smart Report option. Both options are also fully customizable.
All plans include seamless integration with 80+ platforms, unlimited client users, and access to 24/5 live customer support. The Agency plan starts at $179/month, which includes 10 clients, unlimited staff users, an Ask AI feature, and the ability to create custom alerts.
Summary: The Best Data Visualization Tools for Agencies
Data visualization tools provide a faster, clearer way to communicate marketing performance, both internally and to clients.
Instead of staring at number-heavy insights, these platforms illustrate performance in a way that’s easy to digest and actionable. And as we’ve explored, there’s no shortage of options out there. The key is choosing one that matches your agency’s workflows, client volume, and reporting goals.
That’s where a reporting solution like AgencyAnalytics stands out. It’s engineered to support data-heavy workloads, save valuable time, and grow with your agency. Don’t worry about the limitations that come with other data visualization tools–invest in one that does it all.
The data visualization provided by AgencyAnalytics goes beyond the reports you can create in Google Sheets. And it's all at the click of a single button. We also really appreciate the automation.
Graham Lumley, Director of Growth Marketing, Blackhawk Digital Marketing
Create reports that pique curiosity and encourage data exploration. Share insights that matter with AgencyAnalytics–try it free for 14 days.

Written by
Paul Stainton is a digital marketing leader with extensive experience creating brand value through digital transformation, eCommerce strategies, brand strategy, and go-to-market execution.
Read more posts by Paul StaintonSee how 7,000+ marketing agencies help clients win
Free 14-day trial. No credit card required.


