Table of Contents
QUICK SUMMARY:
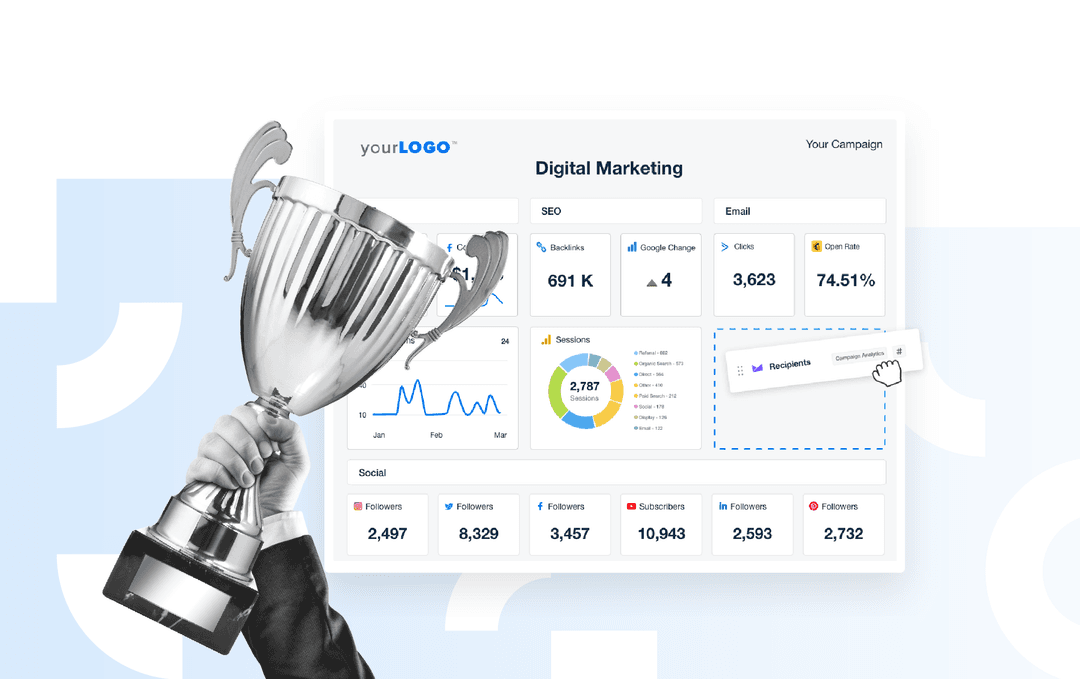
Discover 18 top marketing analytics tools every agency needs in 2025. From web and social to paid search and product analytics, this guide compares features, pricing, customer satisfaction, and performance to help you pick the right marketing analytics platforms for your tech stack.
Marketing agencies don’t have time to wrestle with clunky dashboards or outdated spreadsheets. When juggling dozens of client accounts and marketing campaigns, the right marketing analytics tools are essential.
Whether you're tracking ROI, investigating channel performance, or preparing for your next client meeting, you need tools that provide fast, accurate, and actionable insights. That means customizable dashboards, automated reporting, and integrations with the platforms you already use.
We’ve rounded up the top marketing analytics tools for 2025 to help you find the best fit for your agency. From powerhouse platforms to niche solutions, each one has something different to offer. You’ll see what makes each tool stand out, what to watch out for, and how to match the right features to your agency’s workflow.
Let’s dive in.
What Are Marketing Analytics Tools?
Marketing analytics tools help agencies collect, track, analyze, and report on data from digital campaigns. They’re built to turn raw numbers into real marketing performance insights–so you can prove your agency’s value, optimize campaign performance, and scale client results.
Instead of jumping between platforms or piecing together screenshots, these tools bring everything into one place. That includes SEM metrics from paid ads metrics from paid ads, organic search, email campaigns, social media, and web analytics. Some even use AI to surface trends or suggest optimizations.
They’re not just for performance tracking, either. Agencies use them to:
Build custom dashboards for different clients
Automate monthly reporting
Spot issues before they snowball
Identify growth opportunities
Make better strategic decisions, faster
The right tool saves hours every week and creates more room for high-level work.
The Best Marketing Analytics Tools to Add to Your Stack
With so many moving parts across PPC, SEO, social, and content, marketing agencies need tools that simplify the chaos, not add to it. The right analytics tools pull your data together, surface what matters most, and help you show clients exactly how their marketing is performing. Use our agency tools guide to benchmark the essentials and eliminate bloat.
Whether you're fine-tuning ad spend, tracking organic growth, or building dashboards and reports that get read, these tools keep your agency sharp and your reporting on point.
Let’s take a look at our definitive list of the best marketing analytics tools:
1. AgencyAnalytics
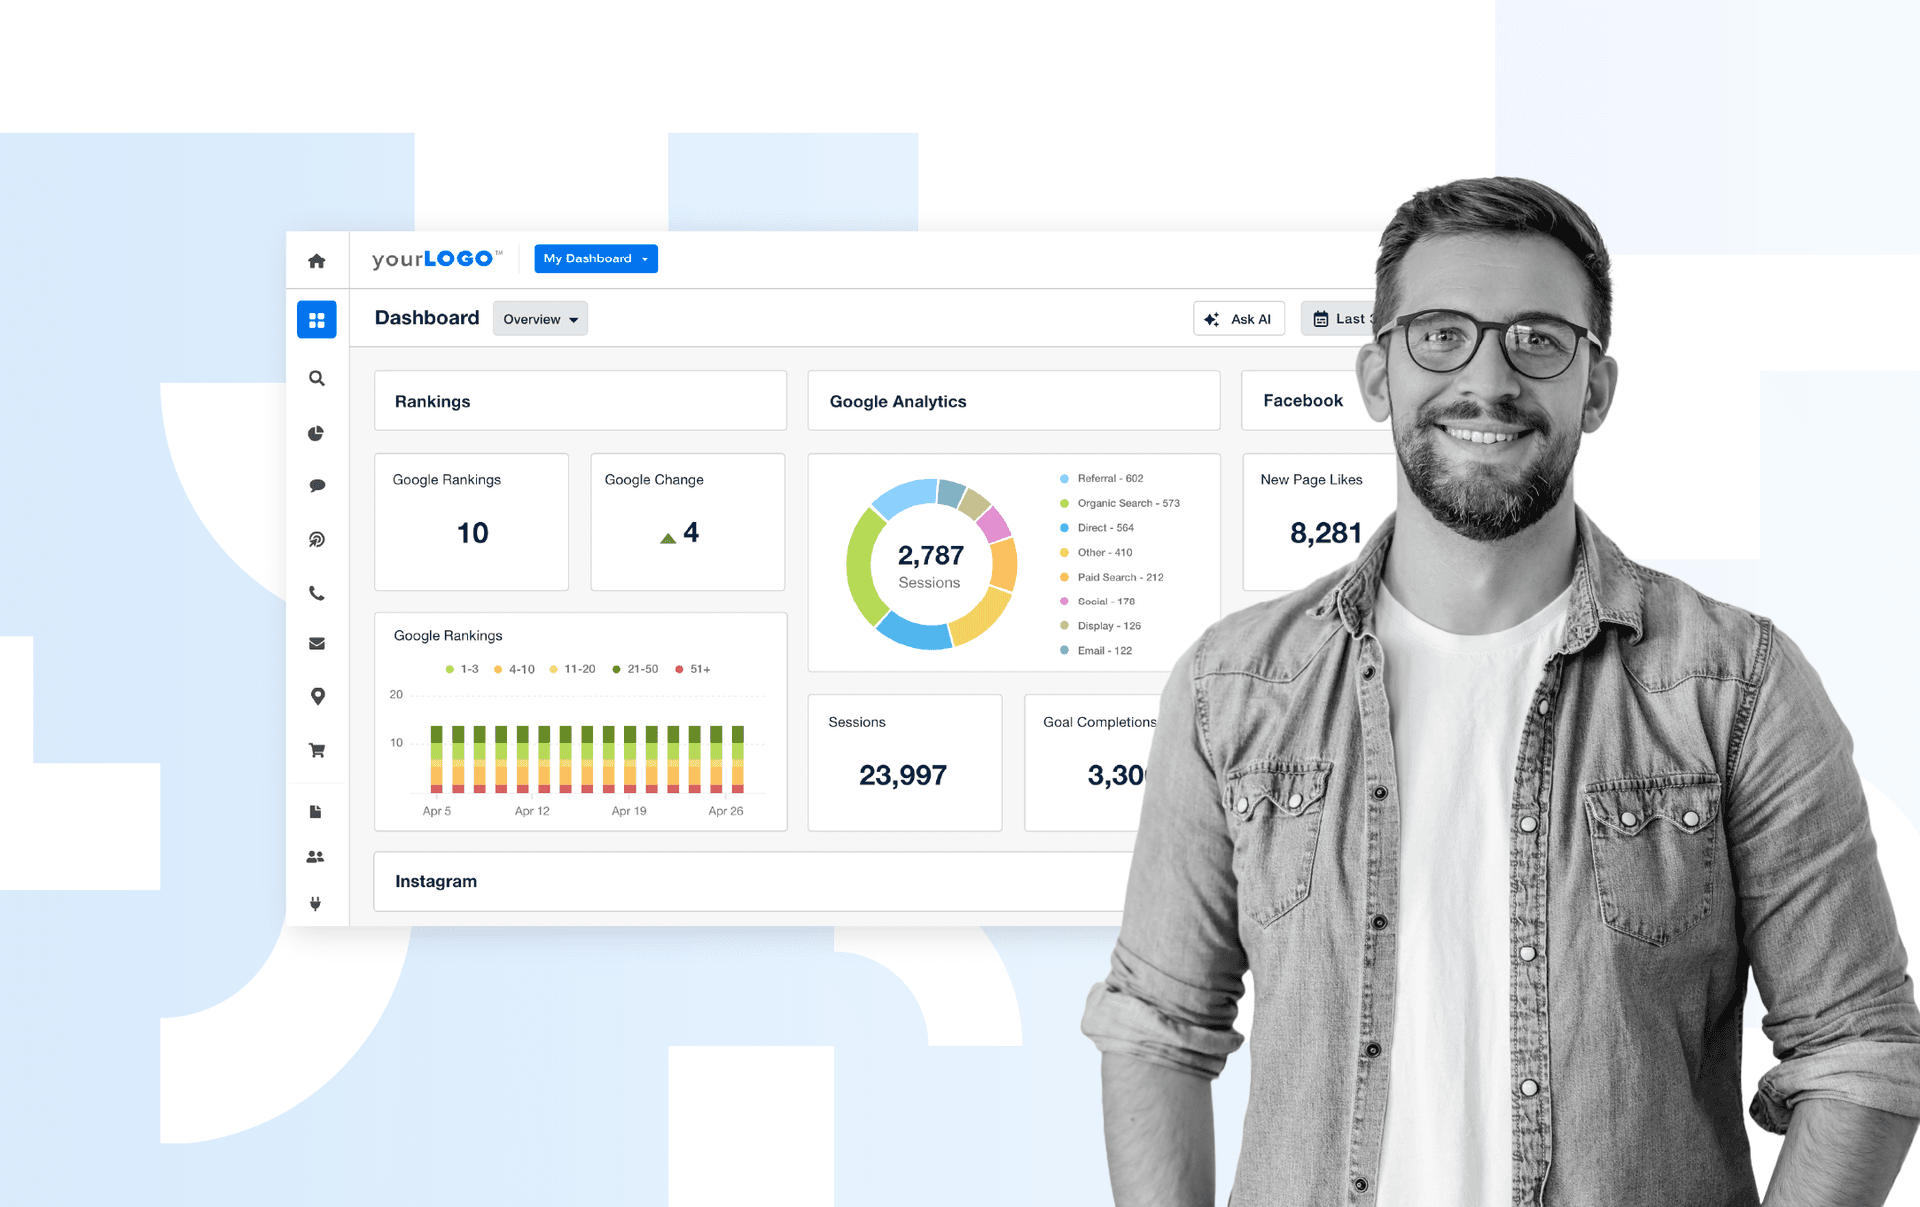
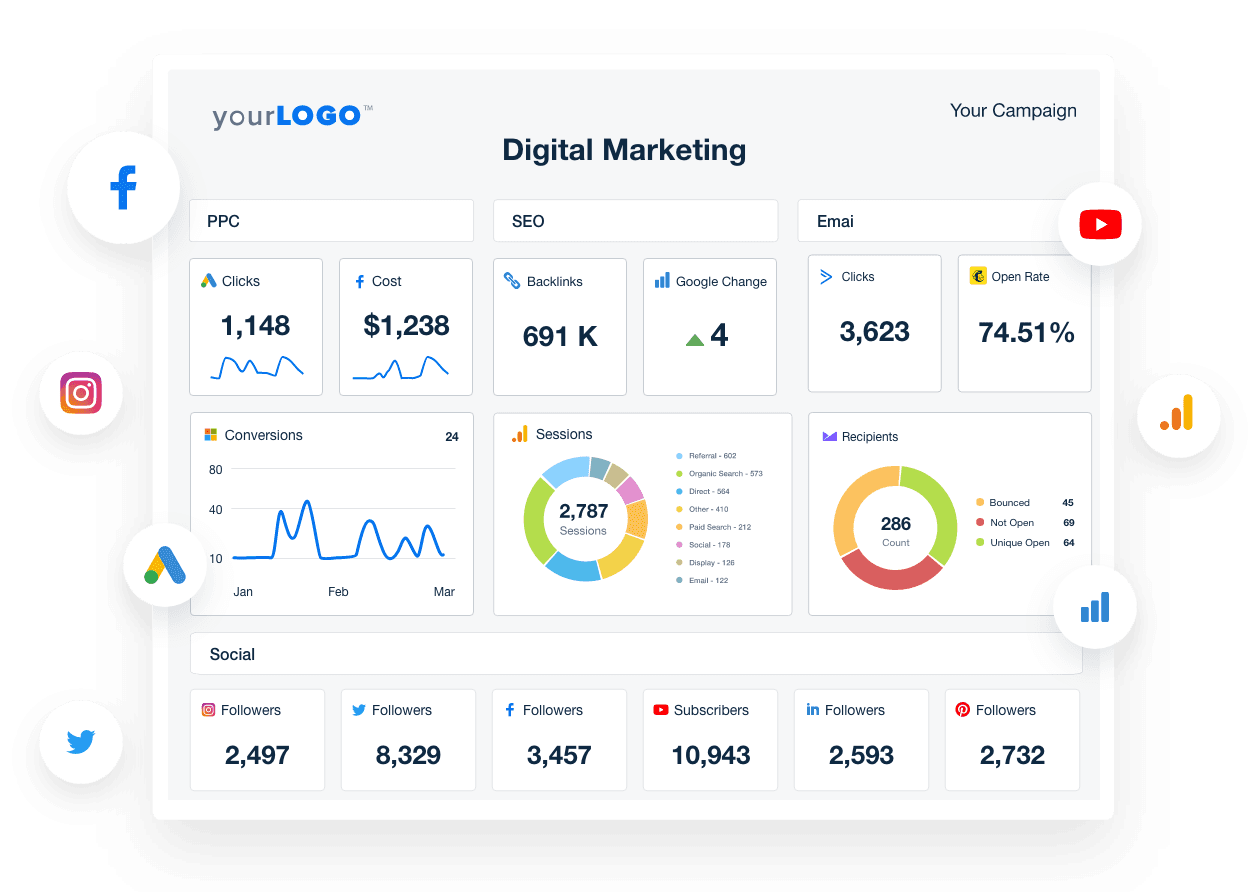
AgencyAnalytics automates all your client reporting in minutes by aggregating data from over 80 marketing integrations in minutes instead of hours.
All of the data from your other marketing analytics tools, including website and ecommerce analytics, SEO analytics, PPC performance, engagement across social media channels, and even HubSpot, are combined into one customizable dashboard.
AgencyAnalytics was built for marketing agencies like yours. It reduces the hours and effort it takes each month to gather, compile, and visualize data to streamline marketing reporting. Its comprehensive data analysis capabilities with white labeled dashboards give your agency more space to develop strategies to retain and acquire more clients.
From Instagram metrics to Google ads data to the results of the latest SEO health checkup, and everything in between, you don't have to spend hours copying and pasting data from multiple marketing channels when it's all just a few clicks away.
Pricing
Freelancer ($59) per month: 5 clients; $20/mo per extra client
Agency ($179 per month): 10 clients; $20/mo per extra client
Agency Pro ($349) per month: 15 clients; $20/mo per extra client
Key Features
80+ data integrations (Google, Facebook, Shopify, LinkedIn, etc.)
White label dashboards, client portals, and custom branding and domains
AI summary tools and automated report generation
Custom metrics, alerts, goals, bulk actions (Pro and above)
Rank tracking, data‑warehouse connectors, and dedicated onboarding
Pros
Highly intuitive and quick to set up
Substantial value for agency-focused reporting
White labeling and client portals strengthen branding and transparency
Fast, responsive 24/5 support
Cons
Higher-tier pricing required for access to key features like AI, custom metrics, bulk operations
Rank tracker and add‑ons are extra
2. Google Analytics
When you think of a marketing analytics tool, Google Analytics is likely the first one that comes to mind. A free, foundational resource for marketing data analysis, Google Analytics is where many other marketing analytics tools on this list pull parts of their data.
Google Analytics lets you view just about any website metric, from Bounce Rate to Goal Completions to top Acquisition Channels, to see the complete picture of your website’s performance. It helps marketing teams analyze data for insights and track key metrics across multiple marketing channels to make data-driven decisions quickly.
Pricing
Google Analytics 4: Free, includes up to 500K sessions per report, 14-month data retention, integration with BigQuery at no cost
Google Analytics 360 (Enterprise tier): Starting at ~$50,000/year; supports >25M events/month with enhanced SLAs and support
Key Features
Event-based tracking model: logs interactions as events (page views, scrolls, clicks, video marketing analytics) with up to 25 custom parameters per event
Cross-platform data streams: scope website, iOS, Android in a single property
BigQuery native export included in GA4; previously only available in GA360
Built-in enhanced measurement (scrolls, file downloads, site search, etc.) and analysis tools like funnels and explorations
AI predictive metrics (e.g., churn probability, purchase prediction); part of GA4’s machine-learning ecosystem
Pros
Simple setup and ready-to-use dashboards, ideal for quick deployment
Universal adoption: GA4 is installed on ~50% of top websites, ensuring familiarity and community support
Strong integration across Google Marketing Platform, e.g., seamless audience sharing with Google Ads
Cons
Steep learning curve, especially for users migrating from Universal Analytics
Sampling issues and data retention capped at 14 months (or 2 months for some properties), leading to partial datasets and potential reporting gaps
Interface changes and complexity, with frequent updates and usability challenges
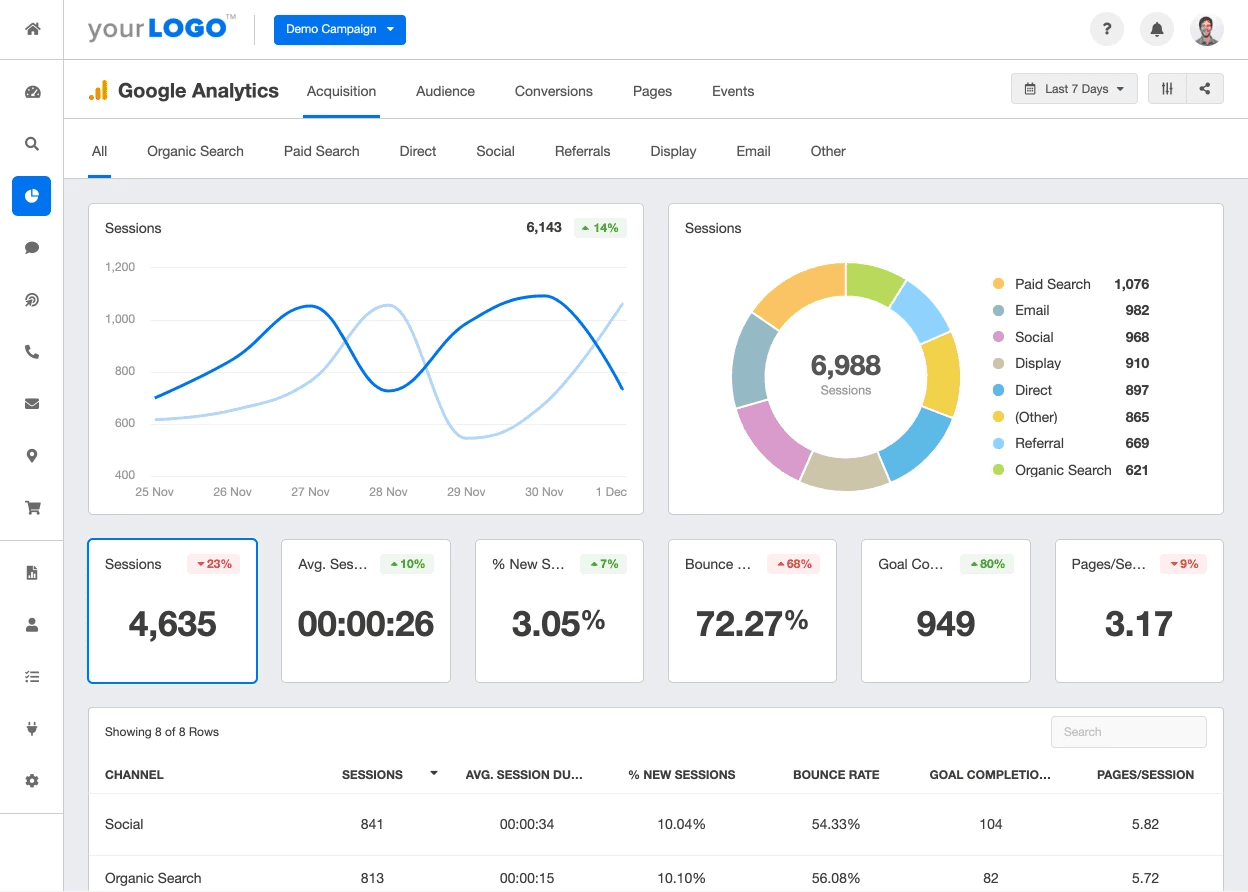
The sheer volume of data available with Google Analytics is why AgencyAnalytics’ Google Analytics dashboard is one of the most popular among our agency partners. With it, agencies create clean, streamlined Google Analytics reports that help tell the story behind their marketing efforts.
3. Adobe Analytics
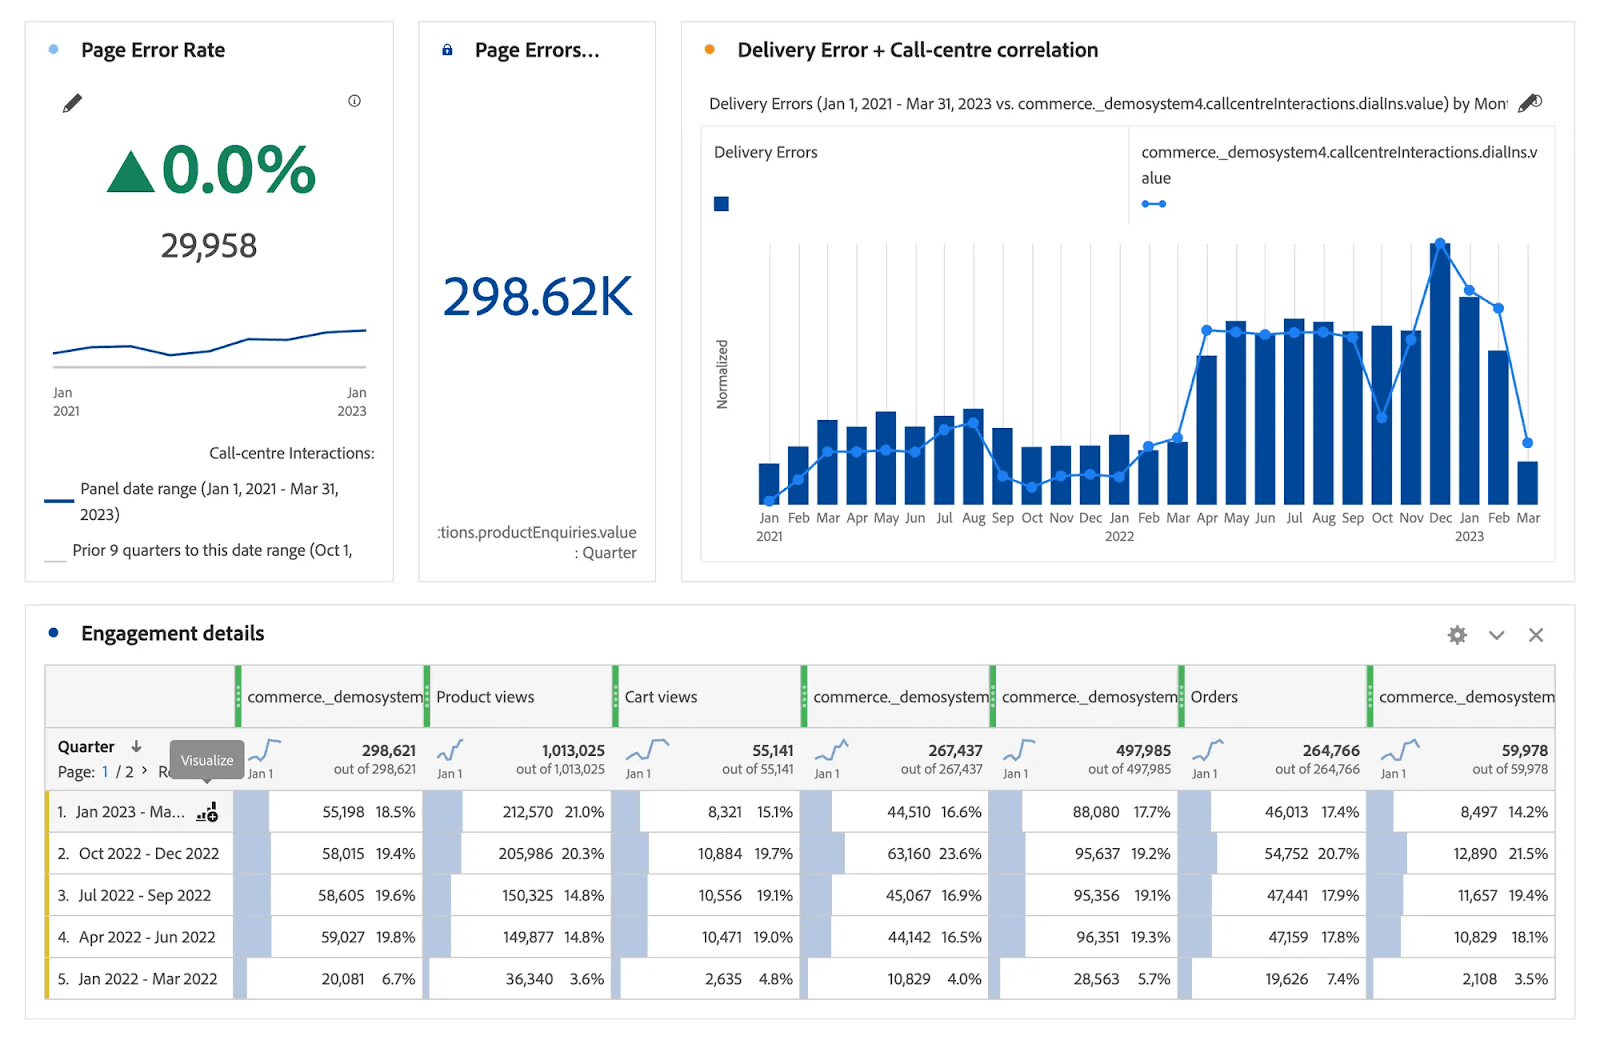
Adobe Analytics (previously known as Omniture) is the self-proclaimed "web analytics on steroids"–it’s a much more powerful web analytics tool than your out-of-the-box Google Analytics implementation, but that means it is also much, much more complex to set up and manage.
This enterprise-grade digital analytics platform supports advanced marketing analytics and detailed and customizable reports. It’s specifically designed for data analysts, supports advanced analytical tasks, and offers comprehensive features for marketing data analysis and data-driven decisions.
(Credit: Adobe)
Pricing
Custom enterprise pricing starts around $100,000 annually; exact cost varies based on data volume, modules, and SLAs
Structured into tiers: Select, Prime, Ultimate, each with increasing features (e.g., AI-driven alerts, journey visualizations, Audience Segmentation)
Add-ons available: Streaming Media, Customer Journey Analytics, Attribution AI, Data Repair API
Key Features
Deep data collection across web, mobile, product, and content, with cross-channel and cross-device tracking via ECID
Advanced segmentation, real-time anomaly detection, intelligent alerts, algorithmic attribution, cohort retention, flow visualizations
AI/ML-powered capabilities: predictive insights, automated segmentation, and virtual analyst
Integration with Adobe Experience Cloud (Target, Campaign, Audience Manager) and APIs for data exports and advanced data governance
Pros
Enterprise-grade analytics with robust customization and deep journey insights
Granular segmentation and ad-hoc reporting empower detailed and flexible analysis
Drag-and-drop interface enables non-technical users to build complex visualizations
Cons
Significant financial investment makes it unsuitable for smaller agencies
Steep learning curve and complex setup–requires dedicated implementation teams and training
Limited native integration outside Adobe–may require custom connectors for Google or other platforms
Agency Pro Tip: Adobe Analytic's Segmentation IQ feature is very handy for discovering statistically significant differences among different segments using automated analysis.
4. HubSpot Marketing Hub
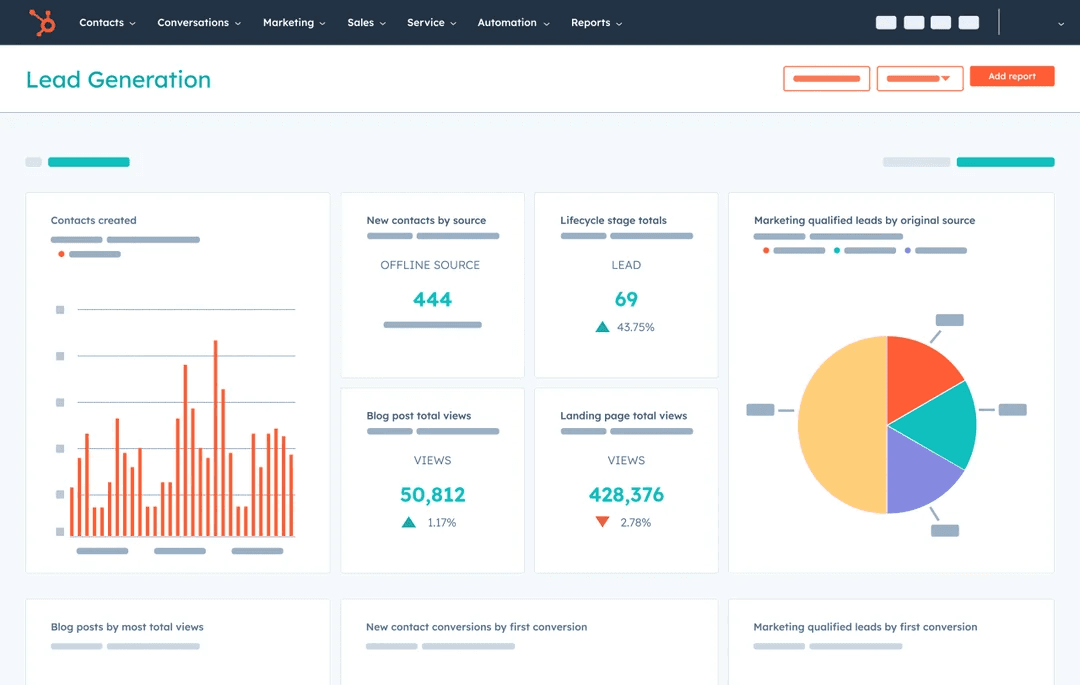
HubSpot Marketing Hub goes beyond the typical customer relationship management platform offering to provide a complete inbound marketing platform with tools to manage content marketing, SEO, email campaigns, automation, lead management, and streamlined reporting.
For agencies that run multichannel campaigns across client accounts, it offers valuable insights and a powerful way to track performance, tie activity to revenue, and automate tedious marketing activities and tasks.
It’s especially useful for agencies that want their analytics and automation in one place. Marketing attribution, sales funnel metrics, and conversion tracking are all built in.
And with HubSpot’s custom reporting tools, you can dig into detailed data across email, paid ads, blog content, SEO, and more–connected to your client’s lifecycle stage.
Just be aware: HubSpot pricing increases quickly as a client list and contact database grows. And while the platform is user-friendly, some advanced features are gated behind its higher-tier plans.
(Credit: Hubspot)
Pricing
Free: $0 for basic tools
Starter: From $20/month
Professional: From $890/month
Enterprise: From $3,600/month
Key Features
CRM, email marketing, automation, social media tools
Landing page builder, blog, and SEO recommendations
Advanced attribution and custom reporting (Pro+)
AI tools for content and lead scoring
1,800+ app integrations (Salesforce, Google, etc.)
Pros
Excellent all-in-one platform for inbound marketing
Seamless CRM and reporting workflows
Strong educational resources and onboarding
Cons
High costs for advanced automation and analytics
Some key features are gated behind expensive plans
Rigid contracts and limited refund flexibility
5. Salesforce Marketing Cloud Intelligence
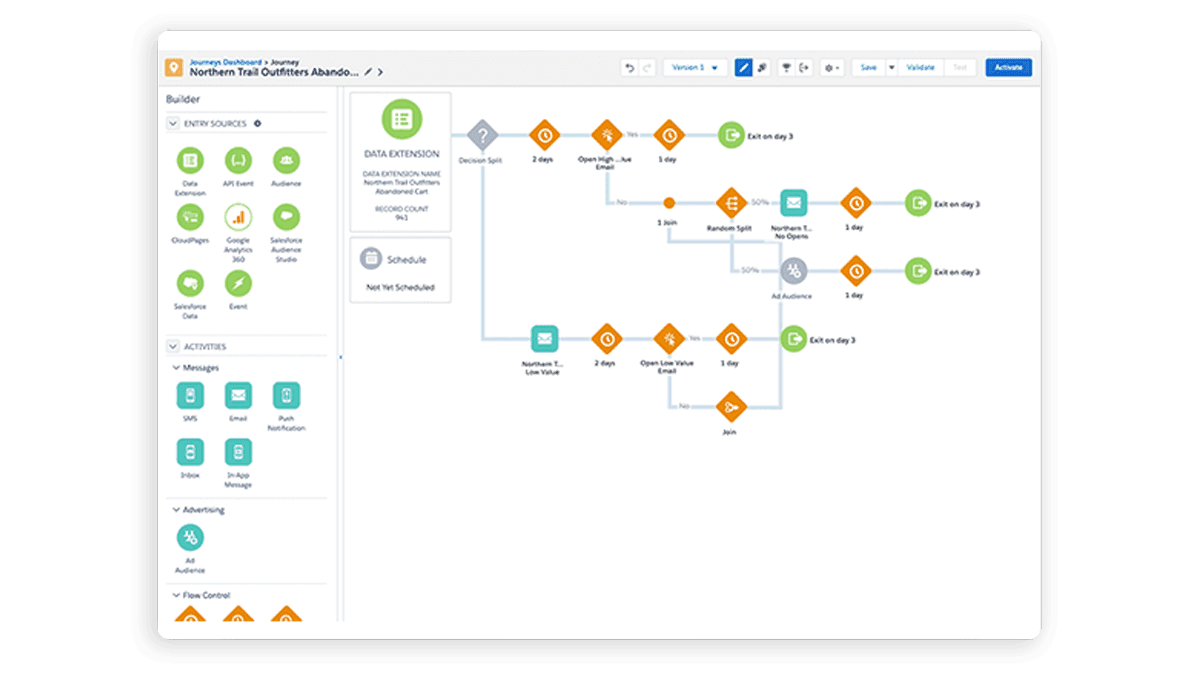
Formerly Datorama, Salesforce Marketing Cloud Intelligence helps agencies unify, visualize, and act on marketing data from all platforms–paid ads, social media, CRM, or email.
With deep AI capabilities and custom dashboards, it’s one of the most powerful enterprise-grade marketing intelligence tools on the market.
(Credit: Salesforce)
Pricing
Starter: $3,000/org/month for 10 users and 3 million data rows
Growth: $10,000/org/month for 20 users, 20 million data rows
Plus: $30,000/org/month for 80 users, 100 million data rows (quote-based)
Key Features
Pre-built marketing data model with support for cross-channel integrations (ads, email, web, CRM)
AI-driven dashboards, goal tracking, and attribution models
Rich data ingestion, normalization, and classification at scale
Agentforce for paid media optimization and RTB-ready BI
Slack/email export, embeddable visuals, and automated reporting pipelines
Pros
Robust data integration
Powerful, customizable dashboards
AI-enhanced insights
Cons
High cost: Even the Starter tier places it out of reach for small or mid-size agencies
Steep learning curve: Users report complexity and implementation time
Data-row billing model: Costs can ramp up if data volume grows rapidly
6. Matomo
For agencies seeking a robust alternative to mainstream analytics tools like Google Analytics, Matomo offers a compelling option.
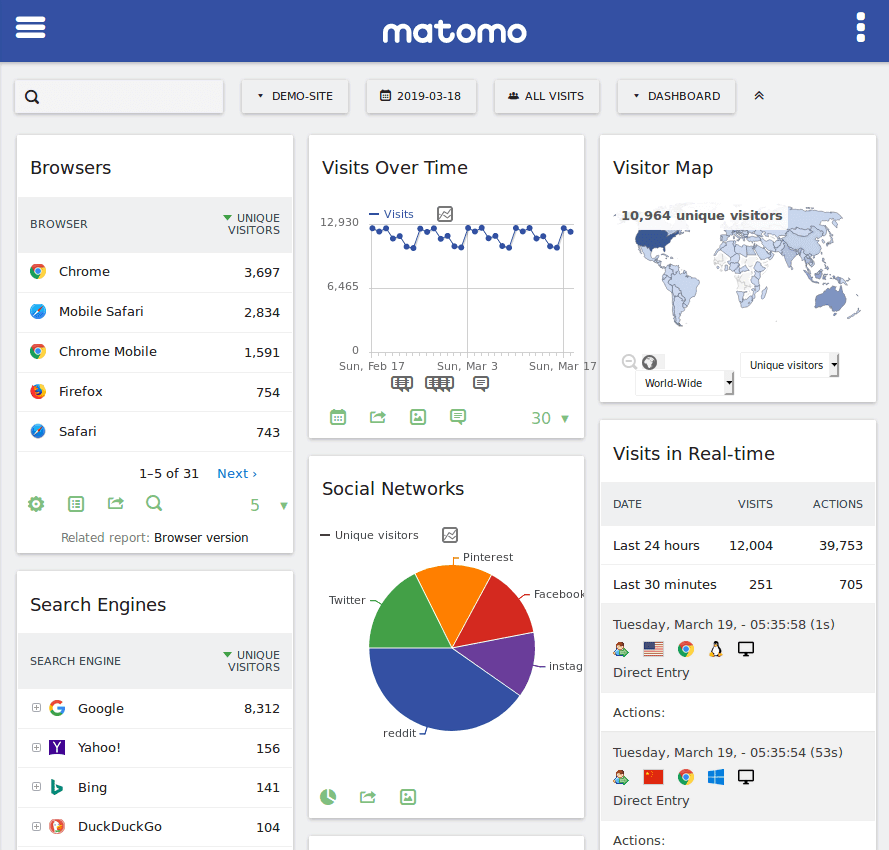
Formerly known as Piwik, Matomo stands out for its focus on privacy and data ownership, providing full control over the data collected. This open-source platform offers detailed analytics without compromising user privacy, making it a top choice for businesses mindful of GDPR and other data protection regulations.
Matomo reporting provides comprehensive insights into key Matomo metrics such as Total Visitors, Bounce Rate, and Average Session Duration. It also excels in offering customizable reports and dashboards, allowing marketers to tailor their analytics to meet specific client needs. The flexibility of Matomo is further enhanced by its ability to integrate with various other tools and platforms, ensuring seamless data collection and analysis.
Additionally, Matomo's heatmap and session recording features allow for in-depth analysis of user behavior, providing actionable insights that can drive website improvements.
The platform's ecommerce tracking capabilities offer detailed reports on sales, product performance, and customer journeys, which are invaluable for optimizing marketing strategies.
(Credit: Matomo)
Pricing
Cloud (hosted): $19/month (billed annually) for basic usage
On-Premise: Free core platform (you supply hosting/maintenance); premium modules like heatmaps, A/B Testing, funnels, and white labeling are extra
Key Features
100% data ownership and no sampling–ensuring full accuracy and compliance
Detailed visitor tracking (heatmaps, session recordings, funnels, segmentations)
Built-in tag manager, A/B testing, ecommerce and media analytics
Customizable dashboards, custom reports, and multi-channel attribution
Modular structure: add features like heatmaps, reports, white label branding as needed
Pros
Strong privacy and security focus; ideal for GDPR and data-sensitive clients
Open-source flexibility with cloud or self-hosted control
Transparent, tiered pricing and modular add-ons–avoids expensive flat fees
Cons
Set-up and hosting burden for on-premise users can require technical resources
Essential modules–like heatmaps or recording–cost extra
Limited native PPC ad integrations (e.g., Google Ads linking requires manual work)
Agency Pro Tip: Leverage Matomo's custom reports feature to create tailored insights for your clients, highlighting the metrics that matter most to their business objectives. Simplify your analytics process and showcase key insights with a white-label Matomo dashboard or a customizable Matomo report template—designed to save time and deliver value.
7. Plerdy Website Heatmap Tools
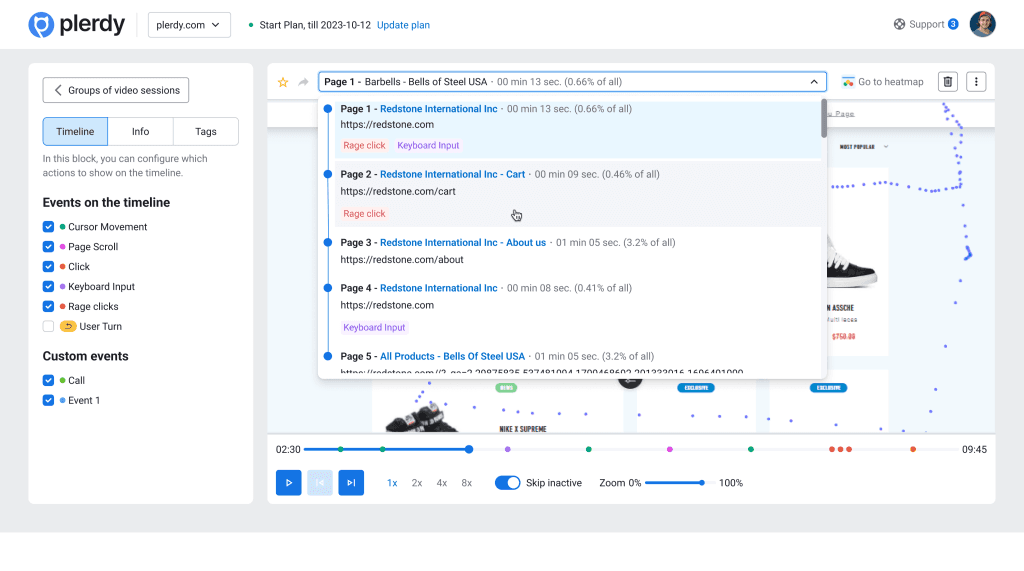
Want to gather actionable insights to help take a client website to the next level? Then you need to check out Plerdy’s website heatmap tools. With these powerful marketing analytics tools, you can track and analyze user behavior to see what's working and what isn't.
That way, you can make the necessary changes to improve your client's website and make it even more user-friendly. Plus, Plerdy offers a free trial mode to try out their features risk-free.
(Credit: Plerdy)
Pricing
Free: 2,000 pageviews/day, up to 100 session replays, 3 heatmaps/day, 1 active popup, 50 leads, 10 SEO audits/day, 1 month data retention
Startup ($29/month): 10,000 pageviews/day, unlimited heatmaps, 1,000 session replays, 3 popups, 1,000 leads, 2,000 SEO audits/day, 3 months data retention
Scale ($59/month): 25,000 pageviews/day, unlimited heatmaps, 2,000 session replays, 5 popups, 2,000 leads, 5,000 SEO audits/day, 6 months data retention
Premium ($99/month): 50,000 pageviews/day, unlimited heatmaps, 4,000 session replays, 10 popups, unlimited leads, 10,000 SEO audits/day, 6 months data retention
Key Features
Unlimited A/B testing and user session recordings
Heatmaps with no sampling for click, scroll, move analysis
SEO audit tools and daily alerts
Pop-up and form builders for lead capture and engagement
Integrations: Google Analytics, Search Console, Mailchimp, Shopify, and more
Pros
Rich feature set even in the free tier: heatmaps, recordings, pop-ups, SEO audits
Unlimited lead capture on basic plans is valuable for agencies
Responsive customer support and helpful tutorials
Cons
Advanced plans (Startup, Scale) can feel pricey for smaller agencies
Some dashboard glitches and occasional slowdowns in session replay load
UI bugs noted in mobile browsers; onboarding resources could be expanded
Agency Pro Tip: Heatmaps are an invaluable tool that experienced marketers, UX experts, and SEO specialists rely on to track user behavior.
8. Google Search Console
The definitive Google Search reporting tool, Search Console is, again, where many other marketing campaign analysis tools will pull important data from. Not to mention that it’s free!
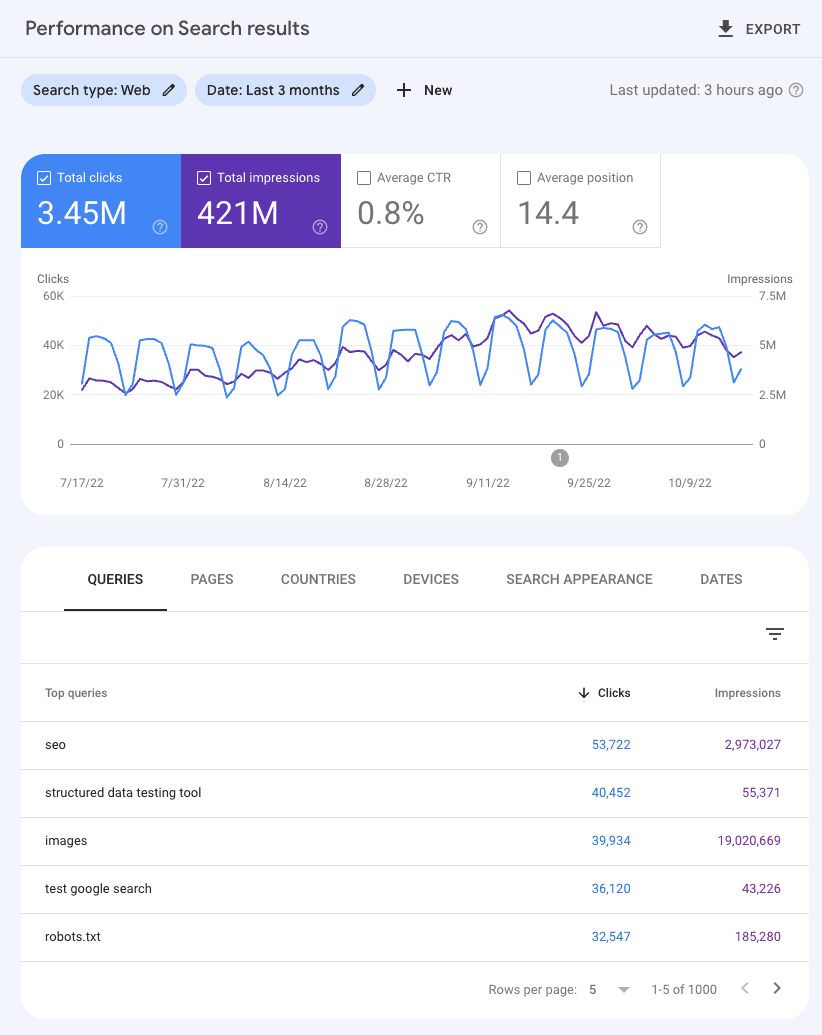
Toggle to Performance > Search Results for a handy overview of how your clients have been performing in search results. Here, you’ll find a dashboard with metrics like total clicks, total impressions, Average CTR, and Average Position.
Also find below your top queries, pages, countries, devices, search appearances, and dates.
And in Search Console (the upgraded version of Google Webmaster Tools), you’ll find other key features for indexing, experience, and enhancements. All around, a Google Search Console reporting tool is an essential part of any digital marketing analytics toolkit.
(Credit: Google)
Pricing
Free—no subscription cost, usage limits only on API calls
Key Features
Search performance reports: clicks, impressions, CTR, and average position
Index Coverage and URL Inspection tools for crawl and indexing diagnostics
Page Experience and Core Web Vitals insights
Sitemaps, AMP, structured data, backlink monitoring, security issue alerts
Google Search Console API available for free with usage limits
Pros
Free and supported directly by Google–no hidden costs
Deep technical insights into indexing and search visibility
Works well with GA4 and other SEO tools for cohesive insights
Cons
Limited real-time data–typically a 48–72 hour delay between events and reporting
No built-in competitor analysis, benchmarking, or multi-site comparisons
Not beginner-friendly–requires SEO knowledge to interpret technical insights
Agency Pro Tip: Don’t forget to check the Mobile Usability tab for a snapshot of how your clients’ sites are performing on mobile devices. Fixes here can make for quick wins, especially in Google’s mobile-first indexing world.
9. Looker Studio (Google Data Studio)
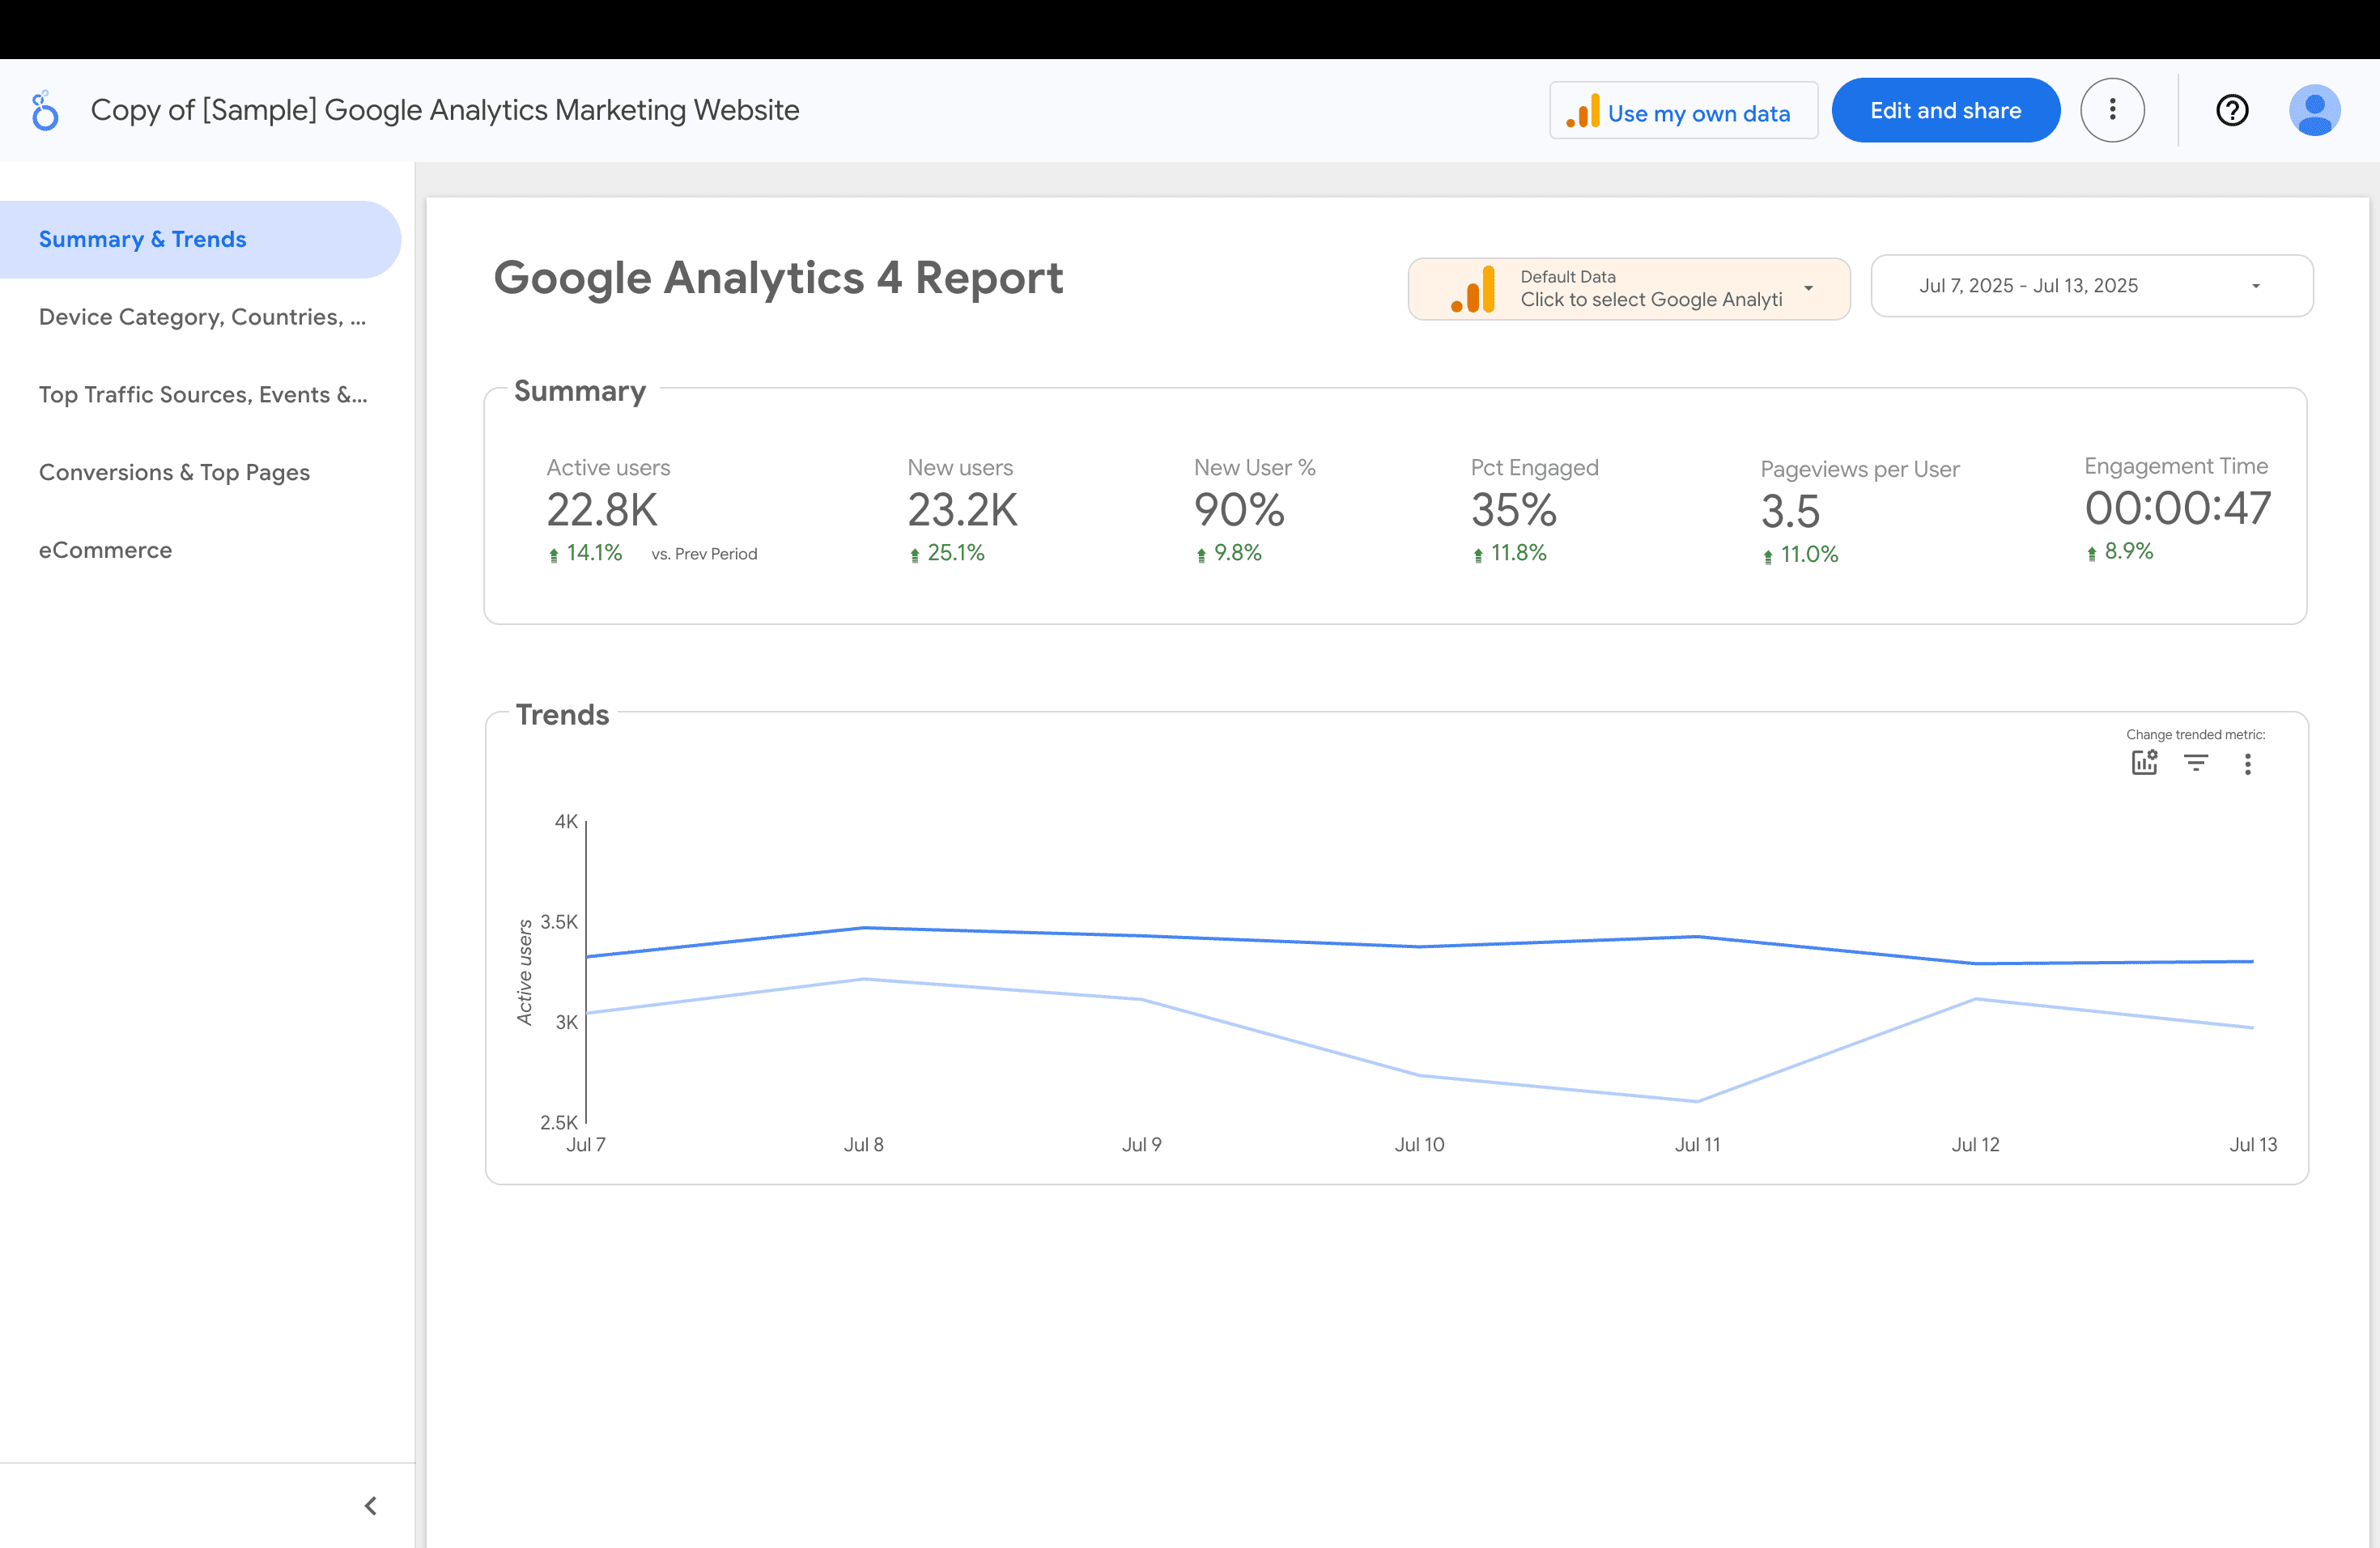
Another free data analysis tool and business intelligence platform from Google, Looker Studio, offers a more elegant way to view your metrics, especially from sources like Google Analytics (although they integrate with hundreds of “Connectors”).
Simply select from one of their premade templates from the Report Gallery and watch your data become more easily analyzable.
Looker Studio is designed to build detailed and customizable reports using basic data transformation features. It helps visualize marketing activities across data sources in one place and supports easy sharing of key metrics with clients.
(Credit: Google)
Pricing
Free ($0/user): Full access to Looker Studio UI and up to 20 native Google connectors
Pro (~$9/user/month): Adds team workspaces, admin features, scheduled refreshes, mobile access, priority support
Note: The free plan includes data from Google products only. Paid third-party connectors (e.g., Facebook Ads, HubSpot) range from $20–$350+/month each.
Key Features
Drag‑and‑drop dashboard editor with templates and flexible visuals
Connect to 20+ free native Google sources and 600+ paid partners
Blended data support for combining sources in a single view
Real-time collaboration, sharing, embedding, and scheduled reports (Pro)
Looker Studio API for asset and access management
Pros
Zero cost for robust BI from Google ecosystem sources
Extensive customization without code; intuitive interface
Strong collaboration tools and share-friendly dashboards
Cons
Connector limits: Free tier excludes non‑Google platforms, requiring paid add-ons
Hidden scaling costs as connector fees accumulate
Steep learning curve for effective data blending and dashboard design
Agency Pro Tip: If you're building reports in Google Data Studio, include date range filters so that you can group data by specific date ranges. This will make it faster and easier when you want to look at historical data on its own, or to create comparisons to showcase growth.
10. Semrush
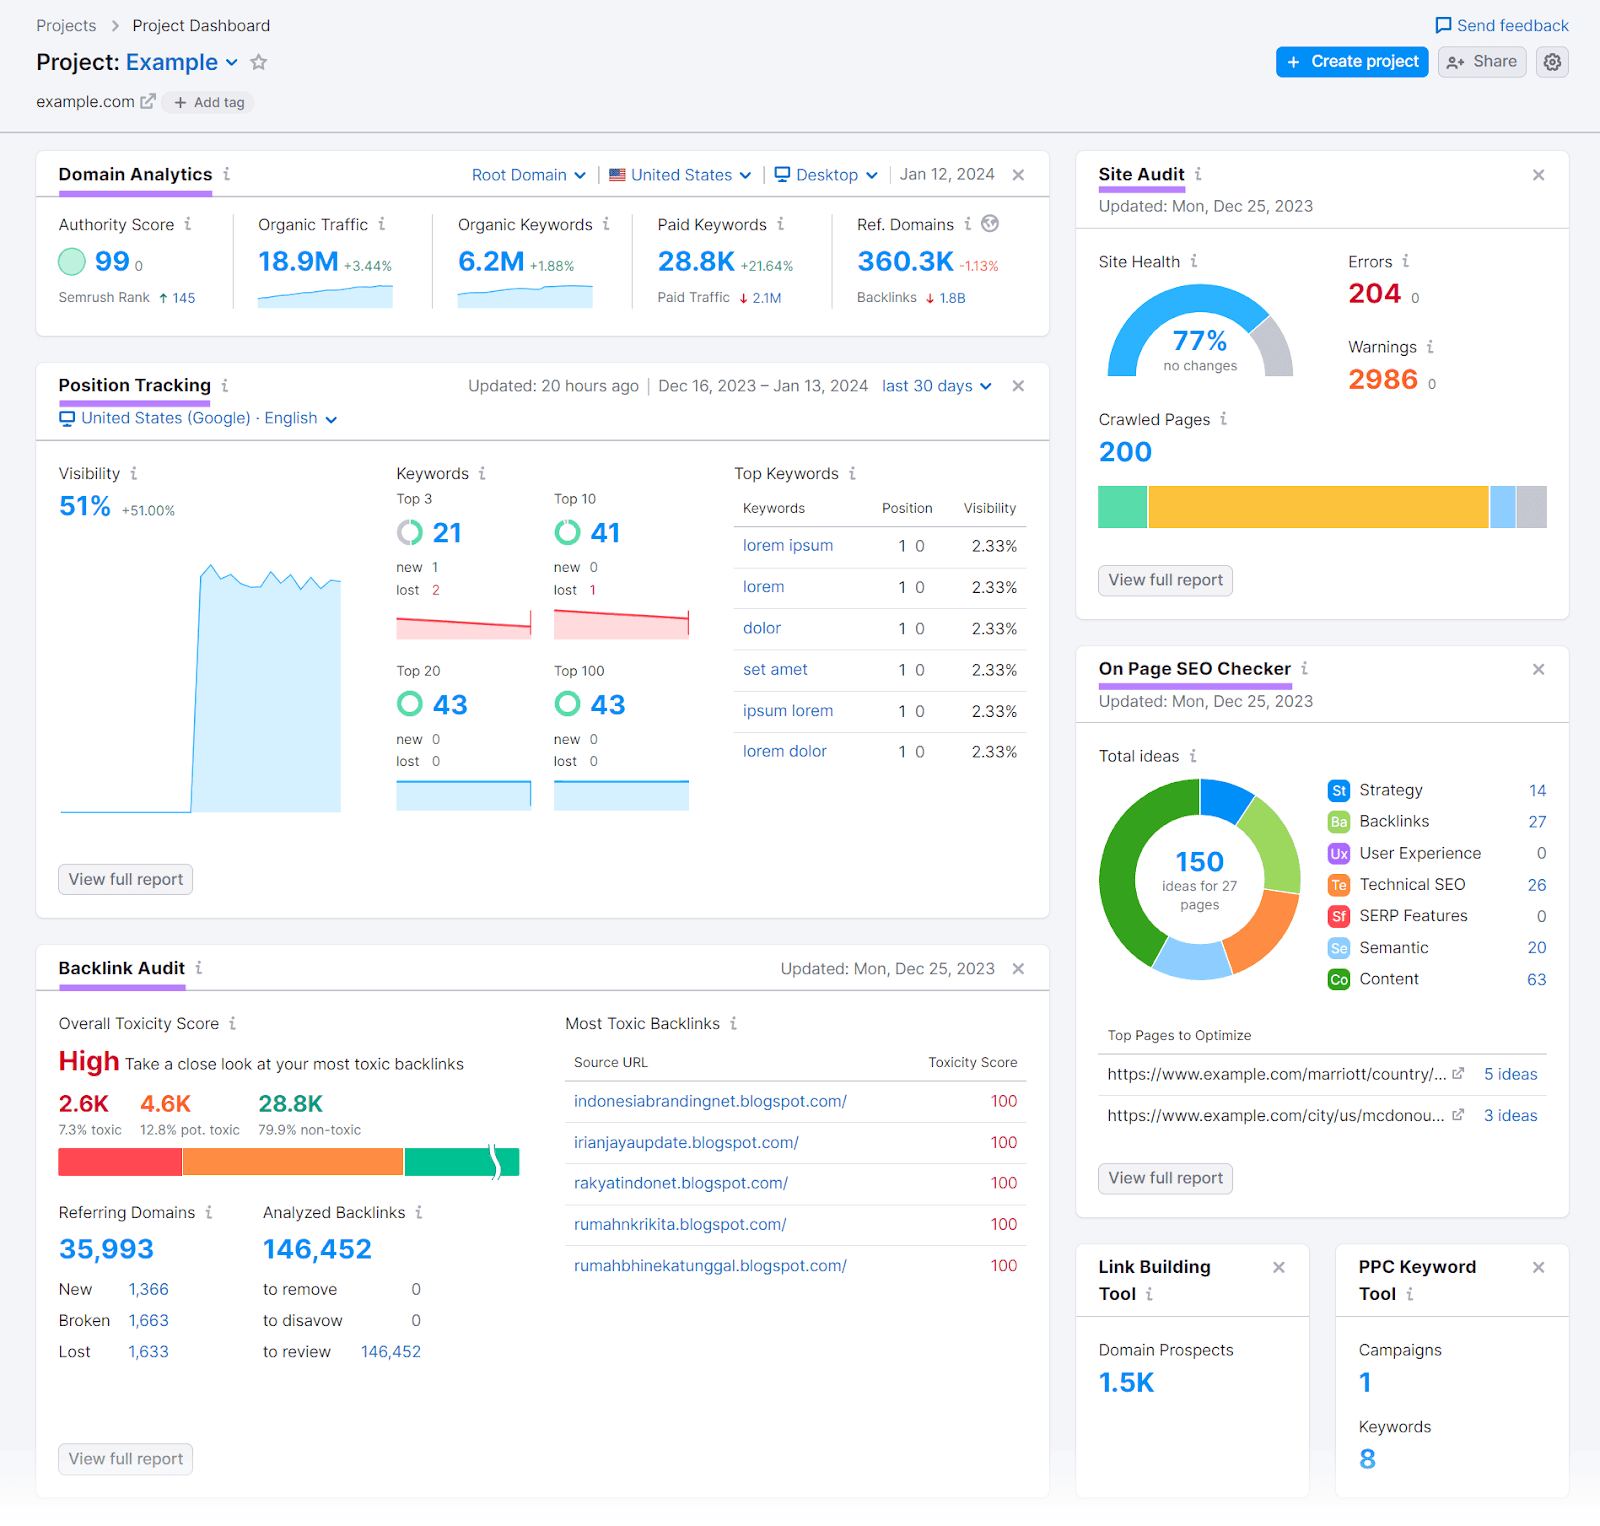
Semrush is another well-known SEO tool (which offers a suite with content marketing, competitor research, PPC, and social media marketing offerings), and the Semrush integration is one of the most popular SEO tools among agencies on the AgencyAnalytics platform.
Semrush is particularly effective for agencies executing advanced search engine marketing tactics, such as keyword research, competitor tracking, and on-page optimization.
(Credit: Semrush)
Pricing
Pro ($139.95/month): Ideal for freelancers and small teams
Guru ($249.95/month): Includes content marketing and historical data
Business ($499.95/month): Ideal for larger agencies; adds API access, PLA, white label, etc.
Enterprise: Custom pricing for tailored usage and features
Key Features
Massive database: 21B+ keywords and 43T+ backlinks
Robust SEO tools: keyword research, site audits, rank tracking
Content marketing tools: topic research, SEO writing assistant, content templates
Paid search support: PPC keyword planner, ad analysis, product listing ads
Competitive intelligence: Keyword and backlink gap tools, Traffic & Market insights
Social media toolkit: scheduling, analytics, content generation
Pros
Vast data sets and generous reporting limits
All‑in‑one platform covering SEO, PPC, content, social, and competitive intel
Powerful link‑building and competitive analysis tools
Cons
High cost, especially with add-ons and higher tiers
Only includes one user seat per account; extra users are pricey
Can be overwhelming for beginners due to breadth and depth
Agency Pro Tip: Use keyword tags to segment performance by search intent, SEO strategy, or timing. For example, you can tag all purchase intent keywords, then add secondary tags for Q1 or Q2 to track which were added when. Or add an “Optimization” tag for keywords where you are doing a page audit and optimization to drive improved rankings. That way, you can filter your ranking reports to see the progress of each SEO strategy.
11. Sprout Social
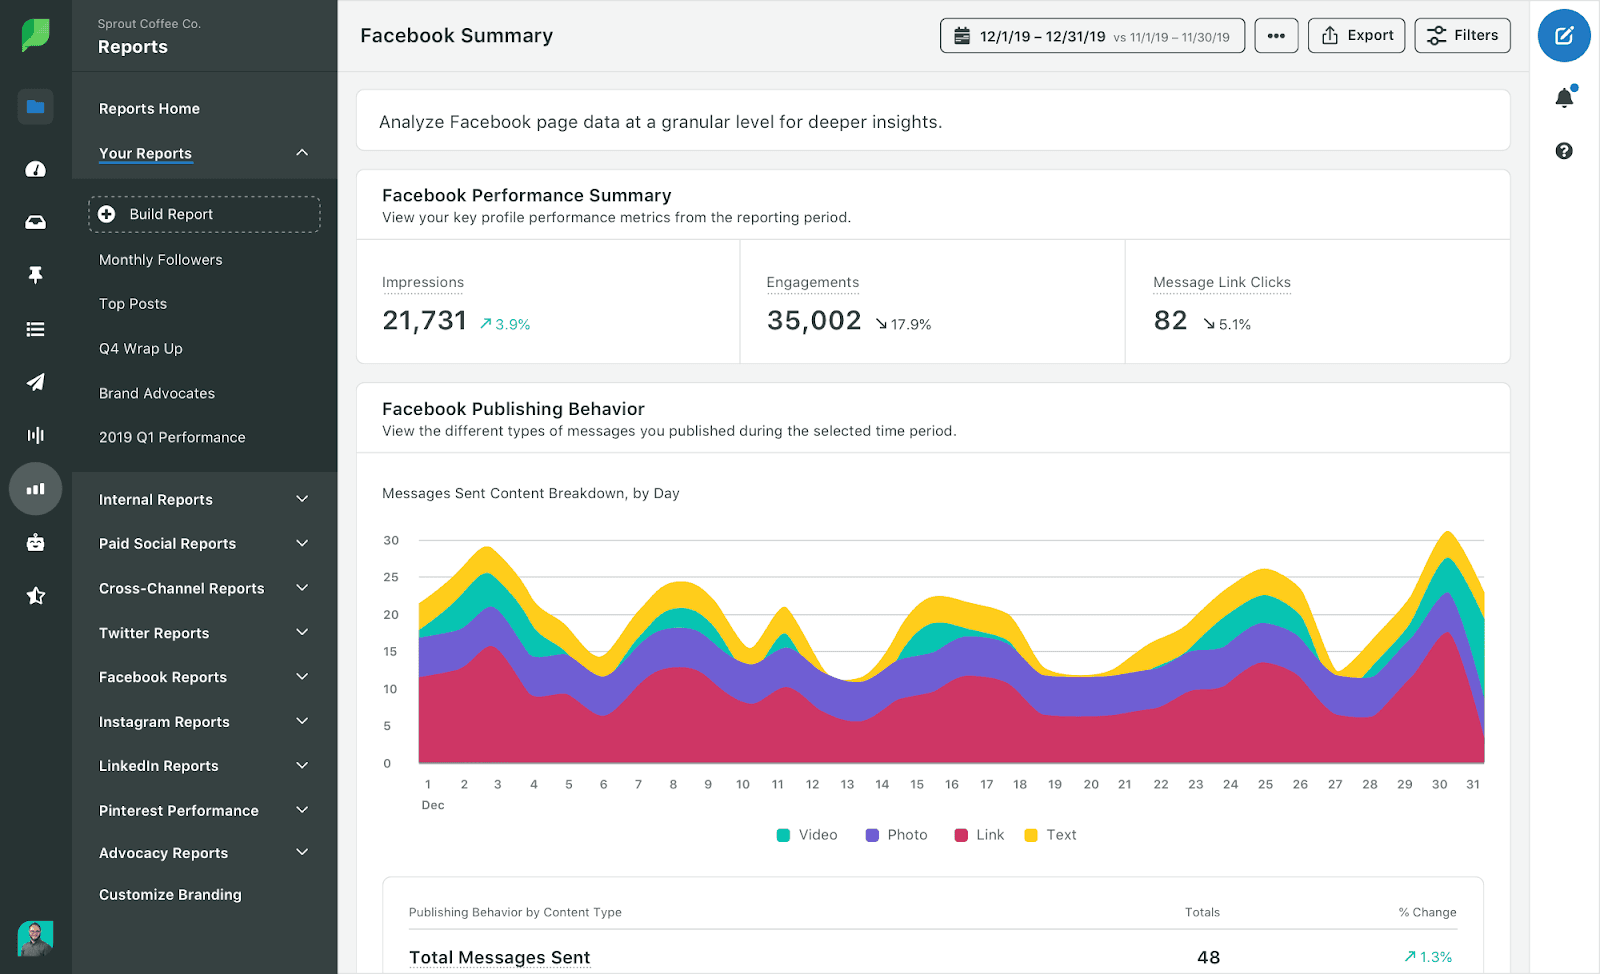
Sprout Social is known for its social media offerings. They offer products for engagement, publishing/scheduling, analytics, social listening, and employee advocacy. Of note here are the analytics capabilities, including automated reporting.
The platform's listening tools analyze conversations and sentiment in real time, which helps agencies uncover valuable insights and drive strategy based on audience behavior.
(Credit: Sprout Social)
Pricing
Standard ($199/seat/month): Includes up to 5 social profiles and core engagement features
Professional ($299/seat/month): Adds unlimited profiles, message tagging, competitor reports, AI Assist, and optimal send times
Advanced ($399/seat/month): Adds chatbots, sentiment analysis, team productivity reports, API, helpdesk integrations
Enterprise (custom pricing): Includes white‑glove onboarding, SSO, dedicated support
Key Features
Comprehensive publishing, engagement, and Smart Inbox across platforms
Scheduling calendar with optimal send-time AI
Robust analytics: Profile-level, tag-level, paid performance, and trend reports
Pros
Clean, intuitive interface praised by users
Handles unlimited social profiles (from Professional tier) with robust team workflows
All-in-one platform eliminates the need for multiple social tools
Cons
High cost–even basic tiers are expensive per seat; add‑ons can push pricing to $1K+/month
Reporting complexity may overwhelm beginners
Only one user seat per license; adding team members multiplies costs
Agency Pro Tip: Don’t forget your URL tracking parameters so that your analytics on website traffic from places like Sprout Social are as accurate as possible.
12. Meta Business Suite
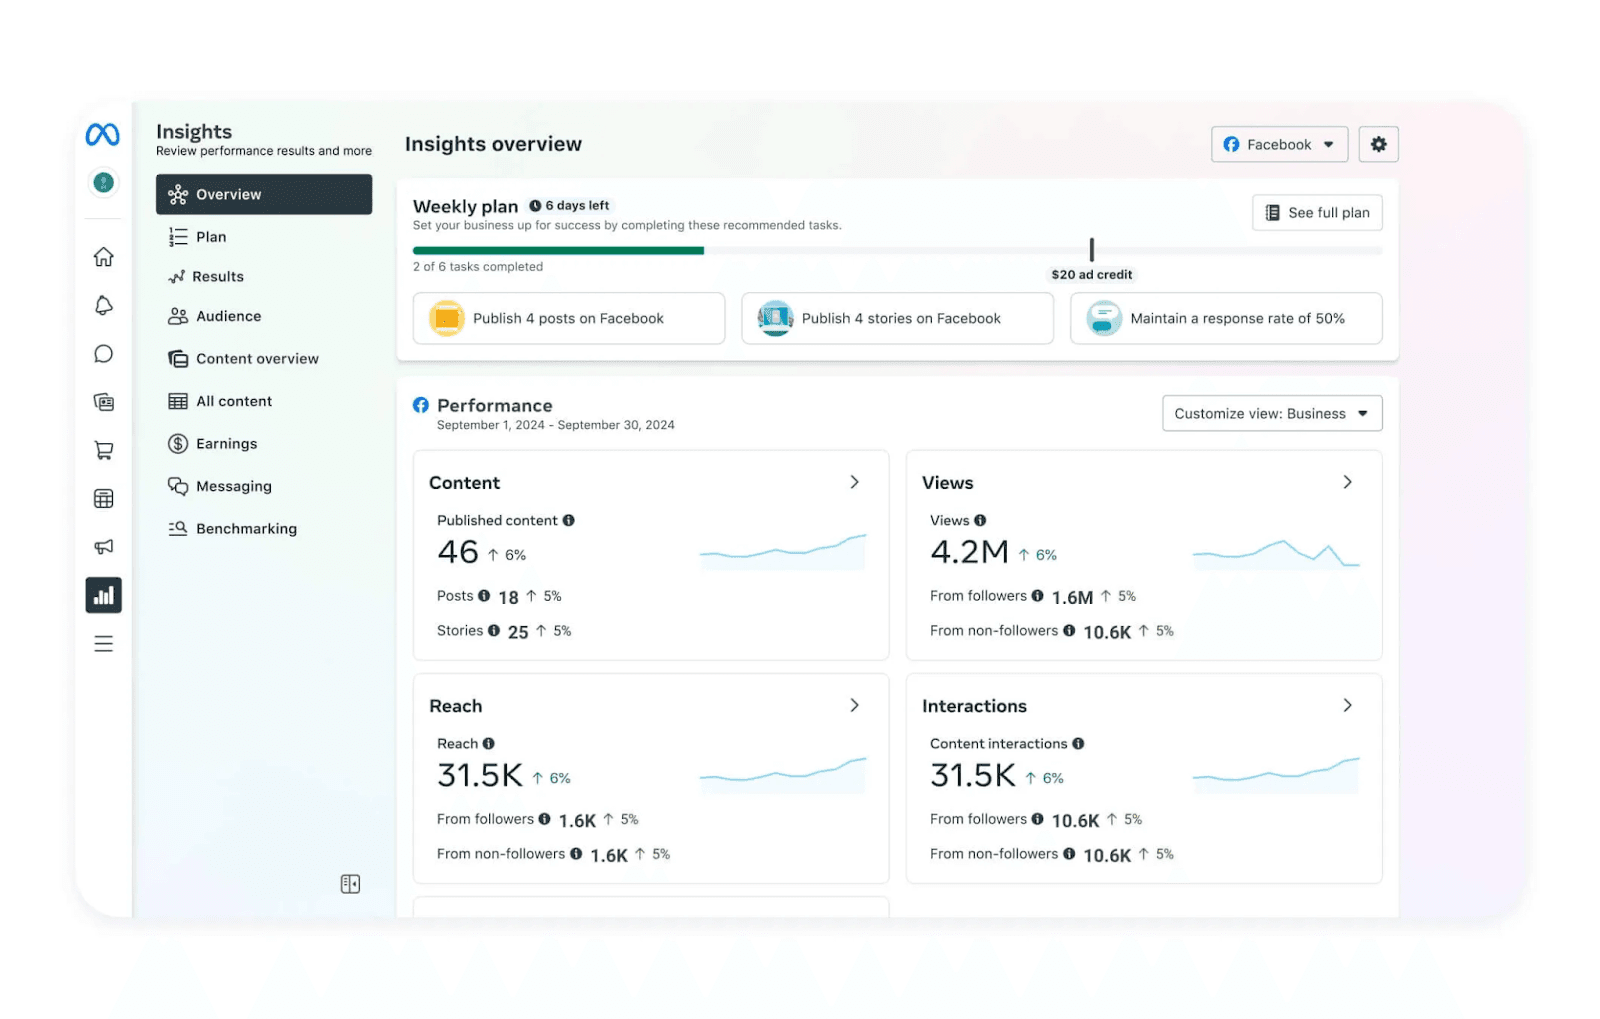
With Meta (Facebook/Instagram), there are several different sources for valuable data. Meta Business Suite, Ads Manager, and Events Manager all offer free analytics tools.
In Meta Business Suite, you’ll use the in-app Analytics for Facebook and Instagram. Toggle to “Insights” to see your metrics, including goals, results, content, and audience stats.
In Ads Manager, you’ll see an overview of paid ad campaign performance, and in Events Manager, you'll find web event data after adding a Meta Pixel code to your client’s website or setting up the Conversions API.
All three Meta options offer plenty of social media analytics to sort through–sometimes too many, especially for your busier clients. The interface can be confusing, even for the most seasoned marketers. (Not to worry: Using AgencyAnalytics’ Facebook Integration or Facebook Ads integration, your agency can pull that data into an easy-to-understand dashboard and reporting system in minutes.)
(Credit: Meta)
Pricing
Free: No subscription or usage fees; includes analytics, scheduling, ads, and inbox tools
Key Features
Cross-channel publishing for Facebook, Instagram, Messenger, and WhatsApp
Unified Inbox with automated reply capabilities and message labels
Content calendar with scheduling (including Stories, Reels) and hashtag suggestions
Insights dashboard for organic and paid content performance: reach, engagement, audience breakdown
Lead capture features: Instant Forms, appointment bookings, product tagging
Pros
Completely free and backed directly by Meta
Covers publishing, engagement, ads, and insights–all in a single dashboard
Ideal for managing multiple accounts with an intuitive inbox and scheduling tools
Cons
Data delay of 48-72 hours limits real-time analytics
No built-in benchmarking against competitors or multi-page comparisons
Technical and SEO users may find the interface less granular than dedicated tools
13. Hotjar
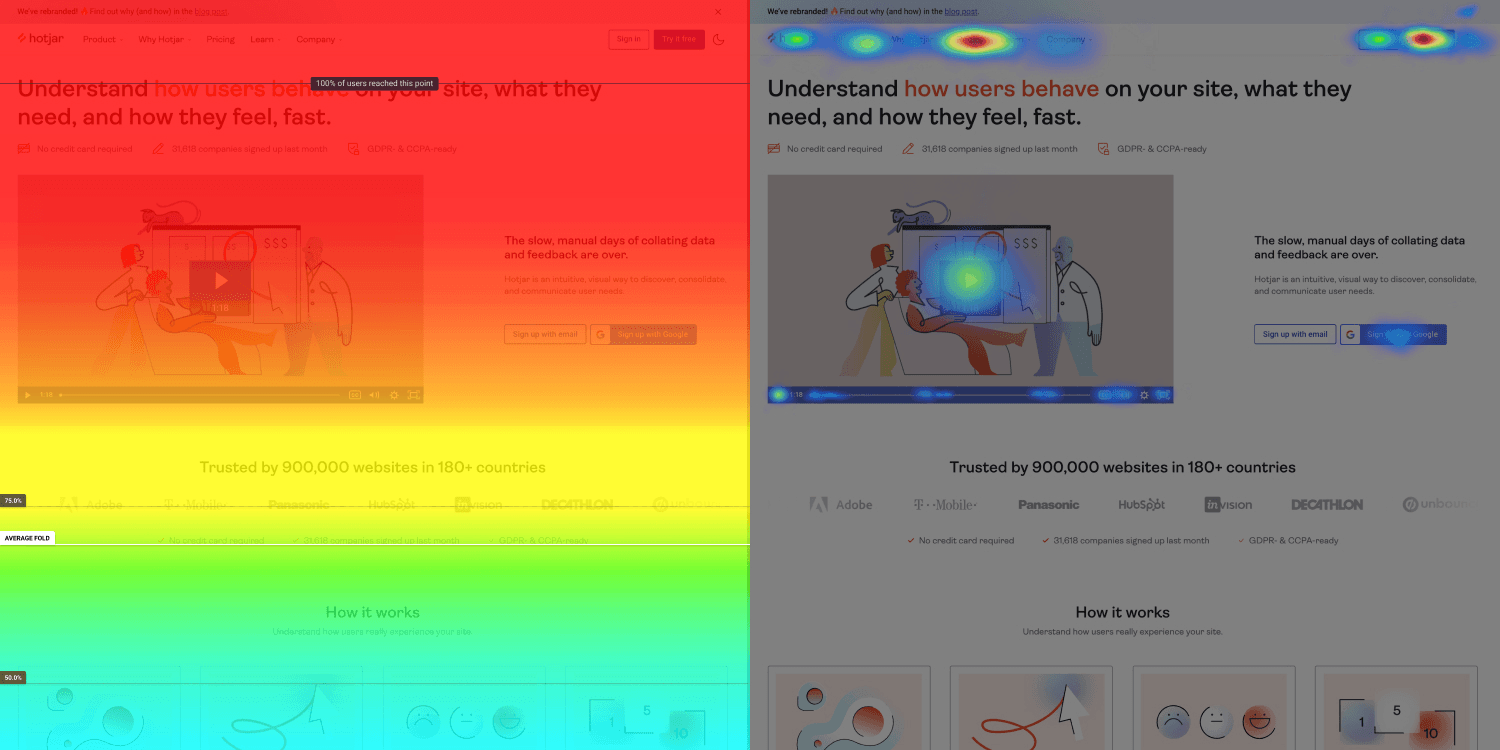
Hotjar is a versatile behavior analytics platform that combines heatmaps, session recordings, surveys, and user interviews–all in one suite. It's handy for agencies aiming to understand user interactions and analyze and produce heatmaps that positively affect user engagement.
(Credit: Hotjar)
Pricing
Hotjar splits its tools into three categories–Observe, Ask, and Engage–and each has its own pricing tiers:
Observe (heatmaps and session recordings):
Free for up to 35 sessions/day
$39/month for 100 sessions/day
$99/month for 500 sessions/day and advanced filters
$213/month for access to funnels, trends, and the API
Ask (on-site surveys and feedback widgets):
Free for up to 3 feedback widgets/month
$59/month for unlimited widgets
$79/month for advanced targeting and sentiment tools
$159/month for webhooks, API access, and a dedicated customer success manager
Engage (user interviews):
Free for 3 interviews/month using your own network
$39.20/month to recruit users through Hotjar’s participant pool
$440/month for up to 12 interviews, transcripts, and translation features
Custom pricing for enterprise plans with more interviews and premium support
Key Features
Unlimited heatmaps and session recordings with advanced filters (from Plus up)
Funnel and trend analysis available in Scale plan
Surveys, polls, feedback widgets with targeting and sentiment scoring
User interviews with automated recruitment, multi-moderator options, transcripts (Business+)
Strong integrations (Google Analytics, Slack, HubSpot, Zapier)
Pros
Highly intuitive and quick to deploy
Unlimited heatmaps and recordings even at free tier
Flexible mix-and-match modules to fit agency needs
Cons
Costs scale quickly as session, response, and interview volumes increase
Free and Plus tiers come with strict data/feature limits
Some data retention and support are gated behind higher tiers
14. Mixpanel
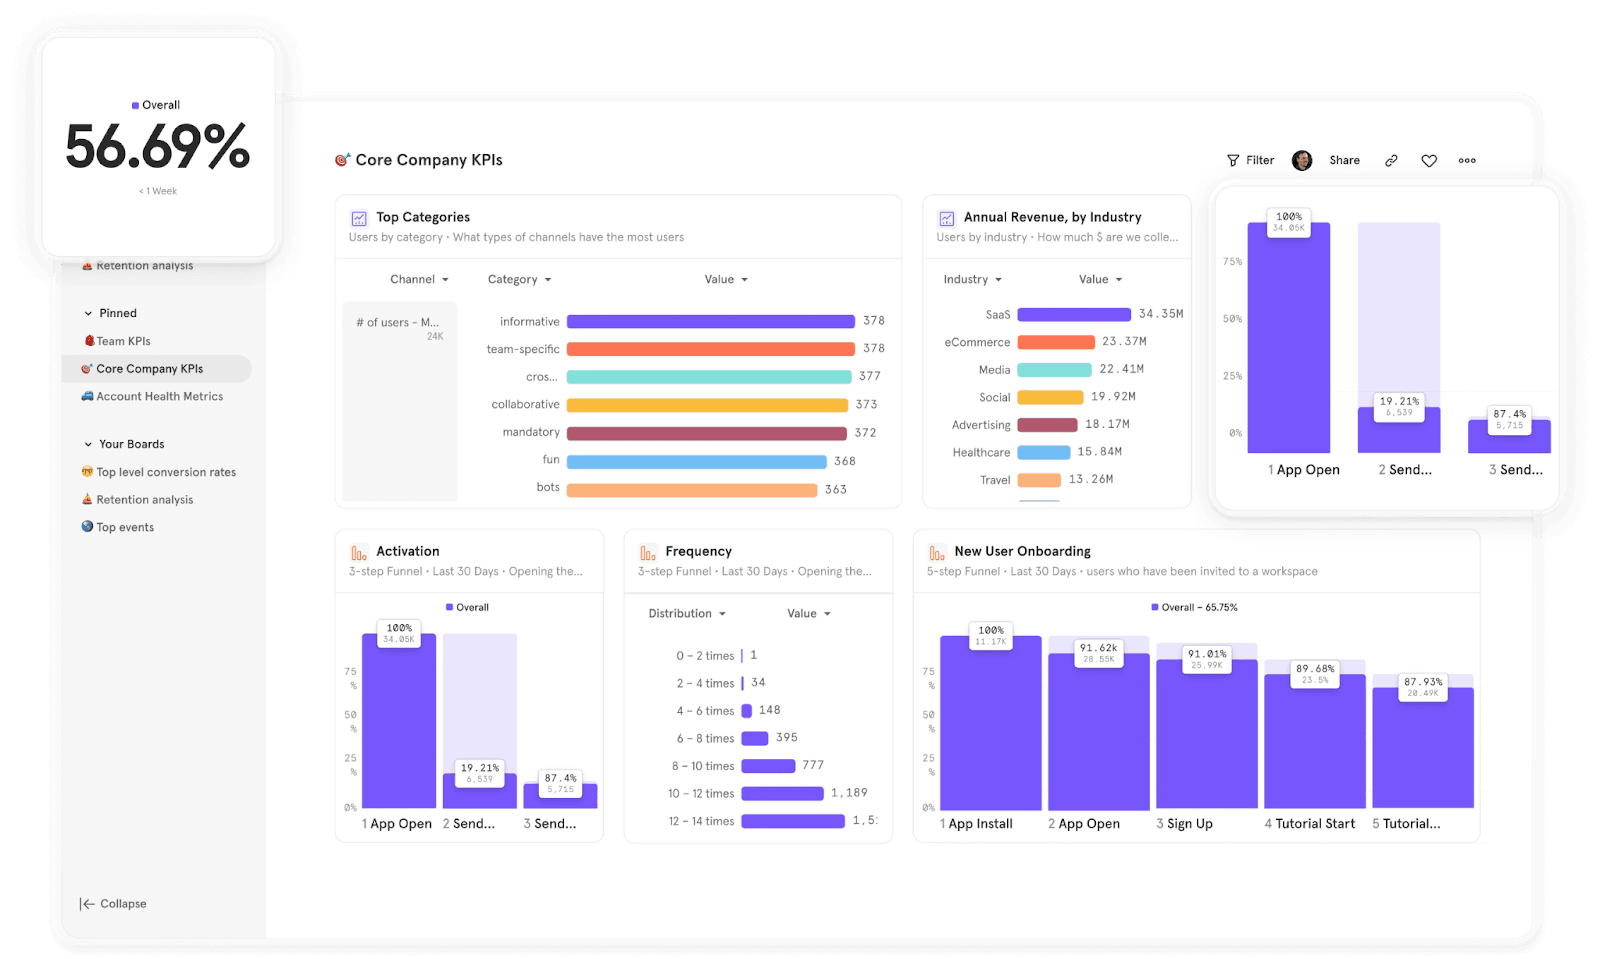
Mixpanel is a powerful product analytics platform that tracks user behavior across web and mobile apps. It offers deep insights into funnels, retention, and user flows—perfect for agencies optimizing user journeys and app performance.
Focused on web and mobile applications, Mixpanel delivers detailed insights on user interactions and behaviors. Agencies use it to segment detailed user demographics and track user engagement improvements. It’s a great option to positively affect user engagement by optimizing funnels and flows.
(Credit: Mixpanel)
Pricing
Free: Covers up to 20 million events/month; includes core reports (funnels, retention, insights), unlimited collaborators, and data history
Growth (custom pricing): Adds unlimited saved reports and cohorts, data modeling, group analytics
Enterprise (custom pricing): Supports 5 million+ events, more granular access controls, SSO, anomaly detection, and dedicated support
Key Features
Real-time event tracking and live dashboards
Funnel, retention, flow, and cohort analysis with statistical rigor
Query-time data modeling and custom event/session tracking
Unlimited collaborators and data history across plans
Integrations with data warehouses, SDKs, and advanced compliance (GDPR, SOC2)
Pros
Feature-rich free tier ideal for startups and early-stage tools
Highly customizable analysis with templates and on-the-fly modeling
Scales smoothly from free to enterprise levels
Cons
Steep learning curve–setup and advanced features require engineering support
Costs can escalate sharply based on event volume
Full feature set gated behind Growth/Enterprise–free plan limited to basics
15. Funnel.io
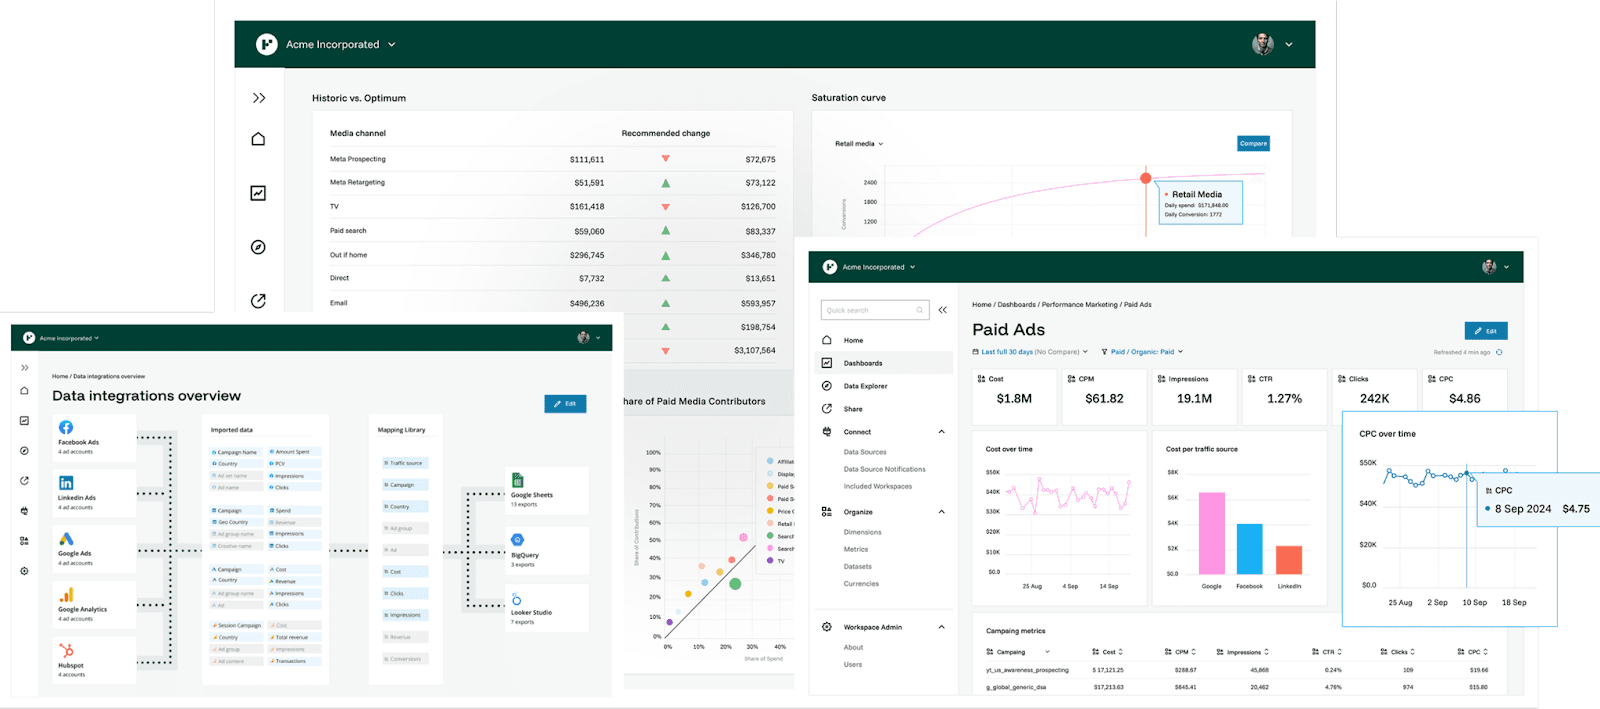
Funnel.io helps agencies centralize and model marketing data by pulling from hundreds of sources and pushing clean data into your reporting tools or warehouse. It’s built specifically for marketers and agencies seeking reliable, automated data pipelines.
The tool offers strong data integration capabilities for consolidating sources into a single view and automates data preparation and transformation at scale, which is perfect for agencies working with complex data across dozens of marketing channels.
(Credit: Funnel.io)
Pricing
Free: Includes four connectors, one destination, and 400 flexpoints (~usage budget) at no cost
Starter (pricing on request): Entry plan with 121 connectors, basic reporting, and starts from 500 flexpoints
Business (pricing on request): Adds 579+ connectors, custom integrations, advanced export options, advanced measurement modules; also starts from 500 flexpoints
Enterprise (pricing on request): Tailored for large organizations with flexible connector use, enterprise governance, and dedicated support
Key Features
600+ native connectors to sources like Google Ads, Facebook, TikTok, GA4, Shopify
Centralized Data Hub with auto schema updates and flexible data transformations
Exports to destinations including Looker Studio, BigQuery, Excel, and BI platforms
Advanced measurement module: includes marketing mix modeling and smart attribution via AI
Historical data retention (~2 years) with full revisability and event reprocessing
Pros
Highly customizable
Support for hundreds of connectors makes it hard to run out of integrations
Buffers schema/API updates transparently to prevent data breakage
Cons
Flexpoint-based pricing can be unpredictable, and heavy usage is expensive
No native customizable reporting or white label dashboards–you’ll need a BI tool to build client visuals
Some features, like advanced analytics and custom connectors, require business/enterprise tiers
16. Tableau
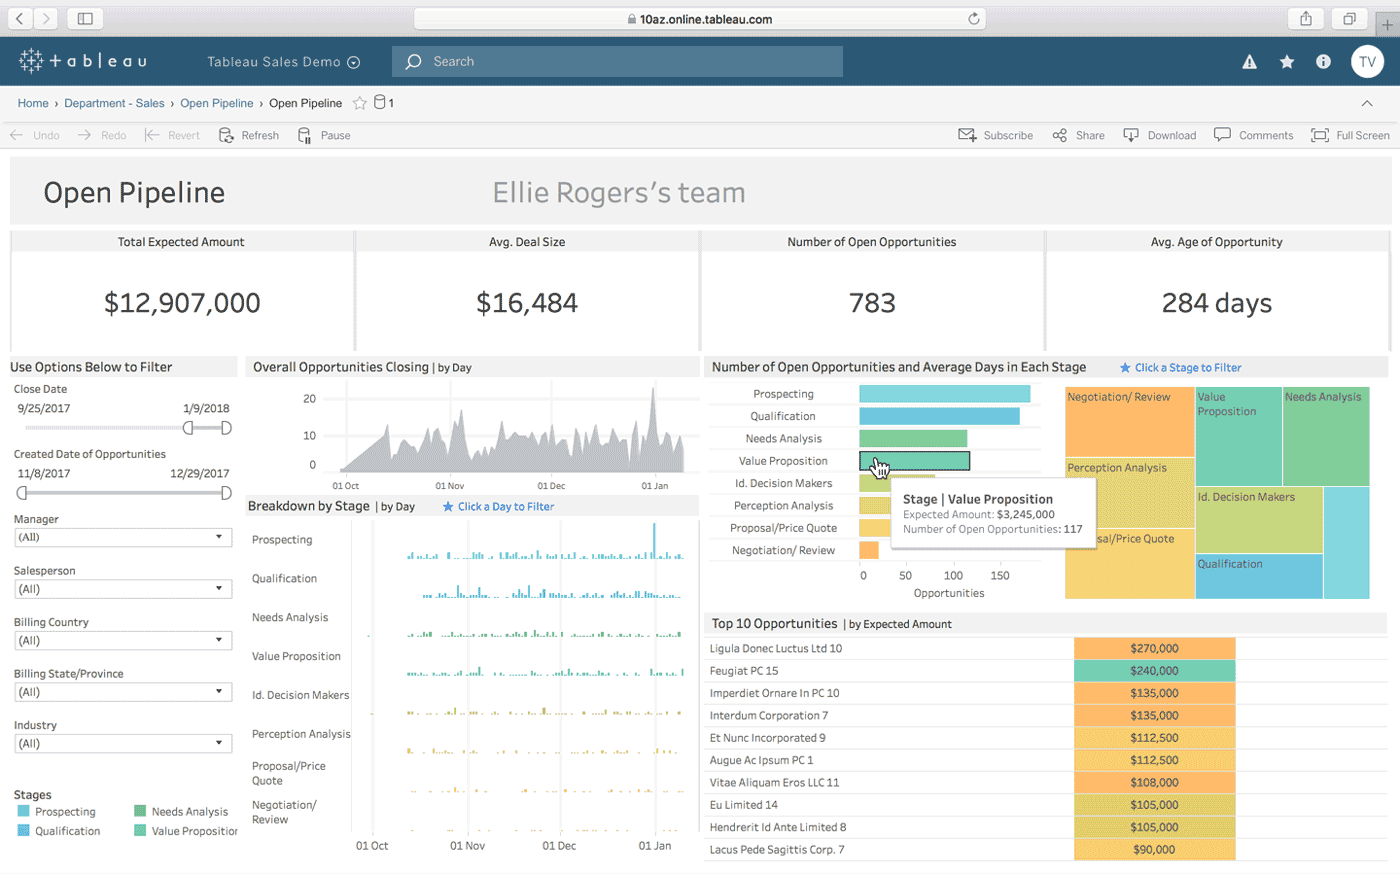
Tableau is a business intelligence and data visualization platform that helps agencies turn complex marketing analytics data into interactive, visual dashboards. It’s excellent for sharing insights across clients and teams, whether through cloud or self-hosted deployments.
(Credit: Tableau)
Pricing
Viewer ($15/user/month): Dashboard access, filtering, exporting–no editing
Explorer ($42/user/month): Interact with, edit, and explore dashboards (no advanced prep)
Creator ($75/user/month): Full data prep (Tableau Desktop & Prep) and dashboard creation
Tableau+ (custom pricing): Adds AI tools like Tableau Pulse, advanced management, only for Tableau Cloud
Server/Cloud Enterprise (custom pricing): Includes governance, data management, and multi-site support
Key Features
Drag-and-drop analytics with powerful visualization options and mobile-friendly dashboards
Connects to files, databases, cloud data warehouses, and web APIs
Offers robust data prep and cleaning with Tableau Prep Builder (Creator tier)
AI-powered insights with Tableau Pulse and Agents (Cloud/Creator tiers)
Pros
Intuitive drag-and-drop interface with rich, shareable visuals
Strong mobile support and real-time data refresh capabilities
AI features (Pulse, Agent) available for enhanced analysis and automation
Cons
Licensing can be pricey, especially Creator seats needed before Explorer or Viewer licenses
Custom visualization and formatting options are limited compared to code‑based tools
On-premise setup and governance require IT resources and infrastructure
17. Segment
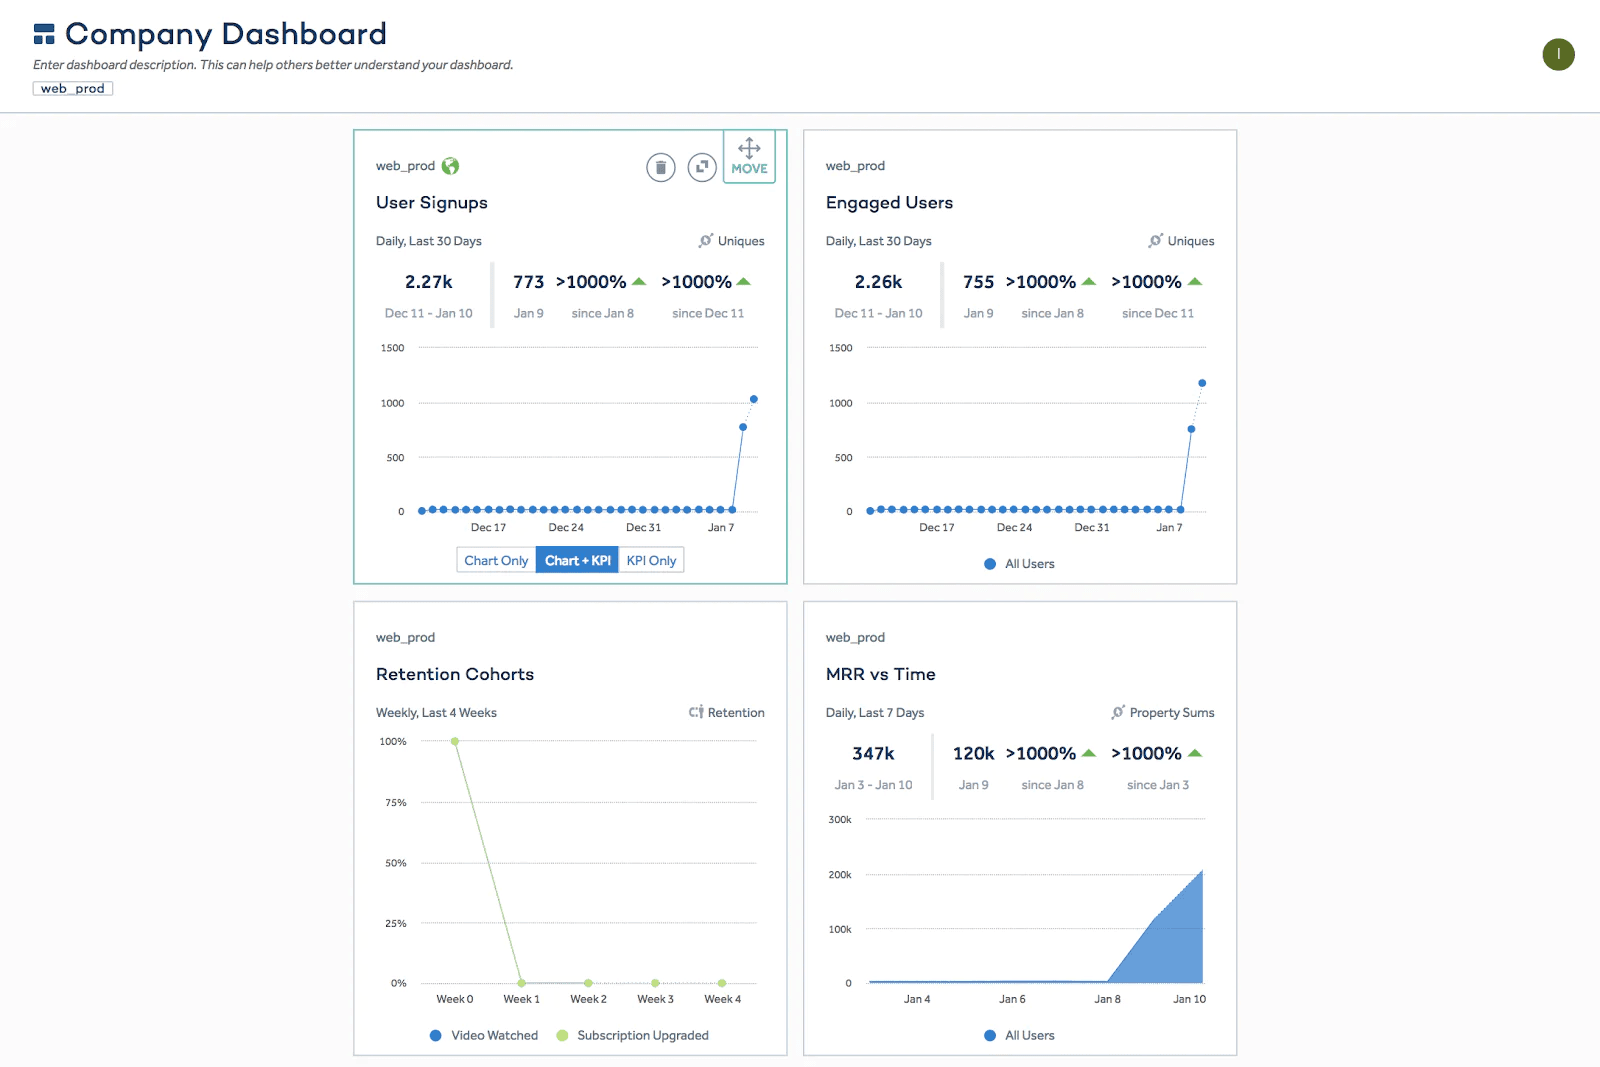
Segment unites customer data from web, mobile, server, and third-party sources, sending clean, governed data to analytics, marketing, and data warehouse destinations. It’s tailor-made for agencies that need reliable pipelines and a unified client view, without wrangling custom code.
Segment excels at data integration capabilities and data mapping across tools. It’s great for performing automated data categorization and unifying client data. Data analysts often use Segment to build real-time customer profiles.
(Credit: Segment)
Pricing
Free: Up to 1,000 tracked visitors/month, 2 data sources, 1 destination; access to 450+ integrations
Team (from $120/month): For 10,000 visitors/month; + $10 per extra 1,000 visitors
Business (custom pricing): Includes unlimited sources, data governance, identity resolution, and features like HIPAA support
Key Features
450+ built-in connectors for web, mobile, CRM, ads, and warehouses
Real-time event collection, transformation, and schema enforcement via Protocols and Functions
Profile unification (CDP) with identity resolution and audience building for campaigns
Predictive AI and generative audience creation tools
Pros
Flexible, marketer-friendly pipelines without developer overhead
Massive integrations library and resilient schema handling
Scalable–from basic tracking to enterprise-level CDP with identity management
Cons
Flexpoint and MTU-based pricing can escalate quickly
UI isn’t intuitive for non-technical users, and advanced features require training
No native reporting or dashboarding–you’ll need a business intelligence tool like Tableau or Looker
18. Domo
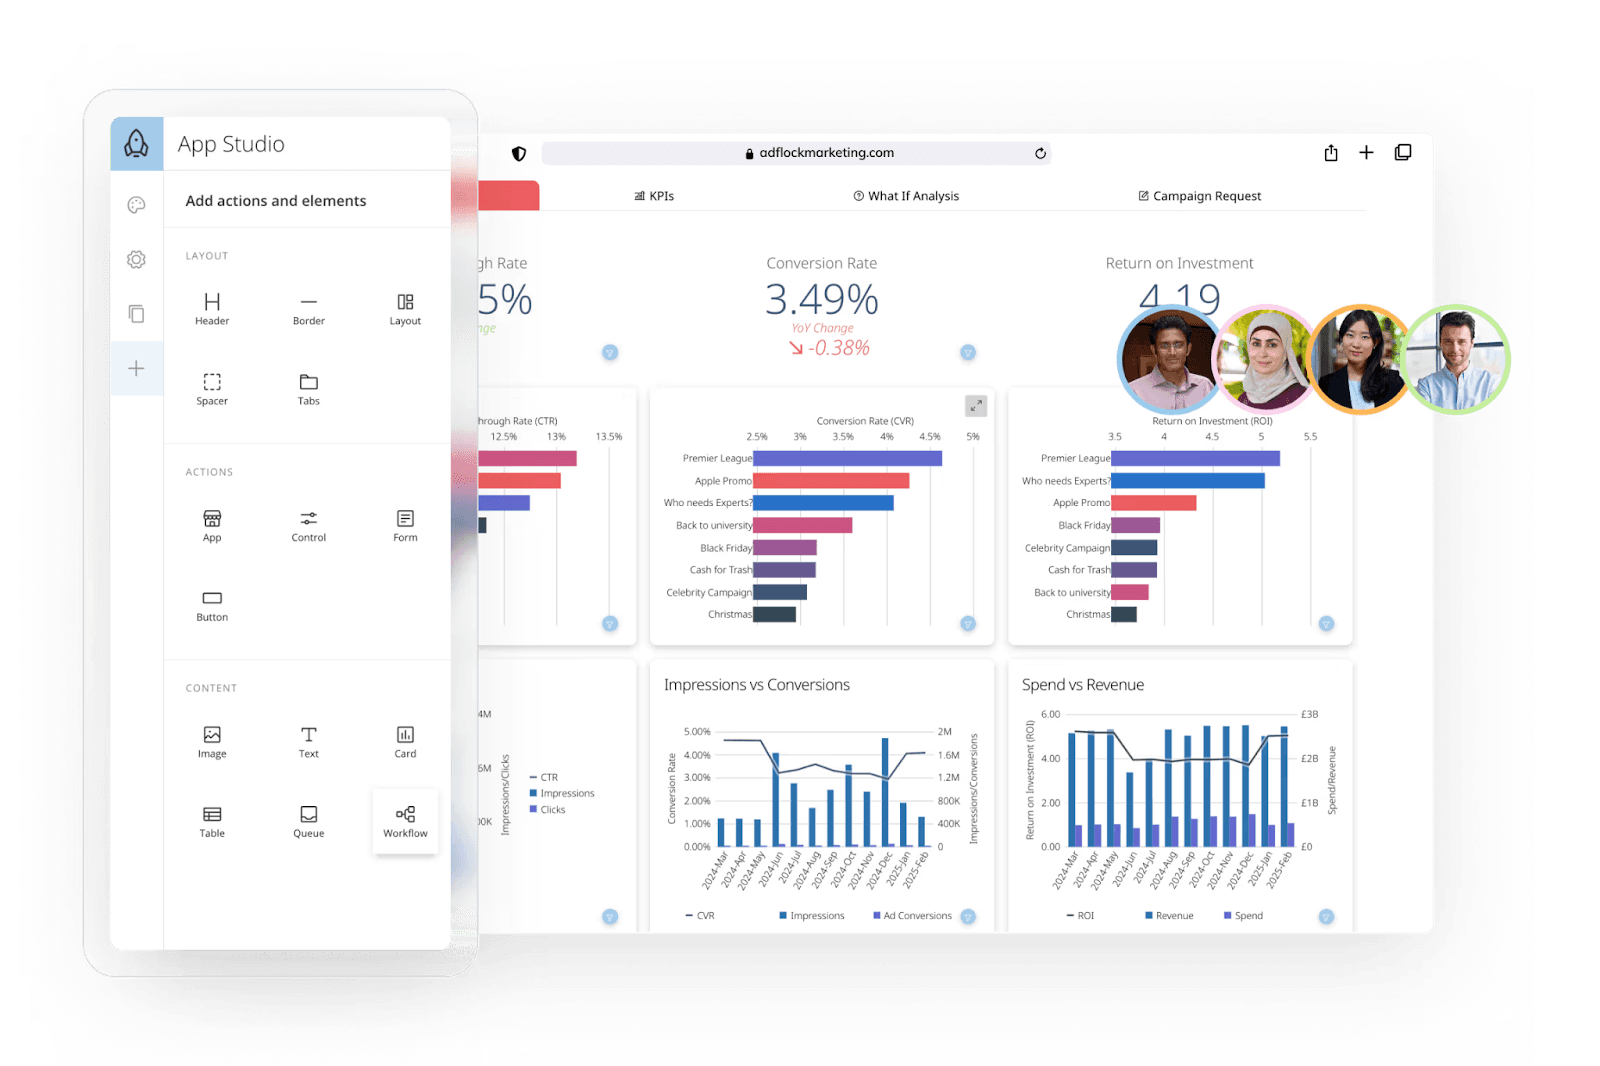
Domo is a cloud-based BI and analytics platform built to scale. It is perfect for agencies juggling a mix of data sources, marketing platforms, and reporting needs. It brings all your data into one centralized, real-time view and makes it easy to build interactive dashboards, automate workflows, and share insights across teams or with clients.
Domo supports advanced data processing tasks and handles complex data from hundreds of sources. It’s ideal for agencies managing business data across multiple marketing channels, and includes built-in tools for data preparation, transformation, and visualization.
(Credit: Domo)
Pricing
Free trial: Full platform access, unlimited users, one training session–30-day duration
Paid (Standard / Enterprise / Business Critical): Pricing based on credit consumption User seats are unlimited–cost driven by data volume, refreshes, requests, and visualizations
Key Features
1,000+ native connectors to data sources like Excel, Shopify, cloud databases
Interactive dashboards, embedded analytics, mobile-ready views
Workflow automation: alerts, scheduled reports, APIs
Built-in AI tools: Predictive analytics, custom AI agents, anomaly detection
Enterprise governance: SSO, encryption, user roles, HIPAA compliance options
Pros
Unlimited users included–only usage consumes credits, not seats
Scalable platform ideal for high-volume data
Strong flexibility: ETL, BI, workflows, and AI all in one platform
Cons
Small teams face ROI challenges–the platform often costs upwards of $20K/year
Some features (SQL transforms, federated data) can be slow
Steep learning curve–the interface and credit model take time to understand
Impress clients and save hours with custom, automated reporting.
Join 7,000+ agencies that create reports in under 30 minutes per client using AgencyAnalytics. Get started for free. No credit card required.
Already have an account?
Log inHow To Choose the Right Marketing Analytics Software for Your Agency
There’s no universal “best” analytics tool. The right fit depends on your team’s size, your client base, and how you actually run campaigns and report results.
For Small Teams or Freelancers
If you’re a one-person show or part of a tight-knit team, time is your most valuable asset. You need something simple, fast, and intuitive. Bonus if it’s free or low-cost.
Tools that offer prebuilt dashboards and out-of-the-box integrations are ideal. You’re not here to fiddle with setup; you just want to plug in and get results.
For Mid-Sized Agencies
You’ve got 10, 20, maybe even 30 clients on your plate. The stakes are higher, and client expectations are more complex. You need automation, templated dashboards, and a way to manage multiple campaigns without drowning in data.
A solid white label setup helps keep everything polished and on-brand. And don’t underestimate how much time you’ll save with scheduled reports and real-time alerts.
For Larger, Scaled Agencies
At this level, you’re juggling teams, departments, and a wide range of services–consistency matters.
You need tools that standardize data across clients, offer deep customization, and help you forecast, benchmark, and optimize at scale. Bonus if they come with priority support and a customer success team that knows how agencies work.
For Specialists (SEO, PPC, Social)
If your agency focuses on one area, like SEO or paid media, go deep instead of wide.
The right tool should give you access to granular insights–rankings, link audits, cost-per-click, audience targeting–without making you click through five menus to find what matters. With AI tools transforming data analysis, it’s even easier to dig into what’s working, fix what’s not, and explain it all clearly to clients.
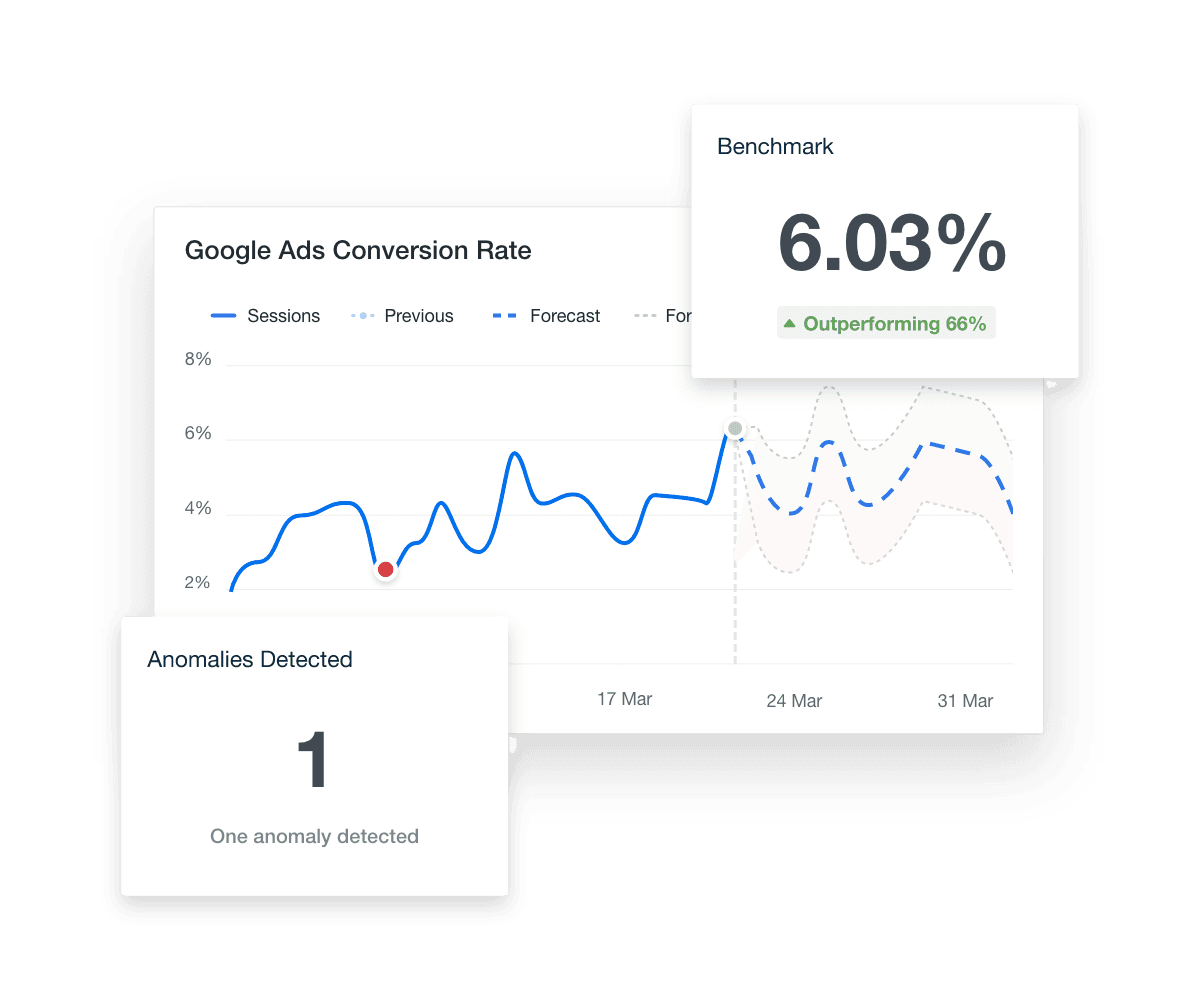
Surface the insights that show your clients the measure of their success with benchmarks, anomaly detection, and trend forecasting built into AgencyAnalytics. Try it free today!
How To Make the Most of Your Marketing Analytics Tools With AgencyAnalytics
Once your marketing tools are in place, the next step is to make them work together for your team.
That’s where a centralized platform helps.
AgencyAnalytics automates data collection by pulling marketing analytics data from the tools you’re already using–whether that’s GA4, Search Console, Ahrefs, HubSpot, or LinkedIn—and helps you create custom-tailored digital marketing dashboards.
Instead of switching between tabs or chasing down screenshots, your team has one place to work from. Clients get consistent updates, and your reporting process doesn’t get in the way of your strategy work.
With AgencyAnalytics, you’ll build templates to reuse across accounts, set up alerts to catch issues early, and create reports that surface the metrics your clients care about most. And because everything is fully white-labeled, your agency stays front and center.
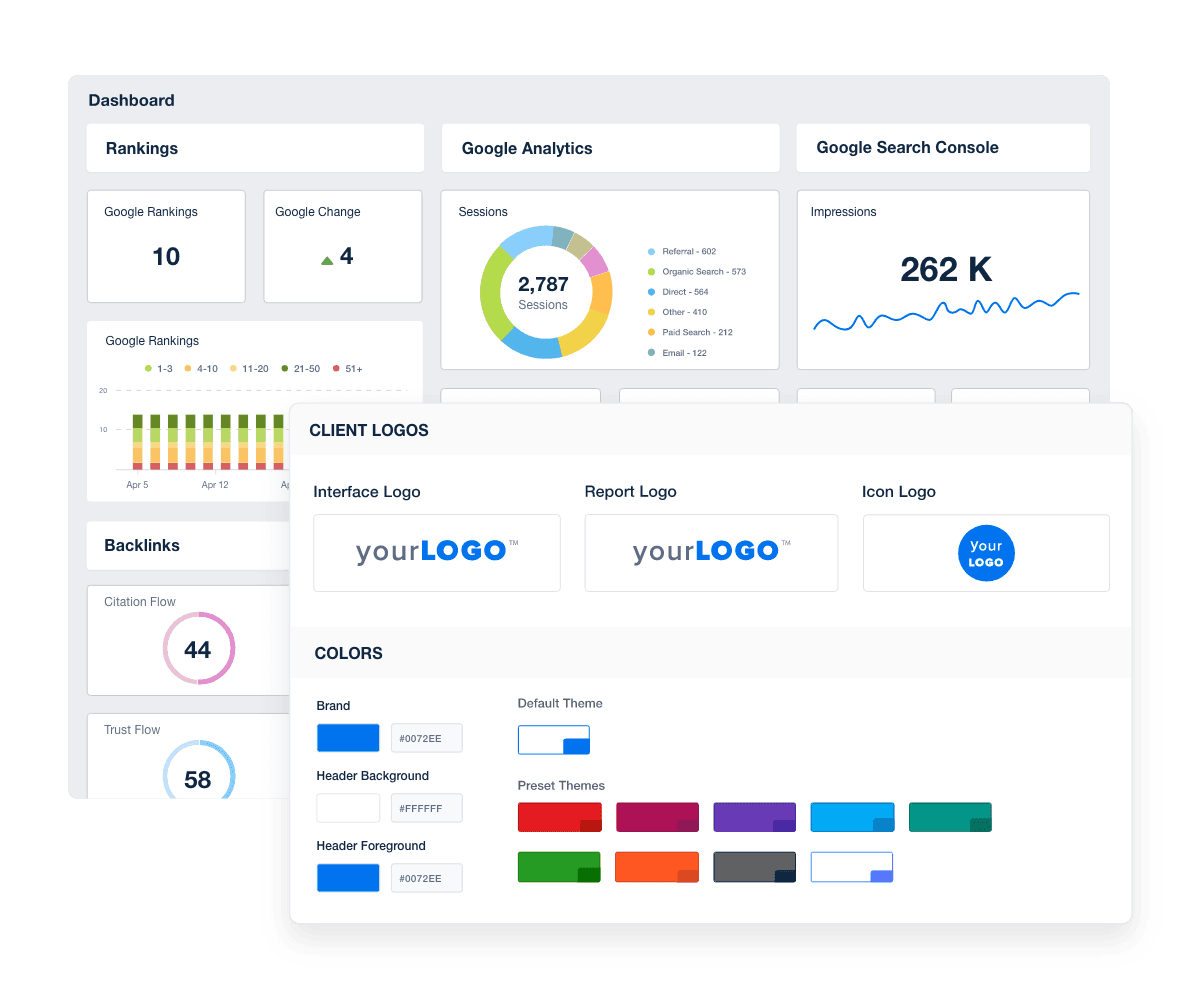
The goal isn’t just to collect your client’s campaign data. It’s to make your wins visible and your decisions easier. AgencyAnalytics helps you do that–without adding more to your plate.
Agency Pro Tip: Want to save hours every week? Use AgencyAnalytics to build the best marketing dashboards with pre-built integrations for SEO, PPC, social, and web analytics. AgencyAnalytics’ marketing report templates and unified dashboard solution make it easy to keep clients informed, without the spreadsheet chaos.
The Right Data Analysis Tools Save Time and Help Retain Clients
You already know your work matters. But unless clients see the results, it’s hard to prove your value.
Marketing analytics tools take the guesswork out of performance. They give you the numbers you need to make better decisions, move faster, and keep clients in the loop without chasing down data across multiple platforms.
Choose tools that fit your services. Streamline your reporting. Automate what you can.
When your team spends less time on busywork, they have more time to focus on what drives growth.
FAQs About Marketing Analytics Tools & Software
Get answers about the best marketing analytics software tools and how agencies use them to drive data-driven growth.
The best marketing analytics software depends on your agency’s size, client goals, and preferred reporting workflows. For full-service teams, an all-in-one marketing analytics platform like AgencyAnalytics provides the flexibility to integrate marketing data from multiple channels, including SEO, PPC, and social media platforms, into a single, visual dashboard.
Compared to standalone ad analytics tools or email marketing platforms, unified marketing analytics solutions make it easier to monitor key metrics, automate reports, and tie performance directly to business goals.
Agency Tip: The right marketing analytics tool doesn’t just measure—it interprets. Use customizable dashboards and reports to highlight KPIs that demonstrate ROI and drive effective marketing campaigns across multiple touchpoints.
Modern marketing analytics tools give agencies the ability to gain insights from raw data, automate repetitive workflows, and reveal user behaviors that guide strategy. By integrating data across multiple sources, these platforms deliver a complete picture of your clients’ digital marketing efforts—from website visitors and social media performance to email marketing campaigns and PPC campaign analysis.
Data automation features and automated insights remove the need for manual reporting, enabling users to focus on optimization and creative strategy. With data-driven insights and behavioral analytics, agencies quickly identify trends, refine audience targeting, and improve conversion rates for every campaign.
The ideal marketing analytics platform enables marketers to combine data from multiple social networks, email marketing platforms, and big data platforms into one unified system. Look for analytics features that simplify data aggregation, data storage, and data sampling—especially if you’re managing large accounts or analyzing campaigns across various organic, PPC, or social media platforms.
You’ll also want the ability to create custom metrics that match client KPIs. Whether your team manages social media campaigns, SEO topic research tools, or paid ads, the right marketing analytics solution empowers marketing analysts to compile data, calculate metrics efficiently, and deliver data-driven insights that connect to the entire customer journey.
Some of the best marketing analytics software now includes predictive analytics and behavioral analytics capabilities. These models analyze historical traffic data, engagement rates, and purchase patterns to anticipate future customer behavior and segment audiences into detailed user segments.
By applying AI-driven forecasting, agencies design personalized marketing campaigns that enhance user engagement and deliver instant insights across SEO optimizations, social media strategies, email marketing campaigns, and paid channels. Predictive modeling within digital marketing analytics tools transforms traditional reporting into proactive planning—helping agencies stay ahead of future trends and client expectations.
A marketing analytics agency gains efficiency and consistency through automation. Leading marketing analytics solutions include tools that automate client reporting, manage data, and provide customizable dashboards and reports that are easy to share.
When you integrate marketing data from multiple channels—SEO, PPC, social media analytics, and email marketing platforms—you eliminate silos and save hours every week. Automated reporting workflows ensure business users and clients always have access to real-time performance insights without exporting spreadsheets.
Agency Tip: The AgencyAnalytics platform goes beyond basic analytics. It allows you to integrate data, monitor key metrics, and provide data-driven insights faster—all in one intuitive dashboard.
The most powerful digital marketing analytics tools are designed to support marketing automation platforms and social media management tools, ensuring data flows seamlessly across multiple channels. These integrations enable marketers to analyze performance holistically, from social media analytics to email nurture paths.
When agencies combine data from different sources, they uncover user behaviors, understand customer behavior across the entire customer journey, and deliver more customer-centric measurement. This helps marketing teams tailor creative, optimize ad spend, and align business goals with outcomes.
By using ad analytics software alongside your marketing analytics platform, you’ll create a connected ecosystem of digital marketing analytics that drives real-world results and measurable ROI.
Modern marketing analytics software isn’t just about dashboards—it’s about decisions. Whether your agency is tracking social media performance, refining marketing contacts, or evaluating conversion rates, the right marketing analytics tools help you transform data into action.
By focusing on data aggregation, data automation, and integrating data across multiple sources, agencies position themselves for smarter, faster, and more predictive growth in the age of agentic analytics platforms and AI-enhanced insights.

Written by
Francois Marchand brings more than 20 years of experience in marketing, journalism, content production, and artificial intelligence (AI). His goal is to equip agency leaders with innovative strategies and actionable advice to succeed in digital marketing, SaaS, and ecommerce.
Read more posts by Francois MarchandSee how 7,000+ marketing agencies help clients win
Free 14-day trial. No credit card required.


