NOW AVAILABLE: Unlock Data-Driven Insights with AI, Benchmarks, Anomaly Detection & Forecasting
Report TemplatesMatomo Report

Matomo Report

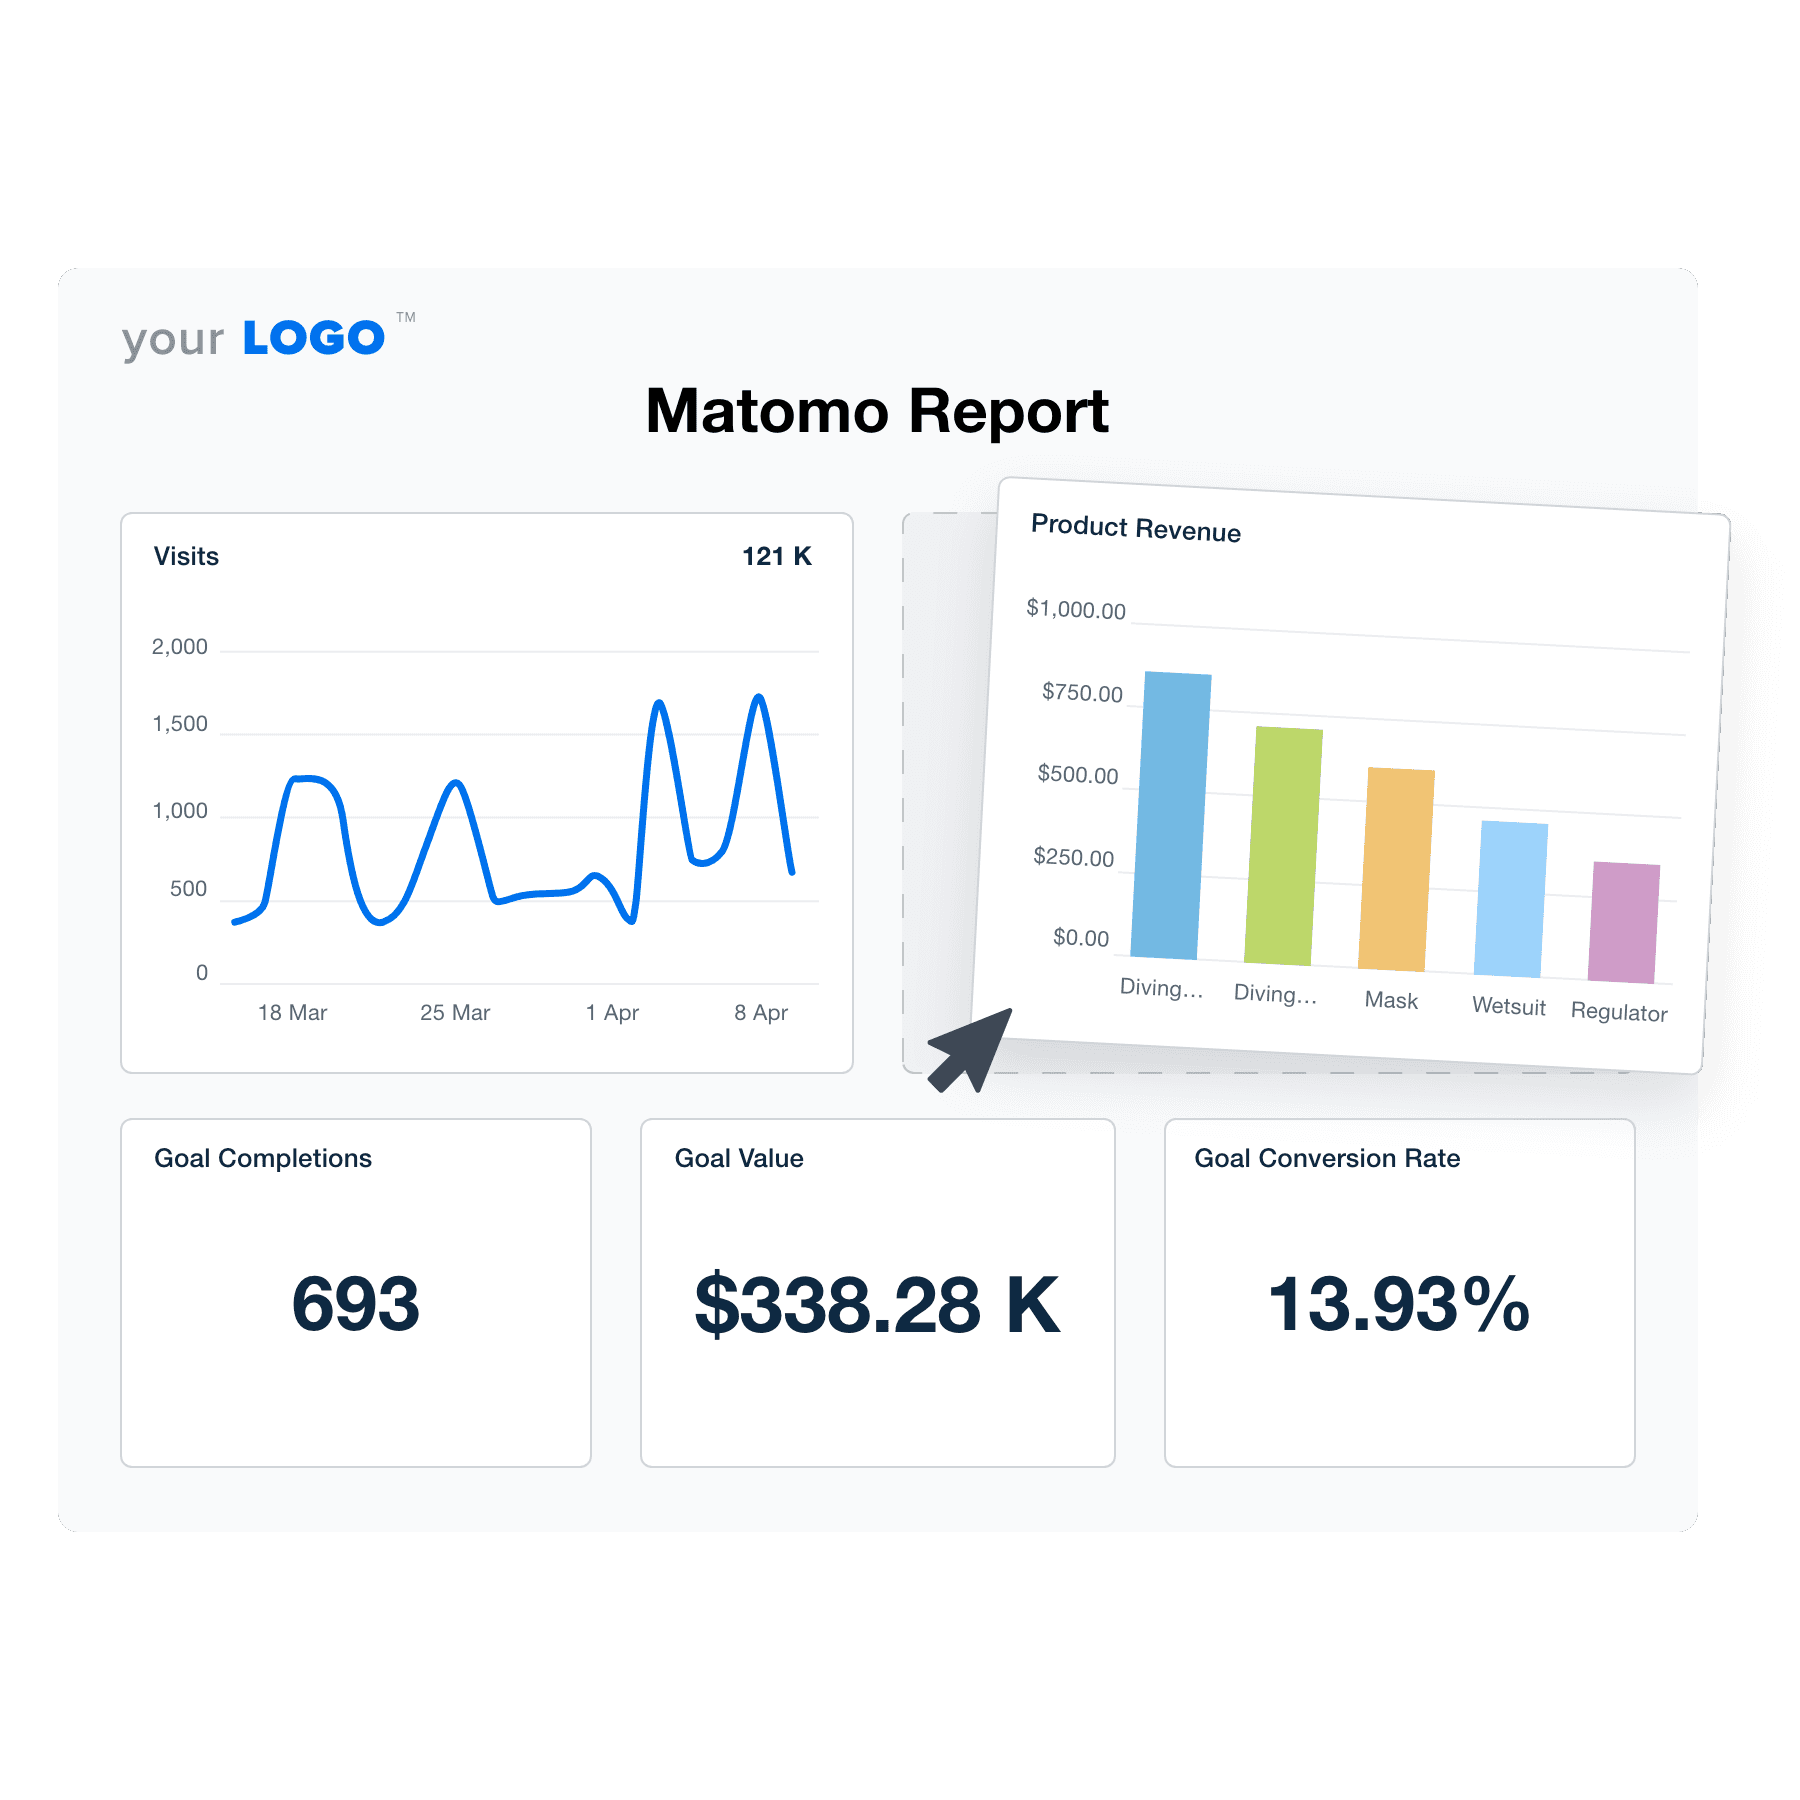
Boost your agency’s efficiency with a Matomo report template. No more manual data collection—this tool automatically streams metrics into a visual, easy-to-understand format. Streamline report preparation, enhance operational efficiency, and deliver actionable insights to your clients.
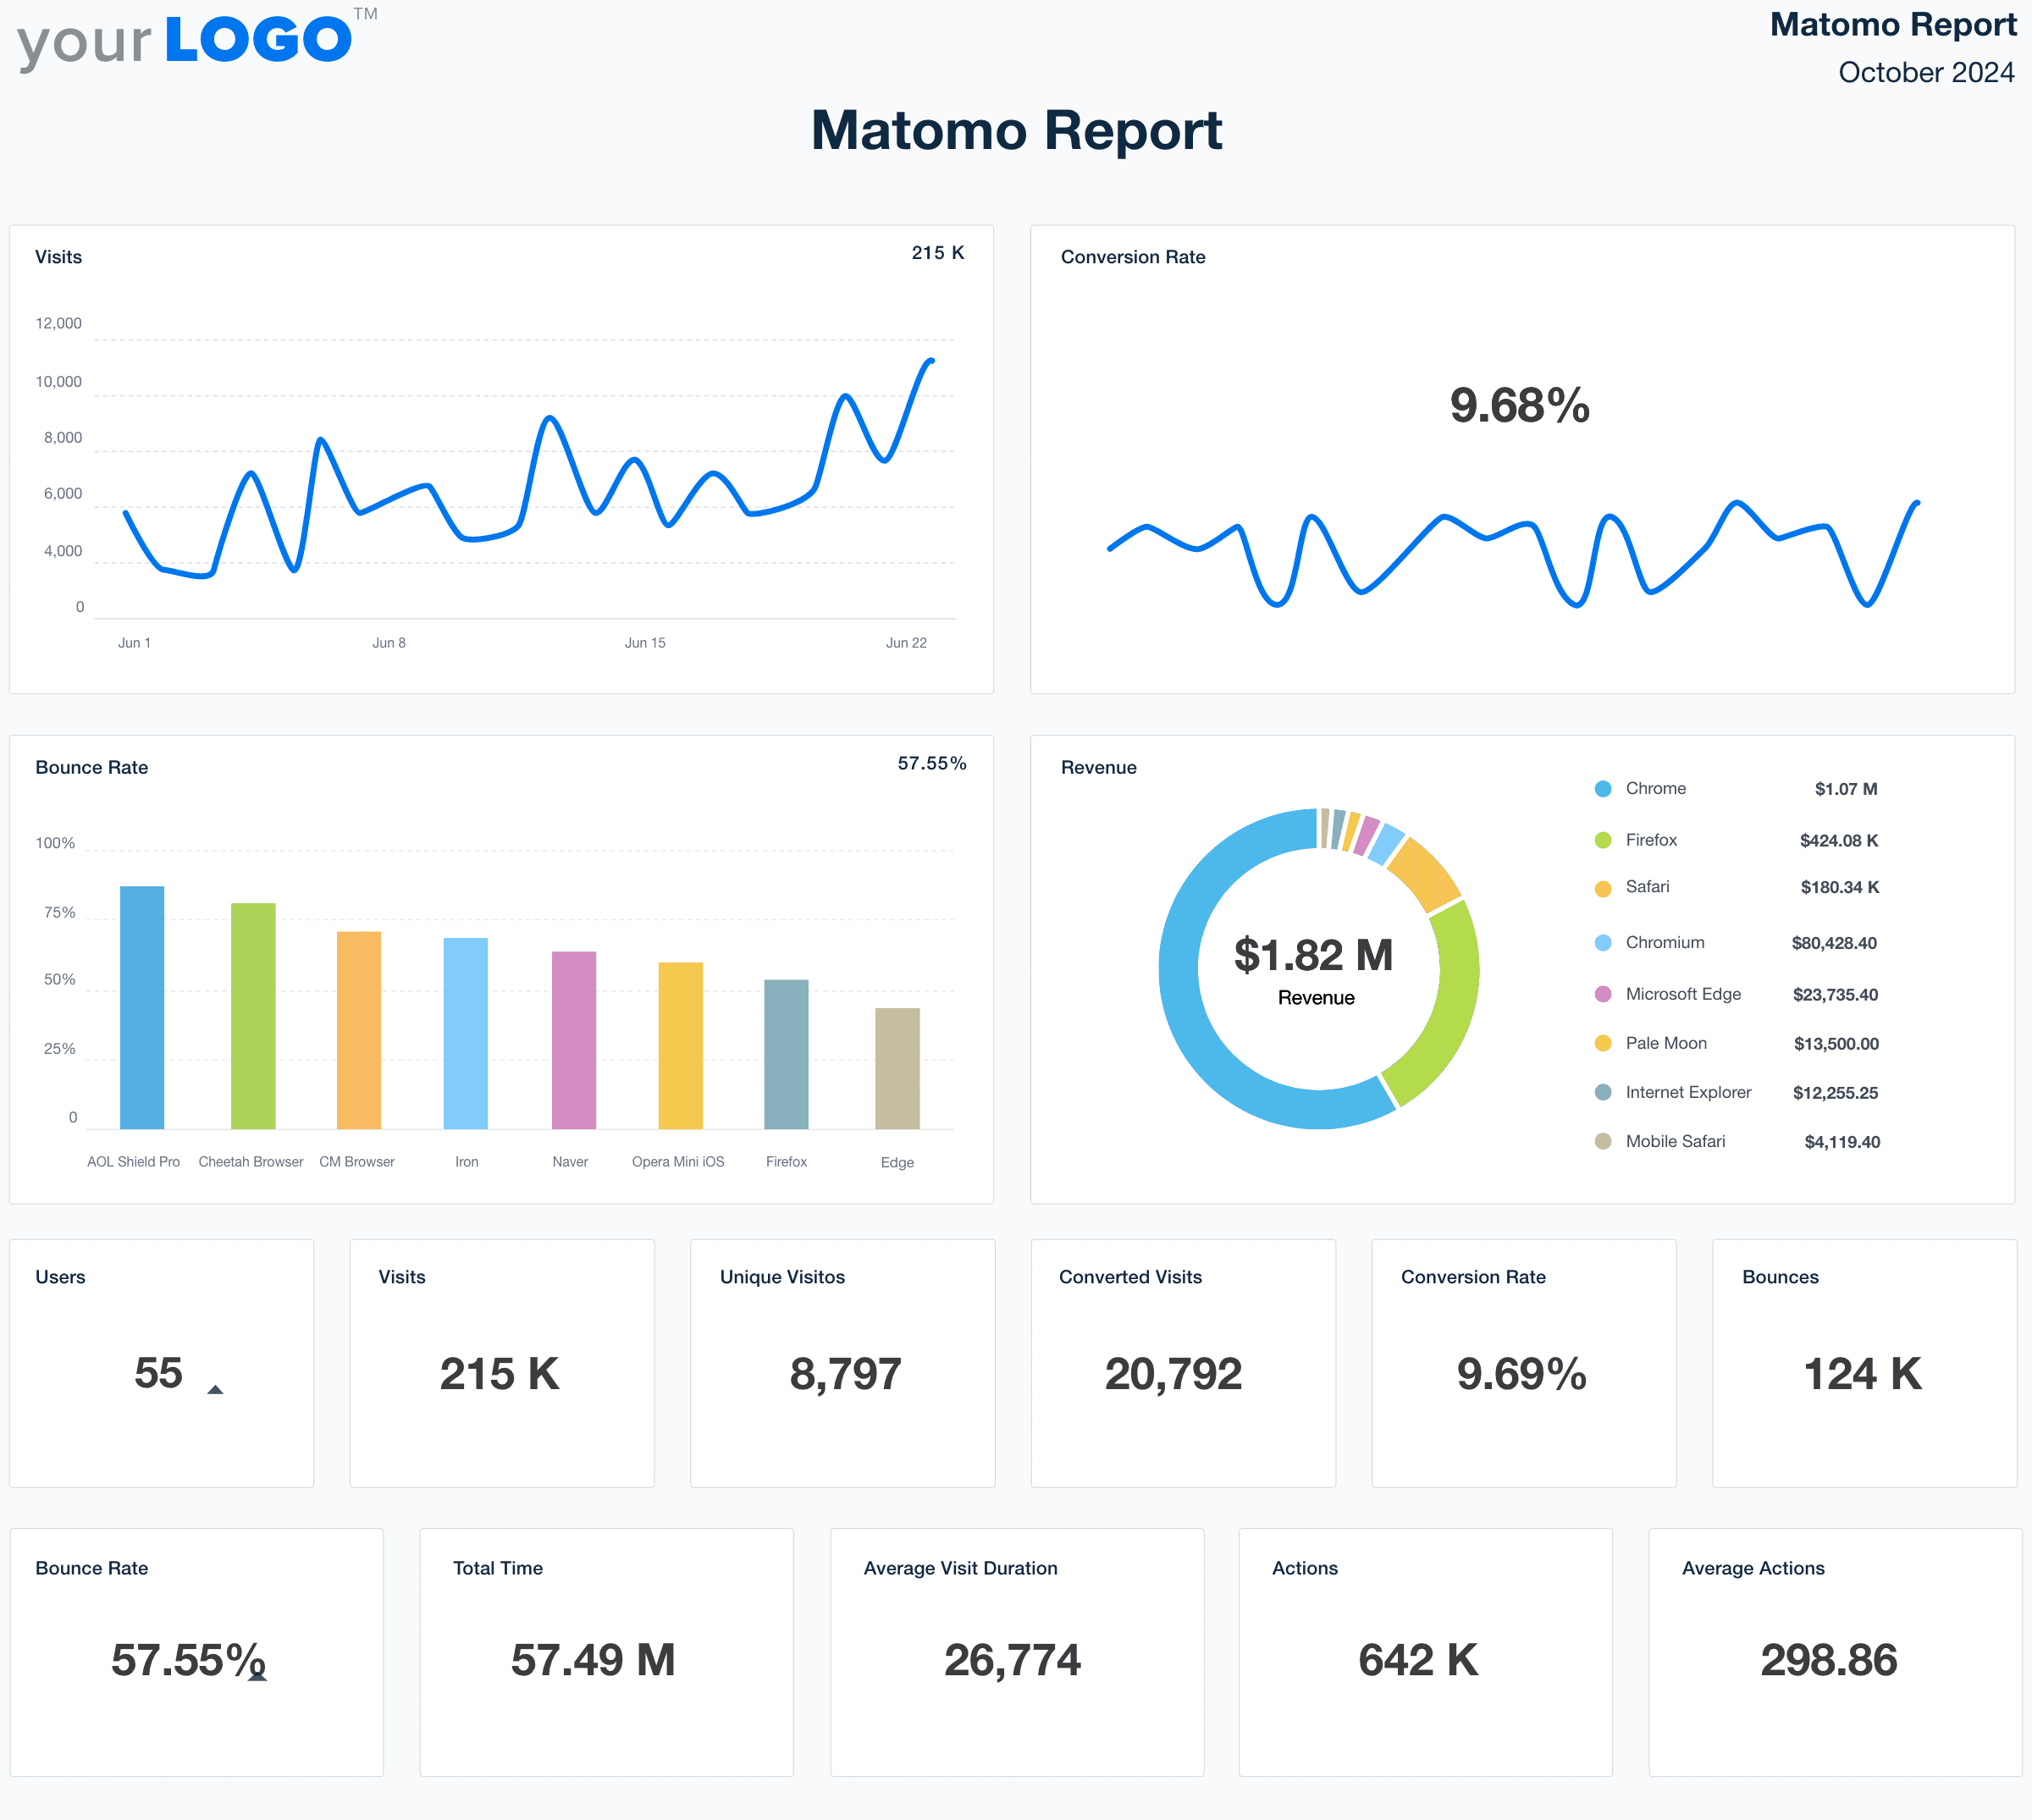
Matomo Report Template Example

Why Your Agency Needs a Matomo Report Template

A Matomo report template isn’t just another doc—it’s a smart approach to data management.

With this tool, there’s no longer a need to take unsightly screenshots or type metrics into a spreadsheet. Data retrieval is an automated process, which means you’ll have more billable hours to invest in what truly matters: delivering outstanding results. 

When everything is cleanly formatted, it’s much easier to communicate critical insights with clarity and precision. This helps clients understand the impact of your work, highlighting what matters without the fluff. Need a bit of customization? Not a problem. Add widgets from 80+ platforms, toggle with size dimensions and shift things around–it’s all up to you.

A Matomo report template is a way to ensure data accuracy, improve efficiency, and show clients you’re the right fit for their needs. 

Create Professional Matomo Reports in Minutes
Start Your Free Trial Today

11 Sections To Include in a Matomo Report Template

1. Cover Page

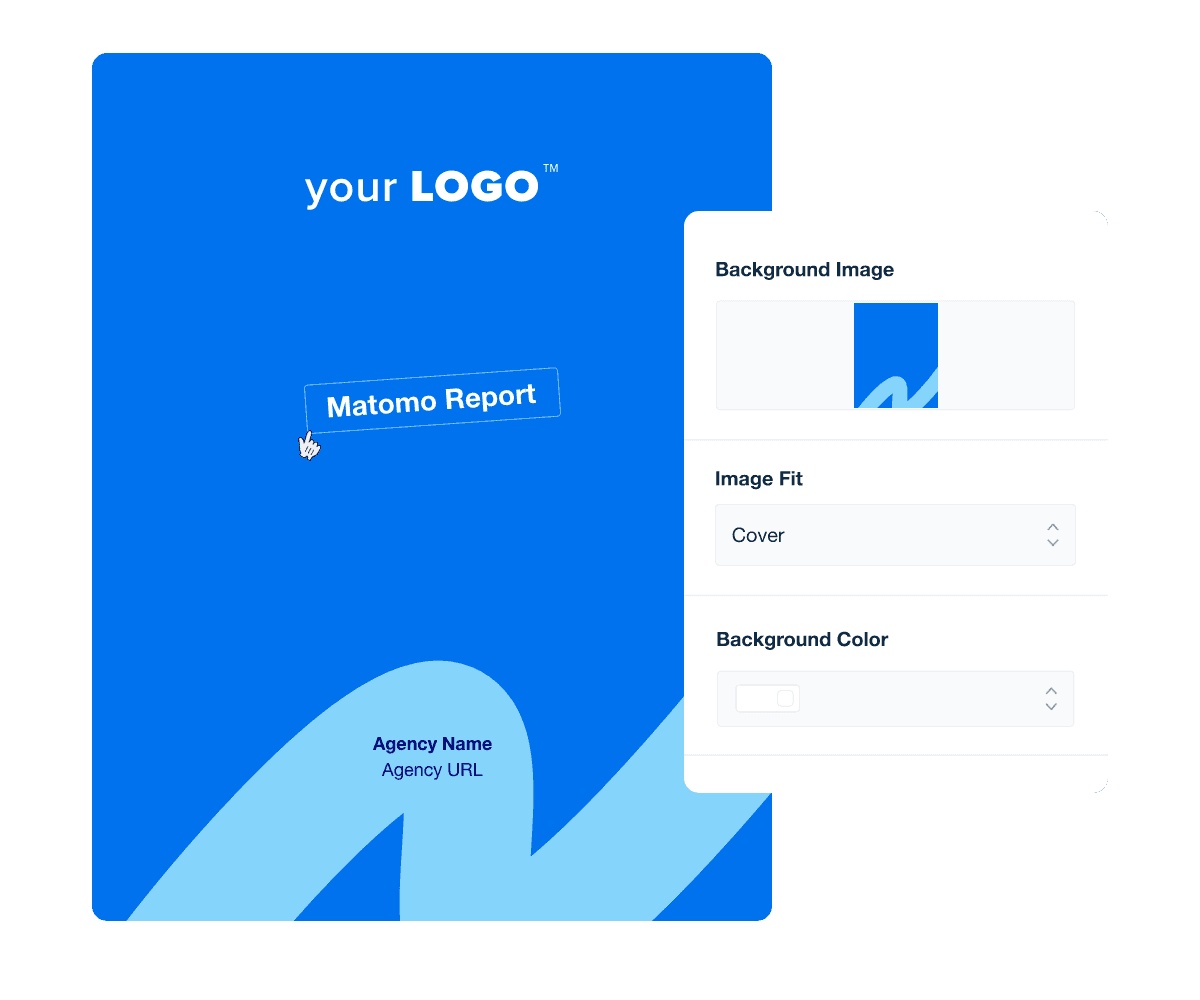
A well-designed, branded cover page sets the tone for an enhanced reporting experience. It gives clients an immediate impression of quality, reinforcing your attention to detail. Customize the cover page with your agency’s logo, colors, and style to ensure consistency across all client communications. This personalization makes your reports stand out, leaving a lasting impression on clients.

Matomo report template cover page

Here’s a bonus: Save custom cover pages and easily reuse them for new clients (customizing as needed). No need to design from scratch every time!

Simplify the report creation process, all while elevating your brand reputation.

2. Executive Summary 

Simply put, an executive summary gives clients a clear overview of campaign results. It highlights the most important insights upfront, saving busy executives time from sifting through the entire report. A well-written executive summary also keeps the focus on strategic outcomes, which helps clients make data-informed decisions. 

Matomo report monthly summary

When creating a report summary, highlight concise insights and provide actionable recommendations. To ensure maximum impact: 

  • Prioritize the most important metrics, such as product revenue or bounce rate changes.

  • Provide actionable recommendations based on data trends.

  • Summarize the work completed, linking efforts to measurable outcomes.

3. Visits

Visits measure the total number of individual sessions within a set timeframe, indicating the overall traffic to your client’s website. 

For deeper insights, track which countries are generating the most visits. This could reveal new targeting opportunities and inspire content ideas tailored to specific regions.

Matomo visits metrics

A high number of visits may indicate that your client’s marketing efforts are working (e.g., click-worthy PPC ads). To address a low number of visits, focus on enhancing visibility through improved SEO tactics, refining ad targeting, or increasing content promotion.

4. Average Time on Page

Average time on page measures how long users engage with a particular web page before moving on. This metric shows whether your client’s content is holding user attention and delivering value.

Average time on page matomo metrics

A high time on page is a good sign–it pinpoints what content is most relevant and popular. If this number is low, consider adding engaging elements (e.g., polls), refining content formats for easier scrolling, and creating more relevant content.

5. Bounce Rate

Bounce rate measures the percentage of visitors who land on a page and leave without taking further action. It helps gauge whether a page is engaging enough or if it's leading users to exit prematurely.

Matomo bounce rate metrics in report template

A high bounce rate could point to issues like irrelevant content or a poor user experience. On the other hand, a lower percentage is promising and may result in meaningful interactions (e.g., conversion-driven action). 

Streamline Client Reporting To Win Back Billable Hours
Automate Reports & Spend More Time Delivering Results
Start Your 14-Day Free Trial

6. Events

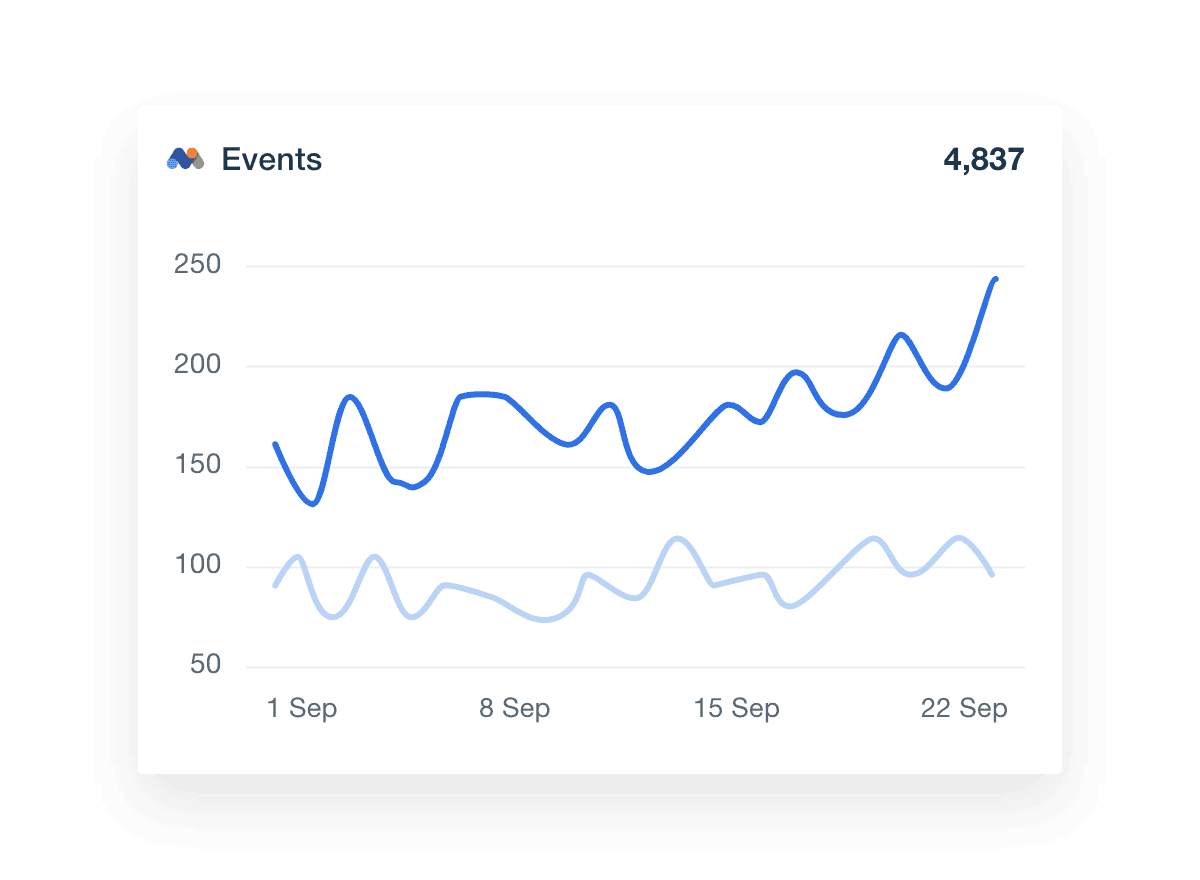
Events track specific interactions on your client’s website, such as button clicks, form submissions, video plays, or downloads. This metric goes beyond page views, offering deeper insights into user behavior. 

Matomo report template events metrics

A high number of events indicates strong user engagement with interactive elements like buttons, forms, or polls. If this number is low, consider revisiting the placement, design, or relevance of calls to action.

7. Conversion Rate

Conversion rate measures the percentage of users who complete a desired action, like filling out a form or making a purchase. It directly ties user engagement to measurable outcomes, showing the effectiveness of your client’s strategy.

Matomo conversion rate metrics visualization

A high conversion rate is ideal for any client. It shows that it shows that their website and campaigns are effectively turning visitors into customers. If you’re noticing a low rate, consider optimizing landing pages, calls to action, or demographic targeting.

8. Product Revenue

Product revenue refers to the total income generated from the sale of products over a specific period. This financial metric links user actions to overall business goals, helping your agency assess the top-performing products. 

Matomo report template product revenue metrics

High product revenue indicates strong sales performance, showing that your client’s marketing efforts effectively drive purchases. If this metric is on the lower side, consider refining your client’s product positioning, pricing strategy, or target audience.

9. Orders

Orders refer to the total number of completed purchases within a given timeframe. This metric reflects how well a product or marketing strategy turns interest into sales.

Matomo orders metrics

A steady volume of successful orders means more revenue. In turn, this demonstrates your agency’s role in driving sales and tangible results. If orders are low, review the client’s ad targeting, streamline the checkout process, or offer time-sensitive promotions to encourage action.

10. Average Price

Average price represents the mean amount customers pay per order over a specified period. More specifically, this metric is useful for identifying pricing trends, customer spending behaviors, and revenue health.

Average price matomo report metrics

A high average price means customers purchase multiple items or ones with a premium value, which is a good sign. If this metric is low, consider bundling offers or adjusting prices to increase the overall value per purchase.

See the Matomo Report Template in Action
Use This Professional Template To Create Client Reports in Minutes
View Template Demo

Customizable Matomo Report Templates To Meet Client Needs 

Everyone starts somewhere, including your agency. 

While manual reporting methods may have worked in the past, they’re just not sustainable. Think about it–more clients mean more metrics to track. Do you really want to spend your time creating clunky spreadsheets or taking multiple screenshots?

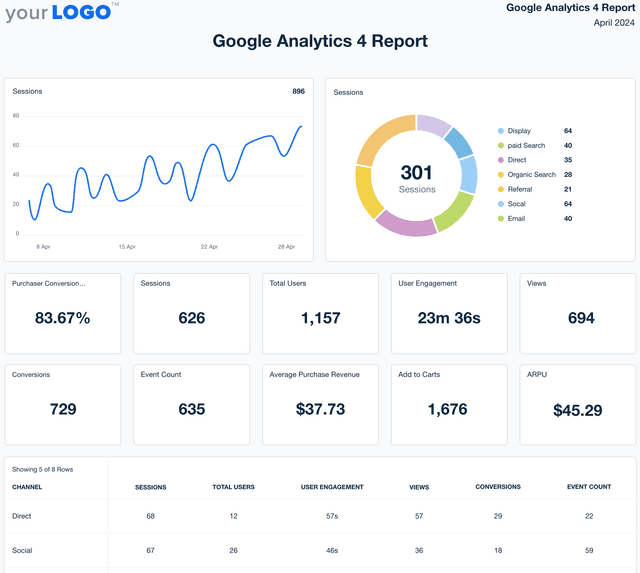
If not, working with AgencyAnalytics is the way to go. This client reporting platform automates data retrieval, offers access to 80+ integrations, and enhances your operational efficiency. It’s not a generic solution either. With just a few clicks, create reports tailored to your client’s specific needs. Experiment with data visualizations, move widgets around, and so much more.

Matomo Drag and Drop Dashboard Builder

Invest in a tool that grows with your agency. Access pre-built reporting templates that are already professionally formatted and send-ready. Even generate an 11-second Smart Report that auto-populates with your client’s unique metrics–it’s that simple!

The AgencyAnalytics platform beautifully and simply consolidates data from all the major platforms that our clients utilize. This saves them (and us) from having to receive, find, or generate multiple reports from multiple platforms.

Glenn Marvin
Glenn Marvin

Konnector

Save Time on Reports and Gain More Time for Strategy
Automate Client Reporting and Free Up Hours Every Month
Start Your 14-Day Free Trial

Matomo Report Templates as Unique as Your Agency

Effortless Reporting at Scale

Instantly Access All Your Clients’ Matomo Data

Show clients their performance across 80+ channels, all while removing the headache of manual reporting. Consolidate insights from Matomo, Facebook, Mailchimp, and other top marketing platforms, all in one place. 

Don’t waste time toggling between accounts. Centralize client metrics and access key data insights with ease. Streamline the reporting process, win back billable hours, and share results that matter.

An example of the available marketing platform integrations AgencyAnalytics offers to connect your clients' marketing data
Own Your Branding

White Label Your Matomo Reports

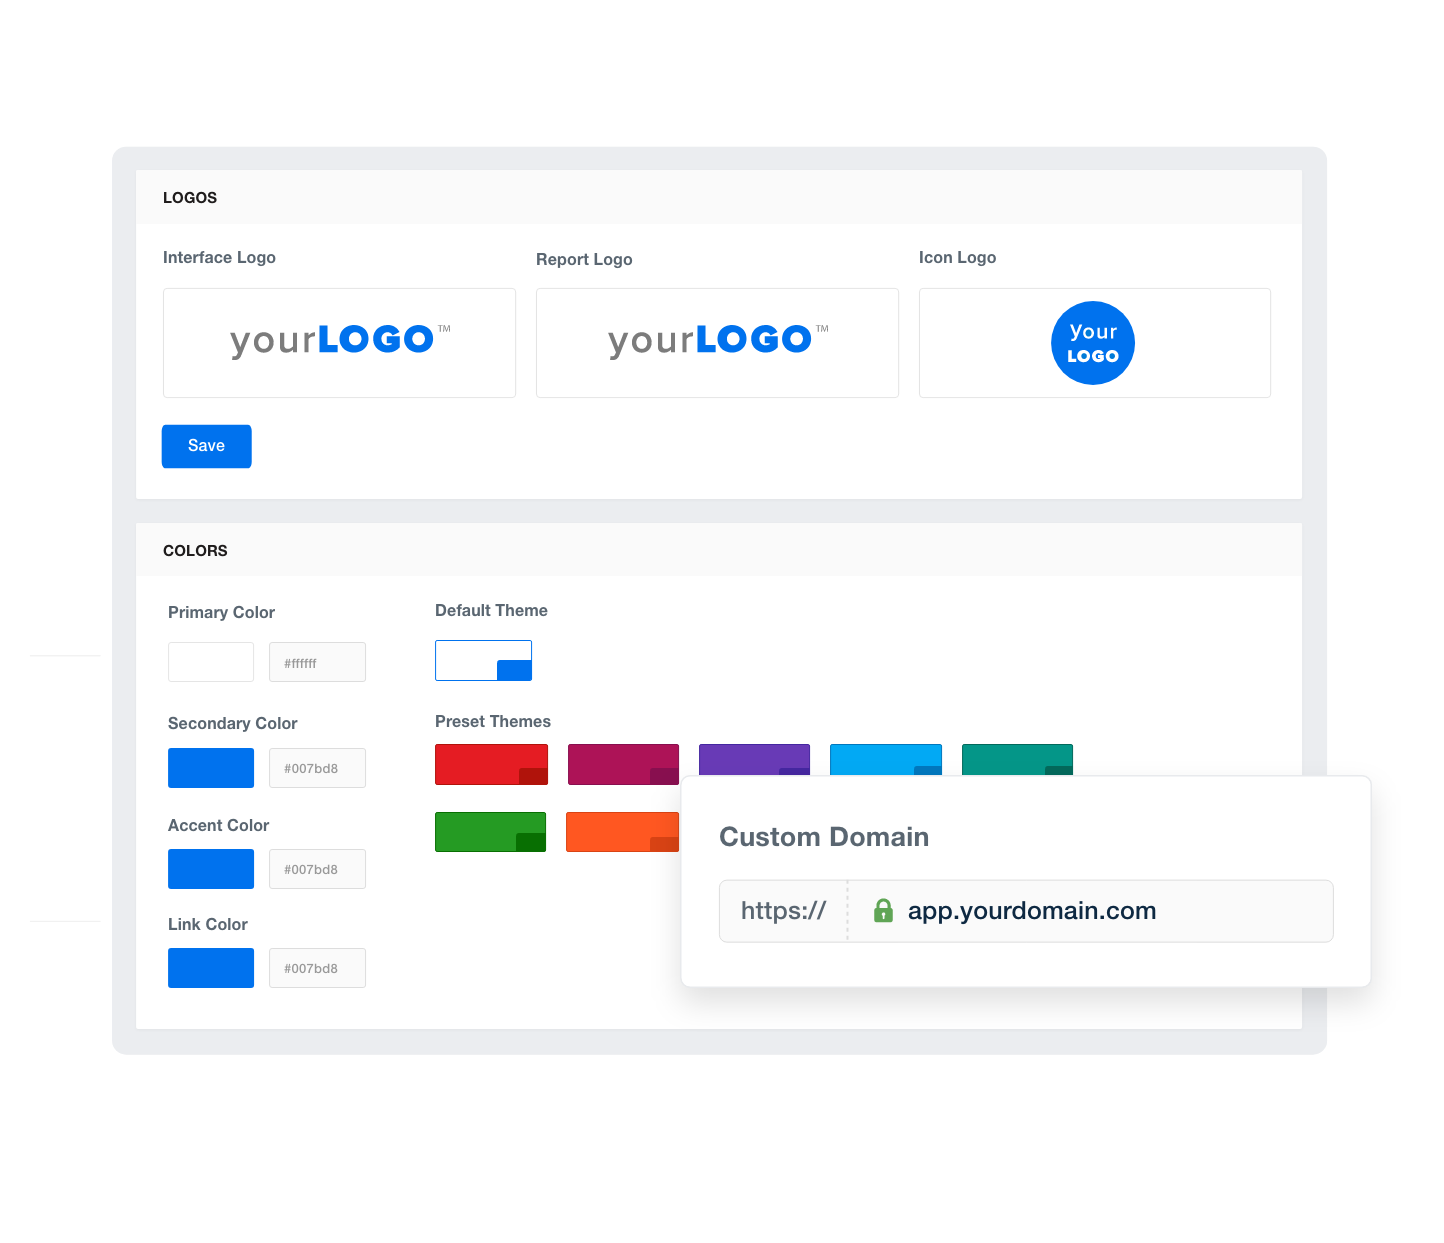
Deliver custom reports that keep your agency’s identity front and center. With fully white-labeled dashboards and reports, your clients will see your brand, not another platform’s. 

Build trust, maintain professionalism, and remove the hassle of extra design work. Share actionable insights while showcasing your unique aesthetic–presentation matters, after all.

Add Your Own Branding To Your Customizable SEO Reporting Software
Tailored Success

Set Matomo Goals and Hit Targets

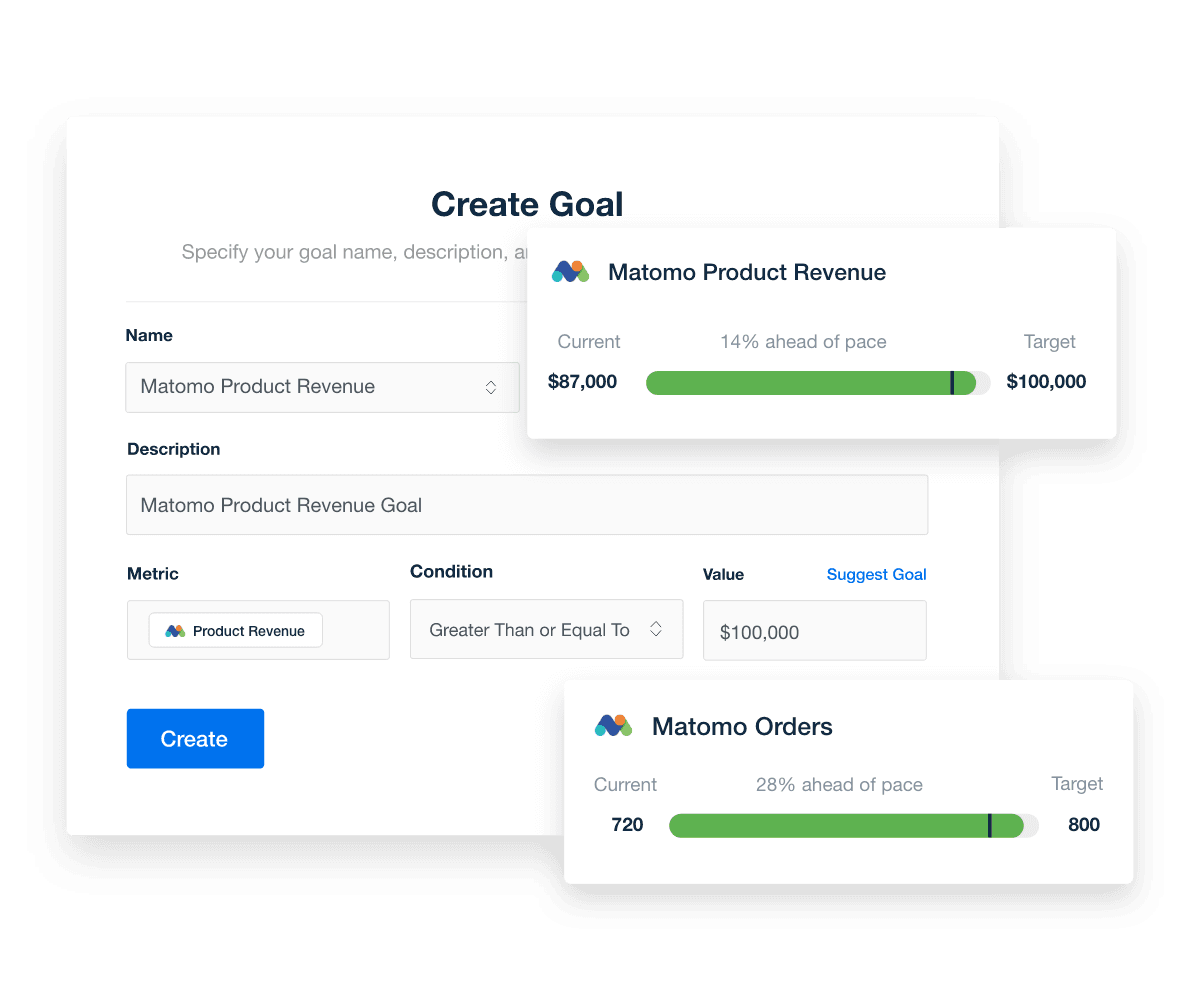
Set and track specific goals that align with your client’s unique objectives. With customizable goal tracking, focus on actionable targets and monitor progress in real-time.

Ensure things are progressing as they should. Monitor performance, make optimizations when needed, and keep clients informed every step of the way. 

Matomo report templates goals
Automate the Routine

Put Your Matomo Reporting on Autopilot

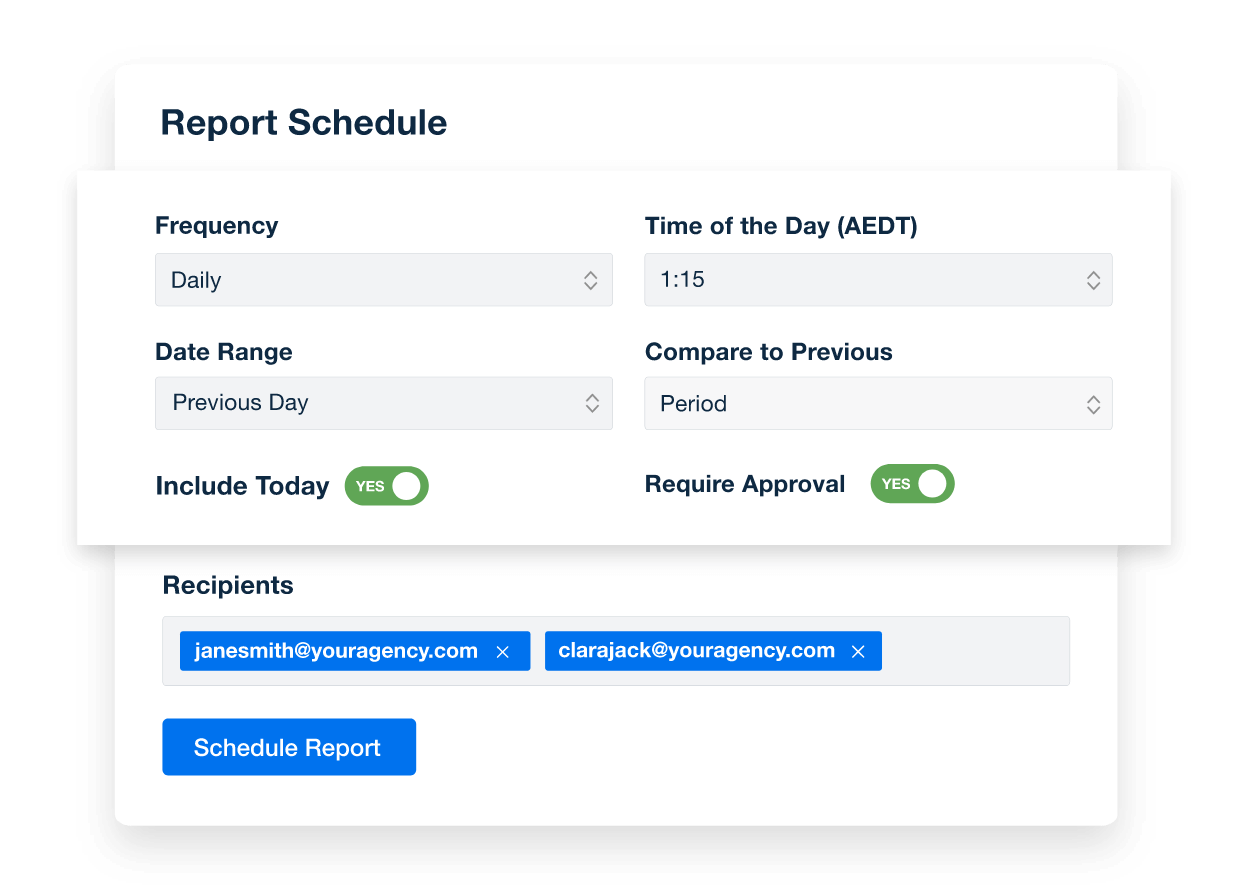
Trying to remember if you sent that report? No need to! Automatically schedule it at the frequency that suits your client’s needs–be it daily, weekly, or monthly.

By automating this process, you’ll no longer have to worry about missing send deadlines or dropping the ball. Tighten up internal processes, set a high standard, and share updates right on schedule.

How to Schedule Automated Marketing Reports for Marketing Agency Clients
Always Here for You

Customer Support is Our Top Priority

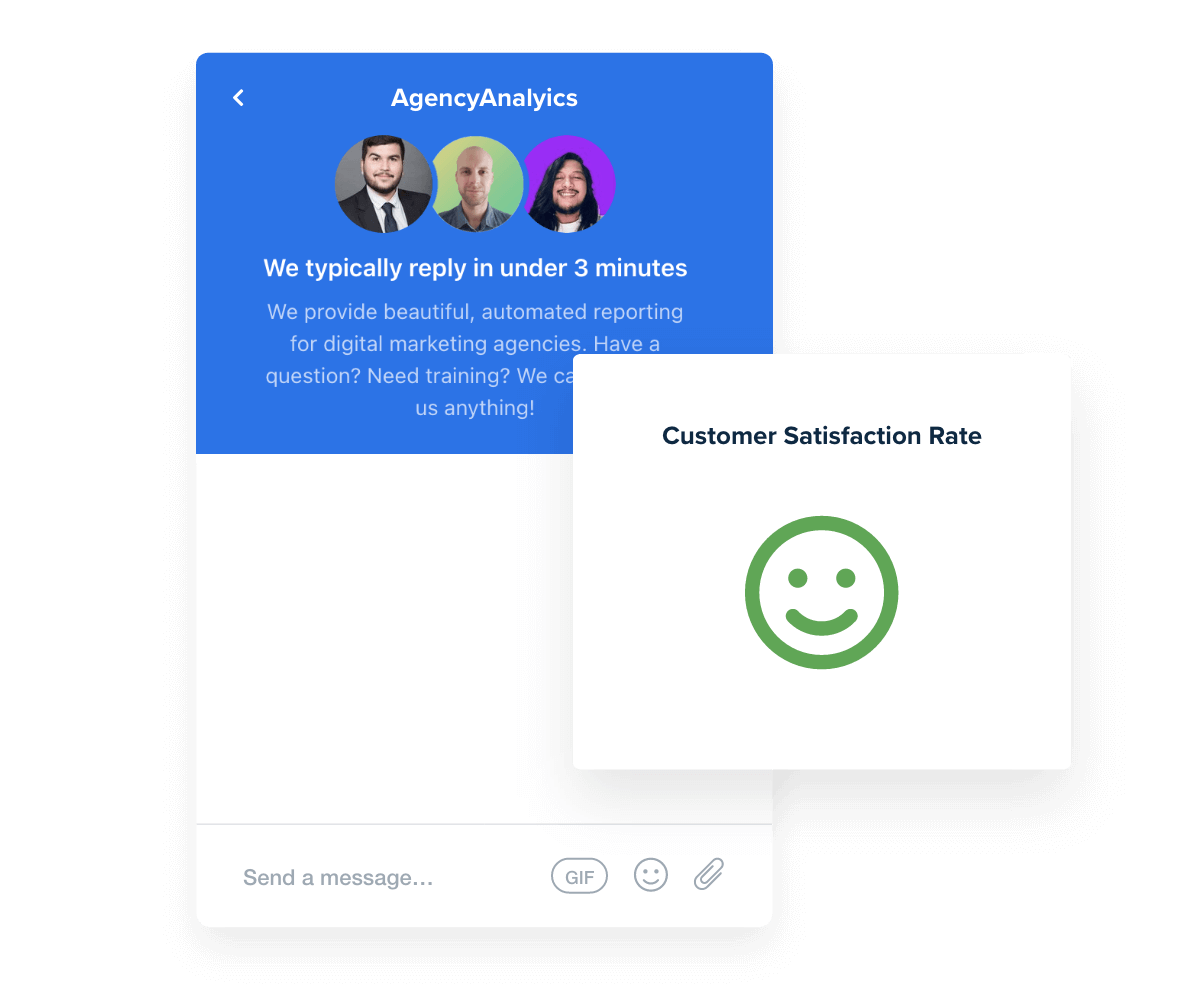
Experience unmatched support with our 24/5 live chat. Our team of experts is dedicated to providing solutions, with response times typically under three minutes. Don’t take our word for it–our customer satisfaction rate consistently exceeds 95%!

From building custom dashboards to tweaking report templates, we're here to assist every step of the way. You care about your clients’ success. We care about yours.

Best in Class Customer Support
Give Your Agency Time To Grow

Report Smarter. Not Harder.

Streamline your reporting process and automate data retrieval. Pull in essential metrics from Matomo and 80+ marketing platforms into a central, data-visual hub. 

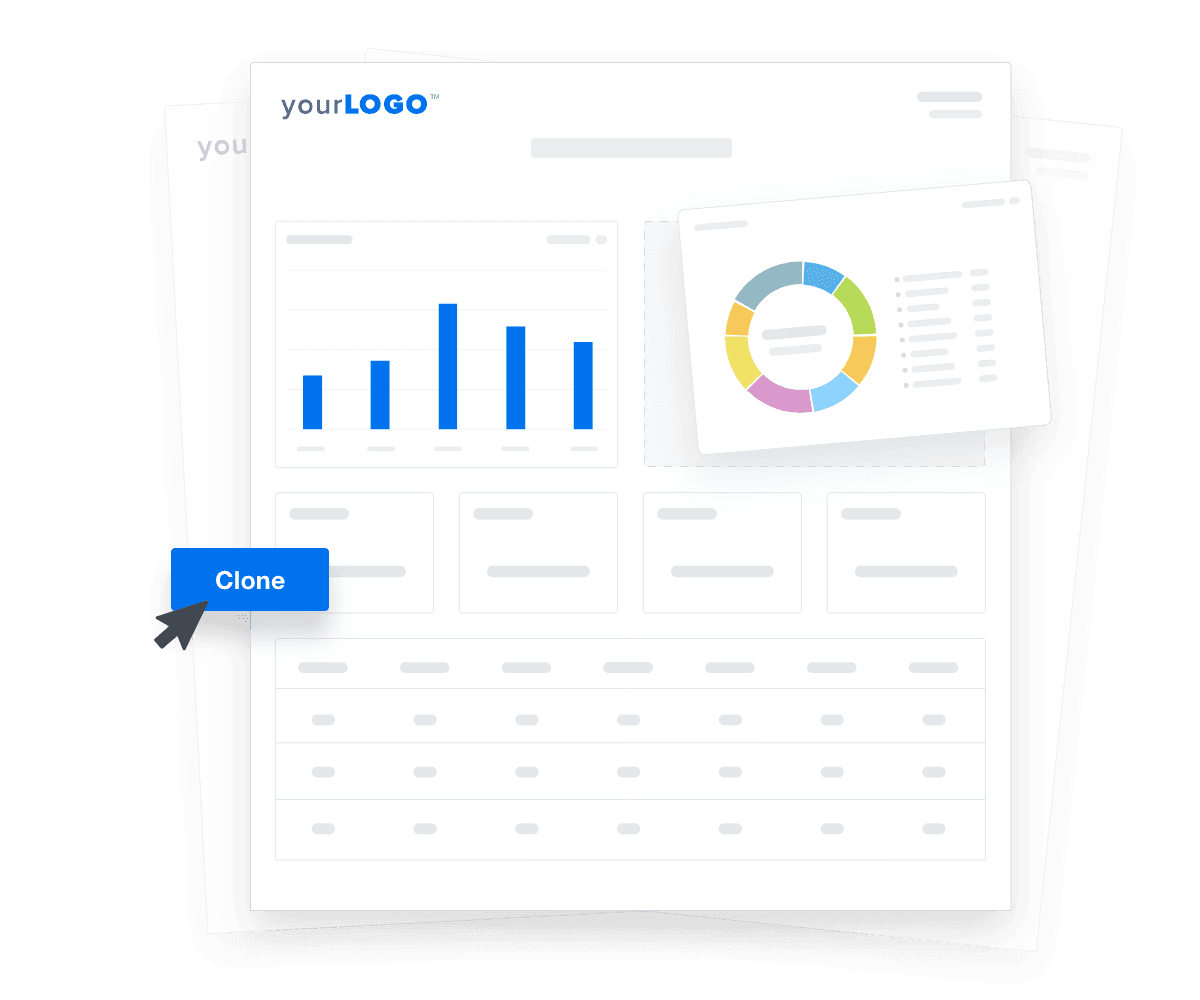
Tailor each report template or dashboard as needed–even clone them for new clients. Create an efficient onboarding process, streamline workflows, and focus on scaling your operations.

Smarter Client Reporting Platform

Tracking data is a vital part of our business, and the accuracy of data is a must. AgencyAnalytics brings all our tracking accounts into one place, streamlining our internal work processes.

Keith Griffiths
Keith Griffiths

DataRush Ltd

Get Started for Free

Try AgencyAnalytics risk-free for 14 days. No credit card required.
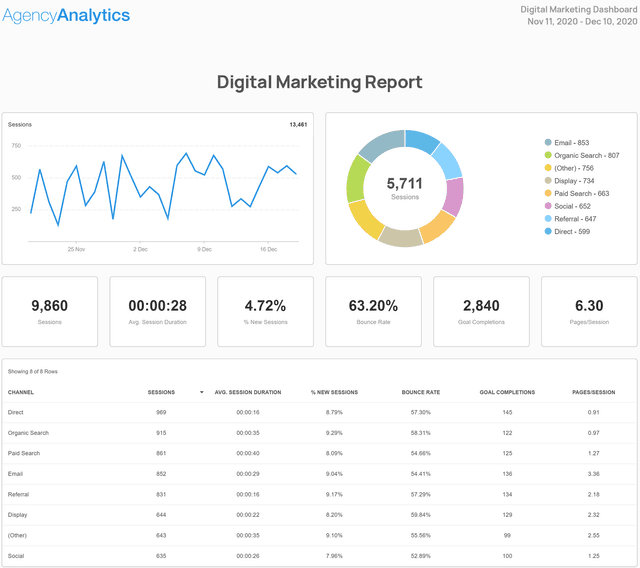
AgencyAnalytics Dashboard Preview