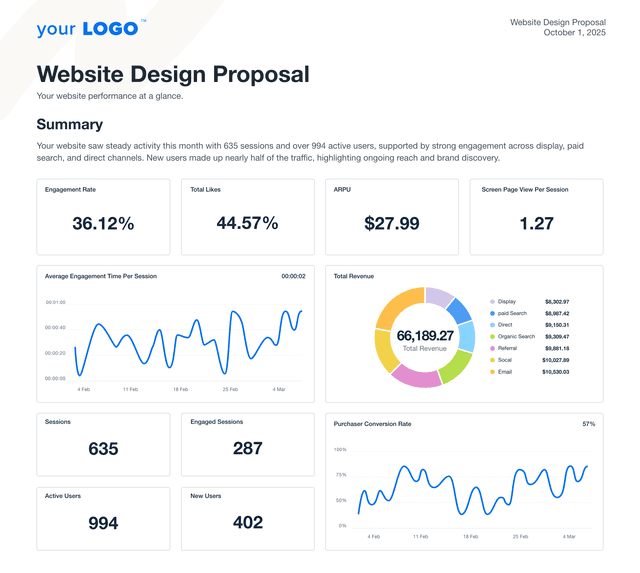
Google Analytics Report
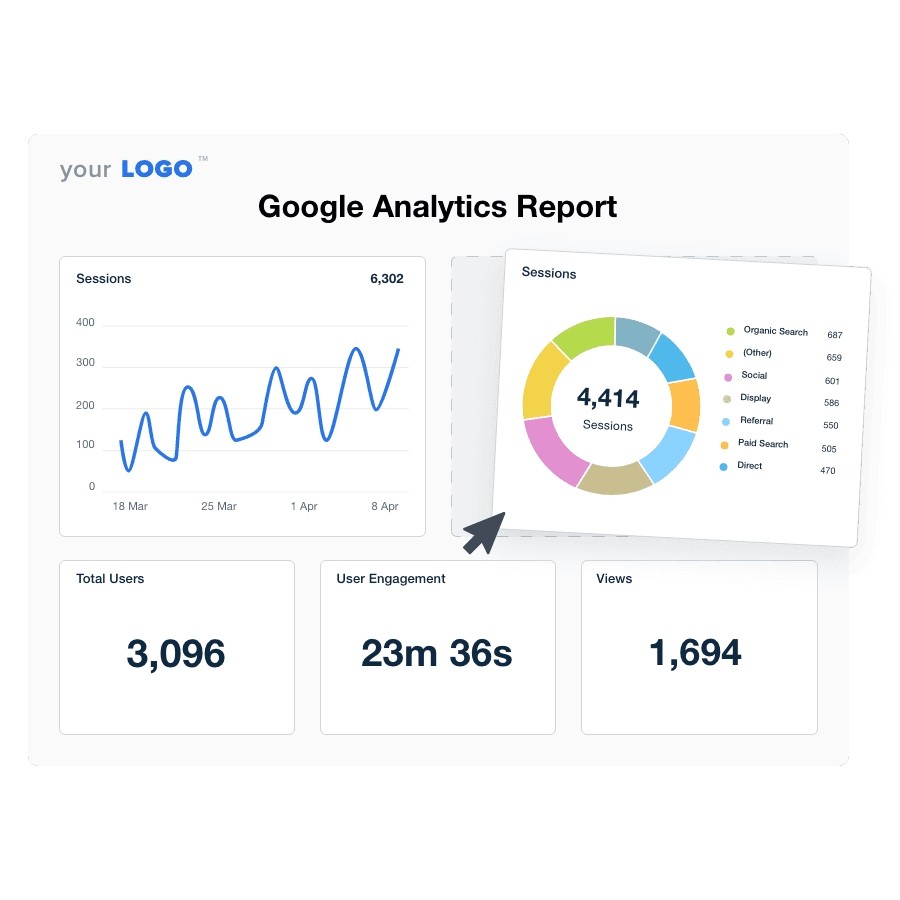
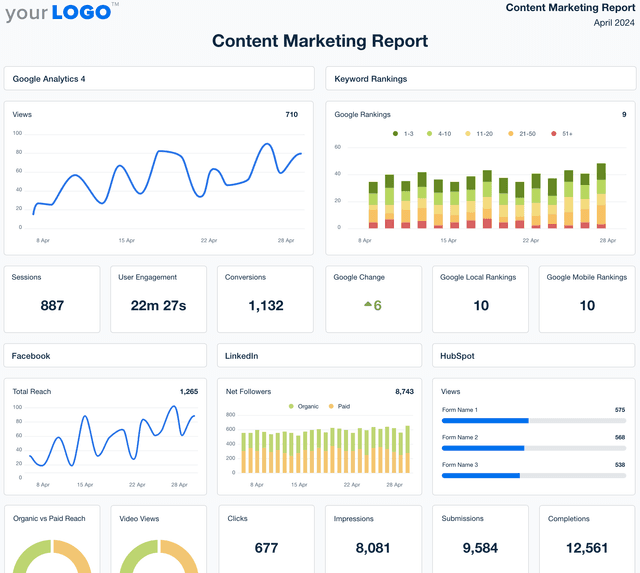
A Google Analytics report template that combines essential marketing data like web sessions, conversions, bounce rates, and more.
Why Your Agency Needs a Google Analytics Report Template
A dedicated Google Analytics report template prevents your agency from spending too much time manually sifting through data in your clients’ Google Analytics accounts. Instead, have all your clients’ up-to-date Google Analytics data wrapped up in a clean and easy-to-understand report that you can quickly and easily send to your clients.
Clients love when they can clearly understand what's going on in a monthly report and it helps prove your agency’s ROI to retain clients. In short, a Google Analytics reporting tool like this is critical for scaling your marketing agency.
Create Professional Google Analytics Reports in Minutes
Start Your Free Trial Today!6 Things Included In Our Google Analytics Report
1. Monthly Summary
The monthly summary section is perhaps one of the most important sections of the entire report template as it gives you the opportunity to provide an overview of key highlights and next steps. This section comes in the form of an open text field where you can write whatever you feel is appropriate for your clients to know about the past month’s data and analytics. Since many clients don’t know how to interpret data from Google Analytics, you can provide a clear overview of what’s happening in their account in plain English.

To start, discuss your wins for the month here. Did you crush it on conversions this month? Maybe you doubled the overall number of web sessions from the previous month. Celebrate those successes here and correlate them to your agency’s marketing efforts in areas like ad campaigns and social media management. You should also discuss challenges in the monthly write-up section, if applicable. What didn’t go according to plan this month and—perhaps most importantly—why did they go wrong and what is your team going to do to fix it?
Finally, use the section to describe the changes you’ve made to the site and what you hope the future effects of those changes will be. Discussing your agency’s strategy going forward is always an important aspect of client communication as it provides clear transparency on your next steps.
2. All Channels
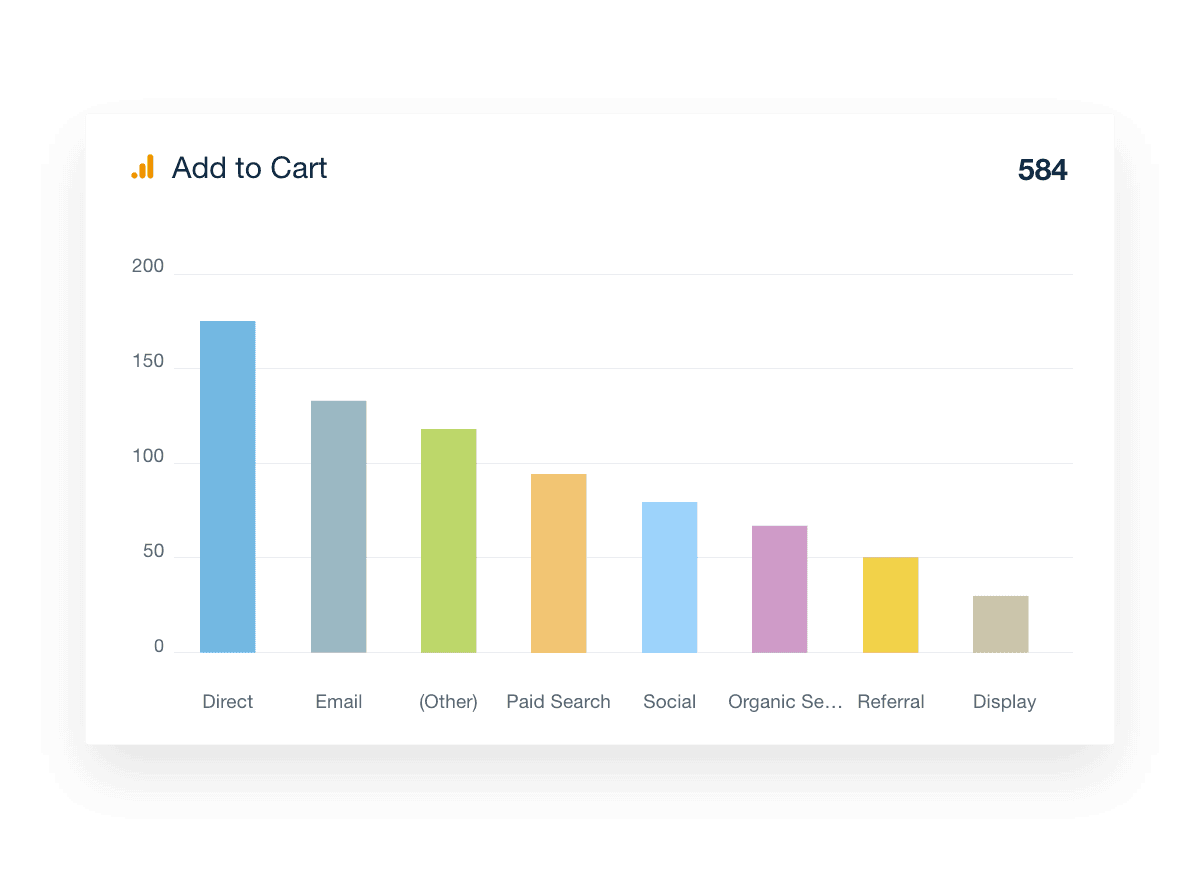
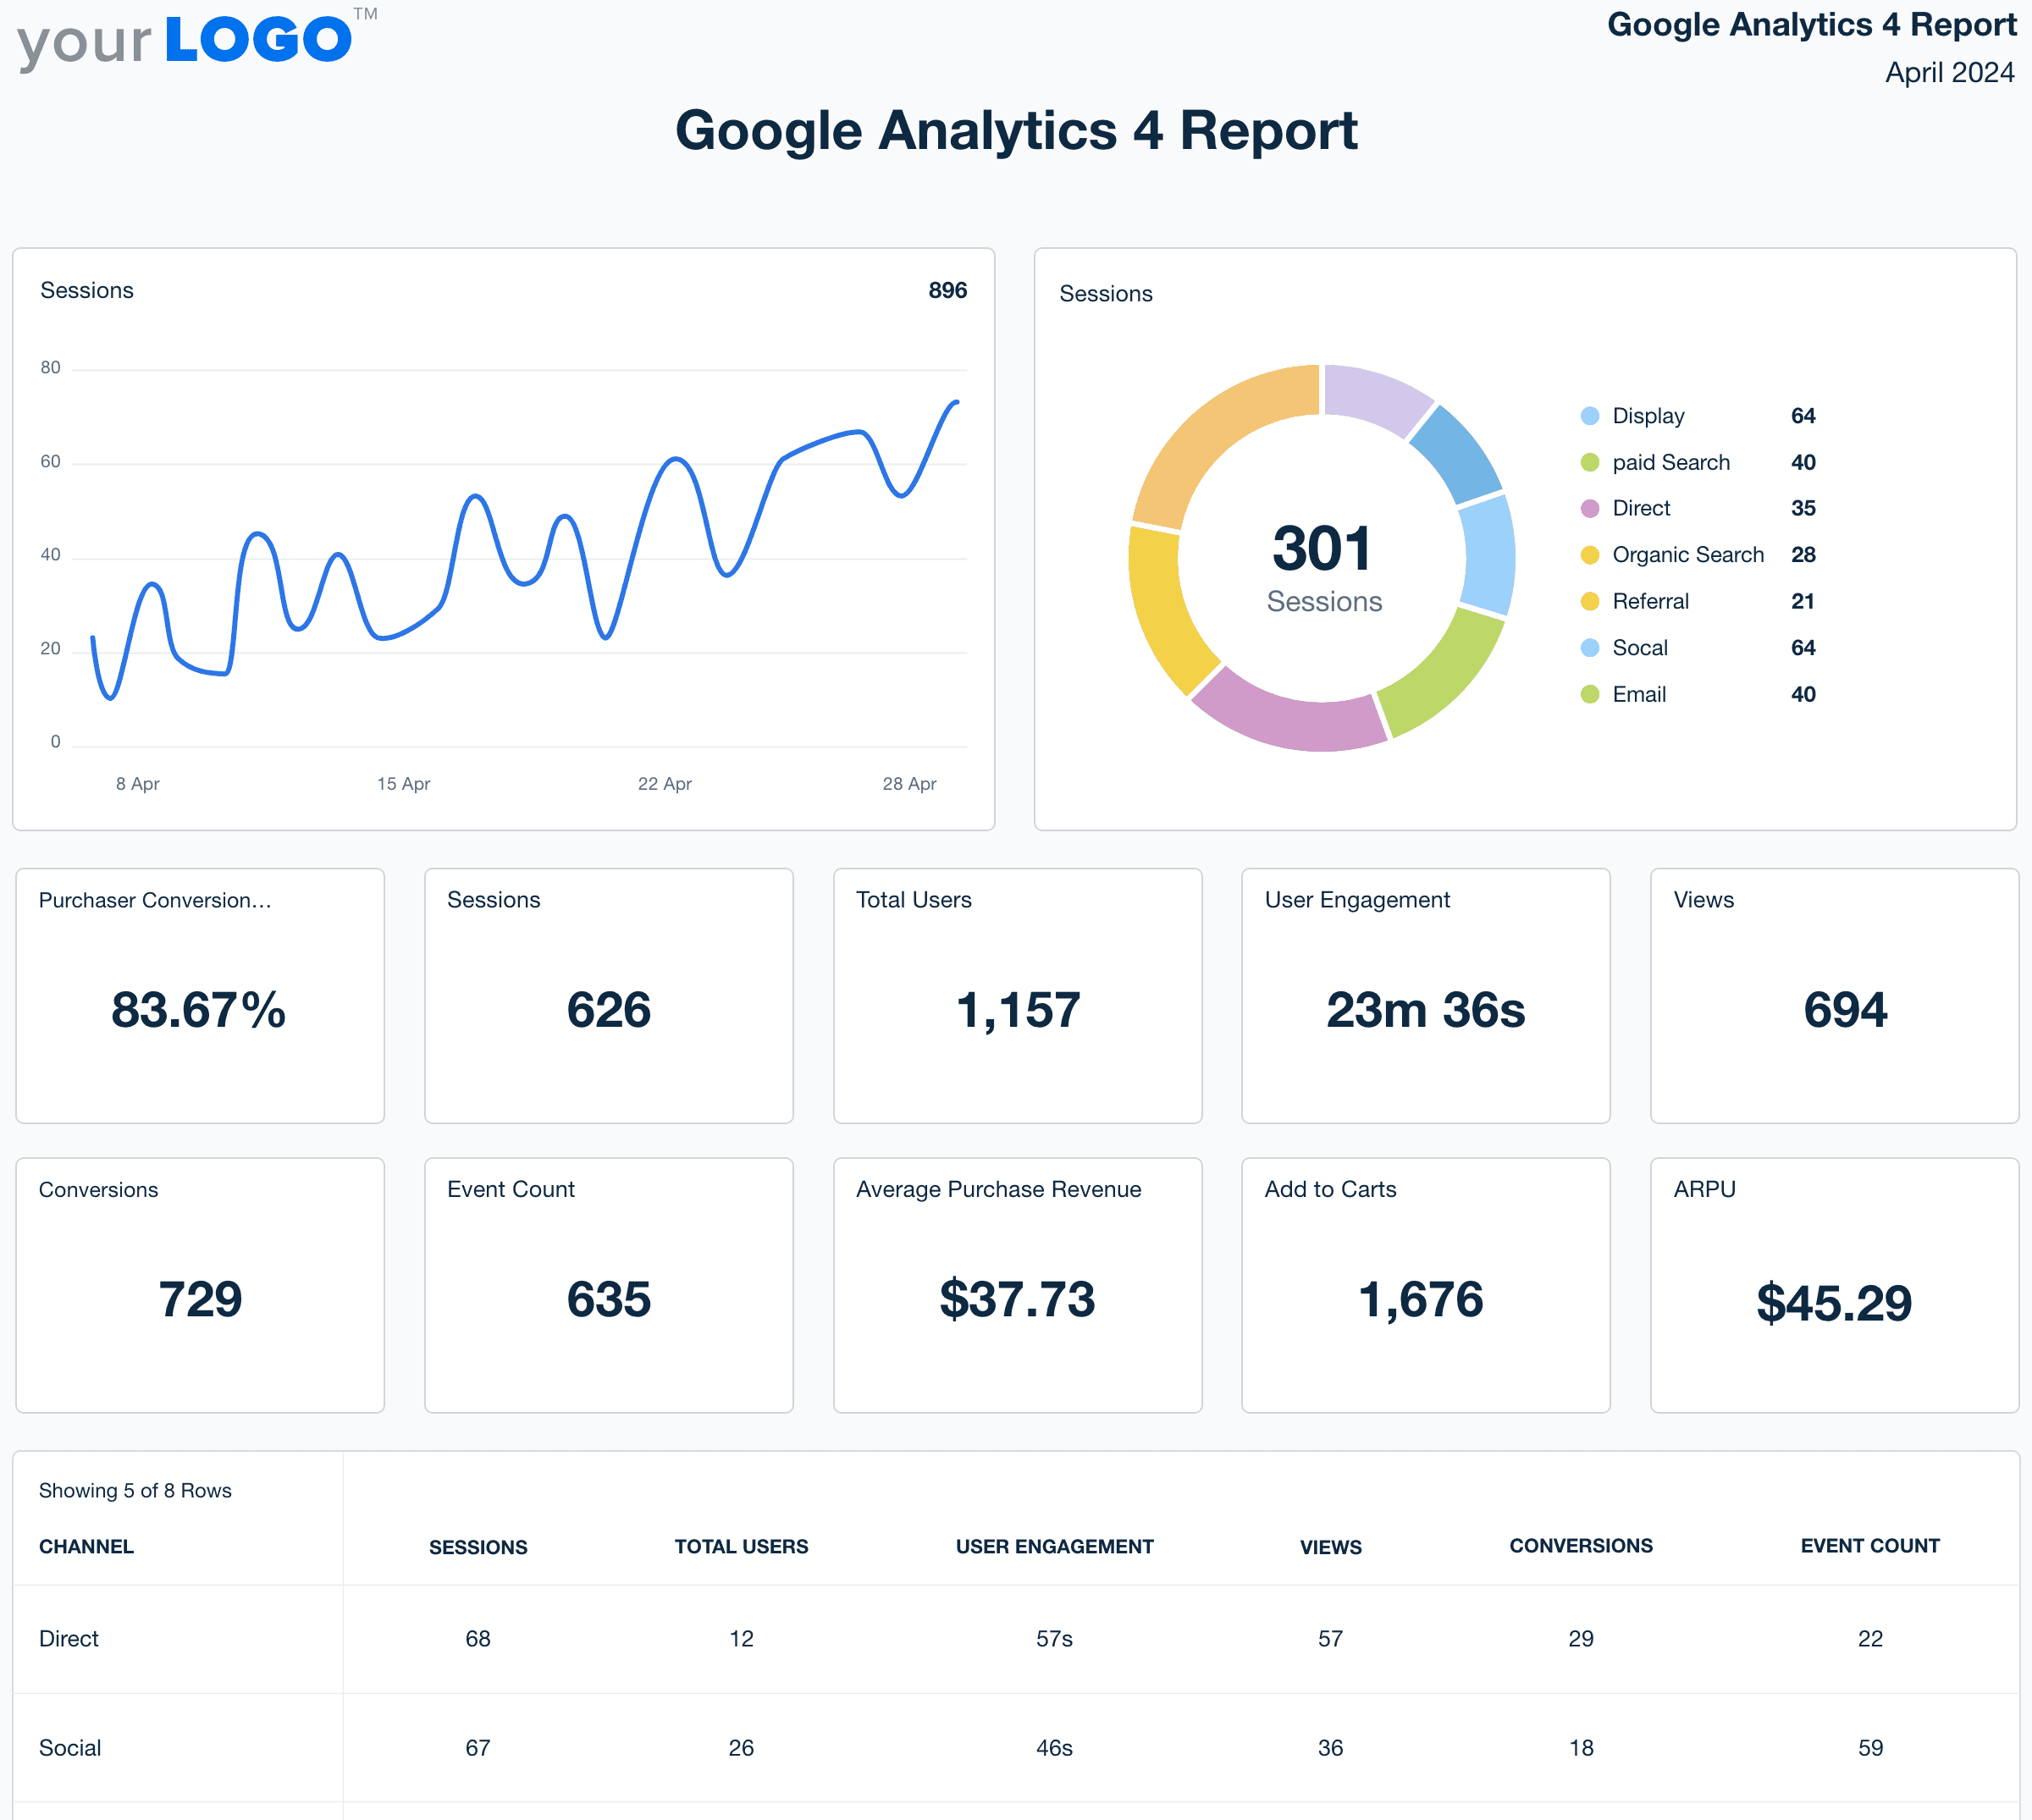
This section displays all of the key metrics for your client’s site-wide traffic, including the number of web sessions and how they break down between different traffic sources, including paid and organic search from search engines, email, social, and more.

You’ll also get to see how each channel is performing when it comes to web traffic, along with individual KPIs like bounce rates, goal completions and average session duration. Use this data in conjunction with other pieces of your marketing strategy like SEO, ad campaigns and PPC campaigns to decide what your next steps should be in the coming months. If conversions are low but traffic is high, you might have a problem with your offers or CTAs. If one channel isn’t bringing in enough traffic or associated conversions, you can take the appropriate steps to fix the problem and improve the stats.
3. Goals (Conversions)
One of the most important metrics for your agency to track consistently, and one that your clients likely want to know about the most, is the number of conversions completed on your clients’ sites. You and your clients decide on what these goals are in Google Analytics. They can be anything from a purchase to a free trial sign up.

The Goals section of the performance report first displays the total number of conversions completed in the form of a line graph. You’ll even get to see how this number breaks down between the different types of goals you and your client have set. Additionally, the report tells you how much each conversion is worth and what the overall conversion rate is based on the total number of visitors to the site.
This information can tell you and your clients how well things like your ad campaigns and call-to-actions (CTAs) are working, but it can also inform you on the performance of your clients’ websites. If you aren’t getting a high number of goal conversions, take a look at the website to see if you can identify any on-site issues with the landing pages, eCommerce functionality, and so on.
4. Landing Pages
Landing pages are often the first point of contact a potential customer will experience when going to your client’s website through an ad campaign. It’s important to understand how well each of your landing pages is performing when it comes to overall traffic, conversions and bounce rate.

The data and metrics found on this page help you directly identify any potential problems with the landing pages on a client’s website like page load times and navigational issues. If there’s a certain landing page that isn’t getting conversions or traffic, you can use that data as the starting point to a conversation with your clients about how you can adjust those pages in order to optimize overall performance.
If you're also managing PPC advertising for your clients, you may want to create a PPC report template instead!
5. Location/geo
If you want to know more about the geographic location of site visitors, this section of the Google Analytics report is the place to do it. This section of the report gives you deeper insights into your clients’ customer base so you can see if you’re reaching the right people with your digital marketing efforts. To start, you’ll get all the same metrics you see in the All Channels section of the report, but in the context of geographic location.

The Geo page lists all of the countries from which customers are visiting the site, along with a breakdown of individual page metrics per country. The data tells you if you’re targeting the right demographic or not so you can improve overall campaign performance.
6. Devices
Like the other sections in the Google Analytics report template, the Devices section shows you specific web traffic information as it relates to the types of devices potential customers are using to browse (tablets vs. mobile vs. desktop). As you analyze this information, pay close attention to how each of the different devices perform when it comes to conversions and bounce rates.

If these two metrics are underperforming for a certain device type but doing well with the other devices, then you may have a problem with how the website is configured to display on those devices. For example, if no one is converting on mobile devices but they are converting on desktops, then it’s likely that you need to update and improve the mobile version of the website.
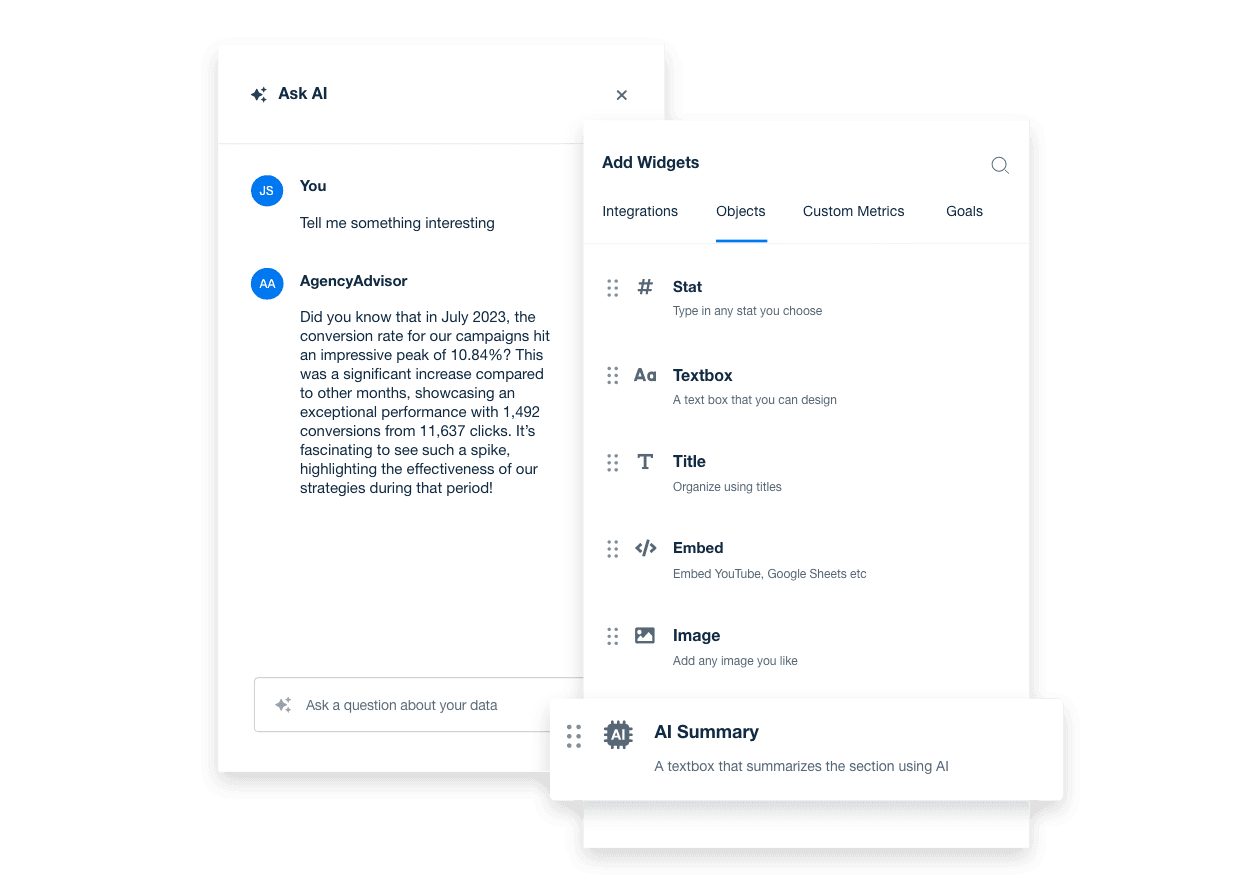
Want to add more sections or custom metrics? AgencyAnalytics lets you easily drag and drop new sections to your Google Analytics report in minutes, saving your agency time to focus on scaling your business.
Easily Report on Your Clients’ Google Analytics Metrics
Start Your Free 14-day TrialPowerful Google Analytics Reporting Software Built for Agencies
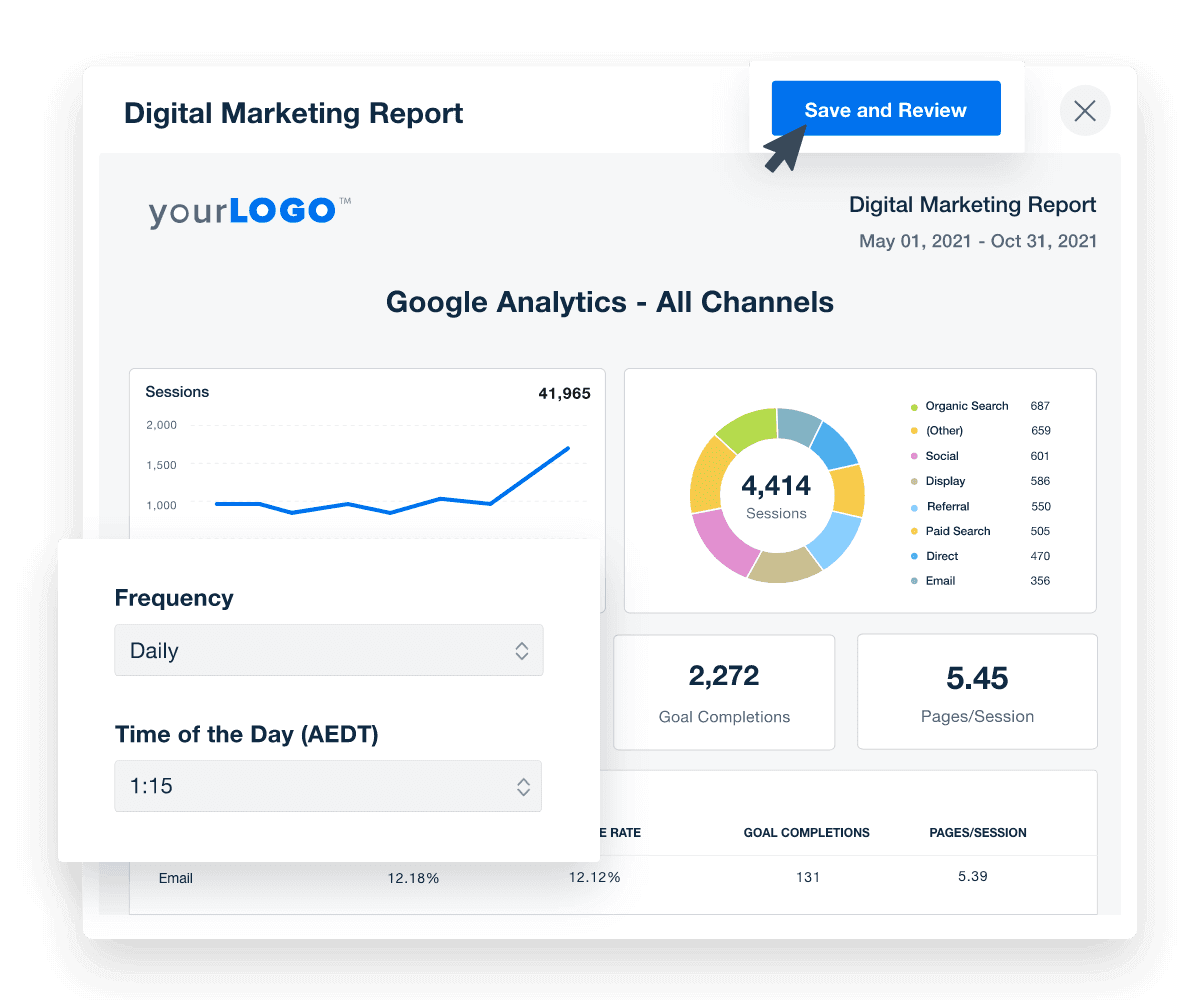
Automated Google Analytics Reports

Combine Google Analytics Data With All Your Other Marketing Channels

Unlimited Client & Staff Users for Full Agency Control

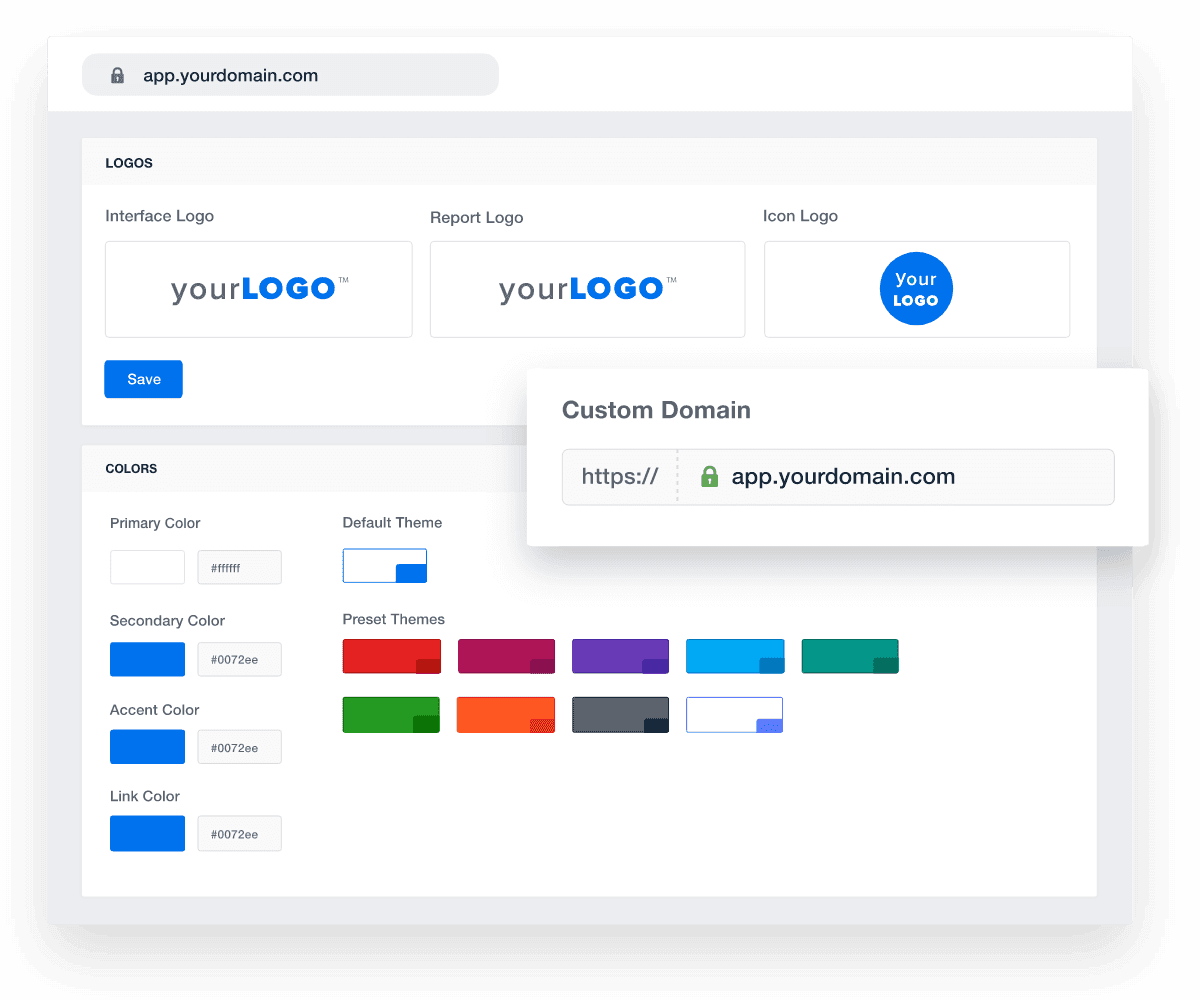
White Labeled Google Analytics Reports

AgencyAnalytics has made our jobs so much easier. It works so much better for us and for our clients. It’s just such a relief to find software that is seamless from the beginning and allows us to communicate how we are doing to our clients.

Check out our Google Analytics Report