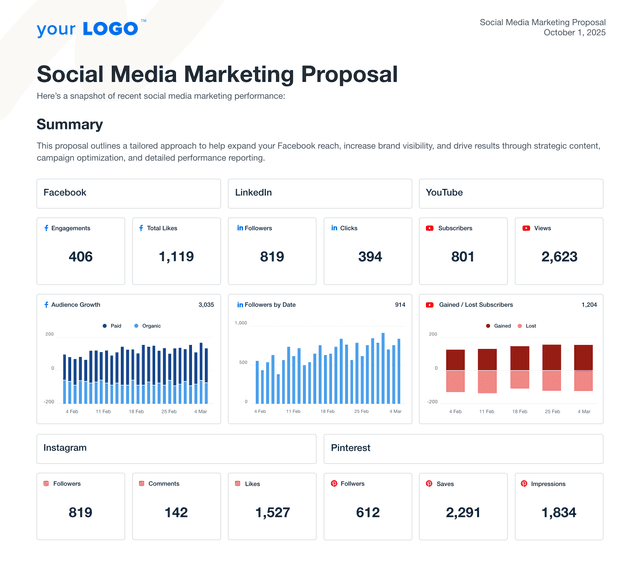
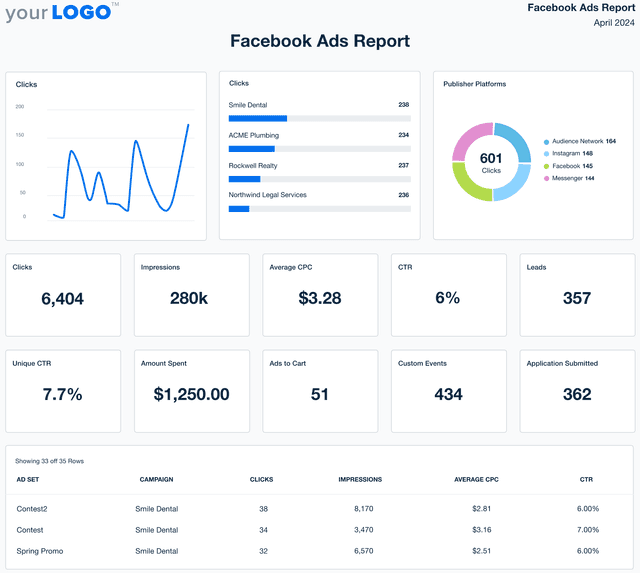
Free Social Media Report Template for Busy Marketing Agencies
Social Media Reports Should Drive Client Conversations—Not Just Summarize Metrics
Clients don’t want more charts. They want to understand what’s working, what’s changing, and what to do next. When social media reporting stops at surface-level metrics, agencies risk disengaged clients, misaligned expectations, and missed opportunities to lead with insight.
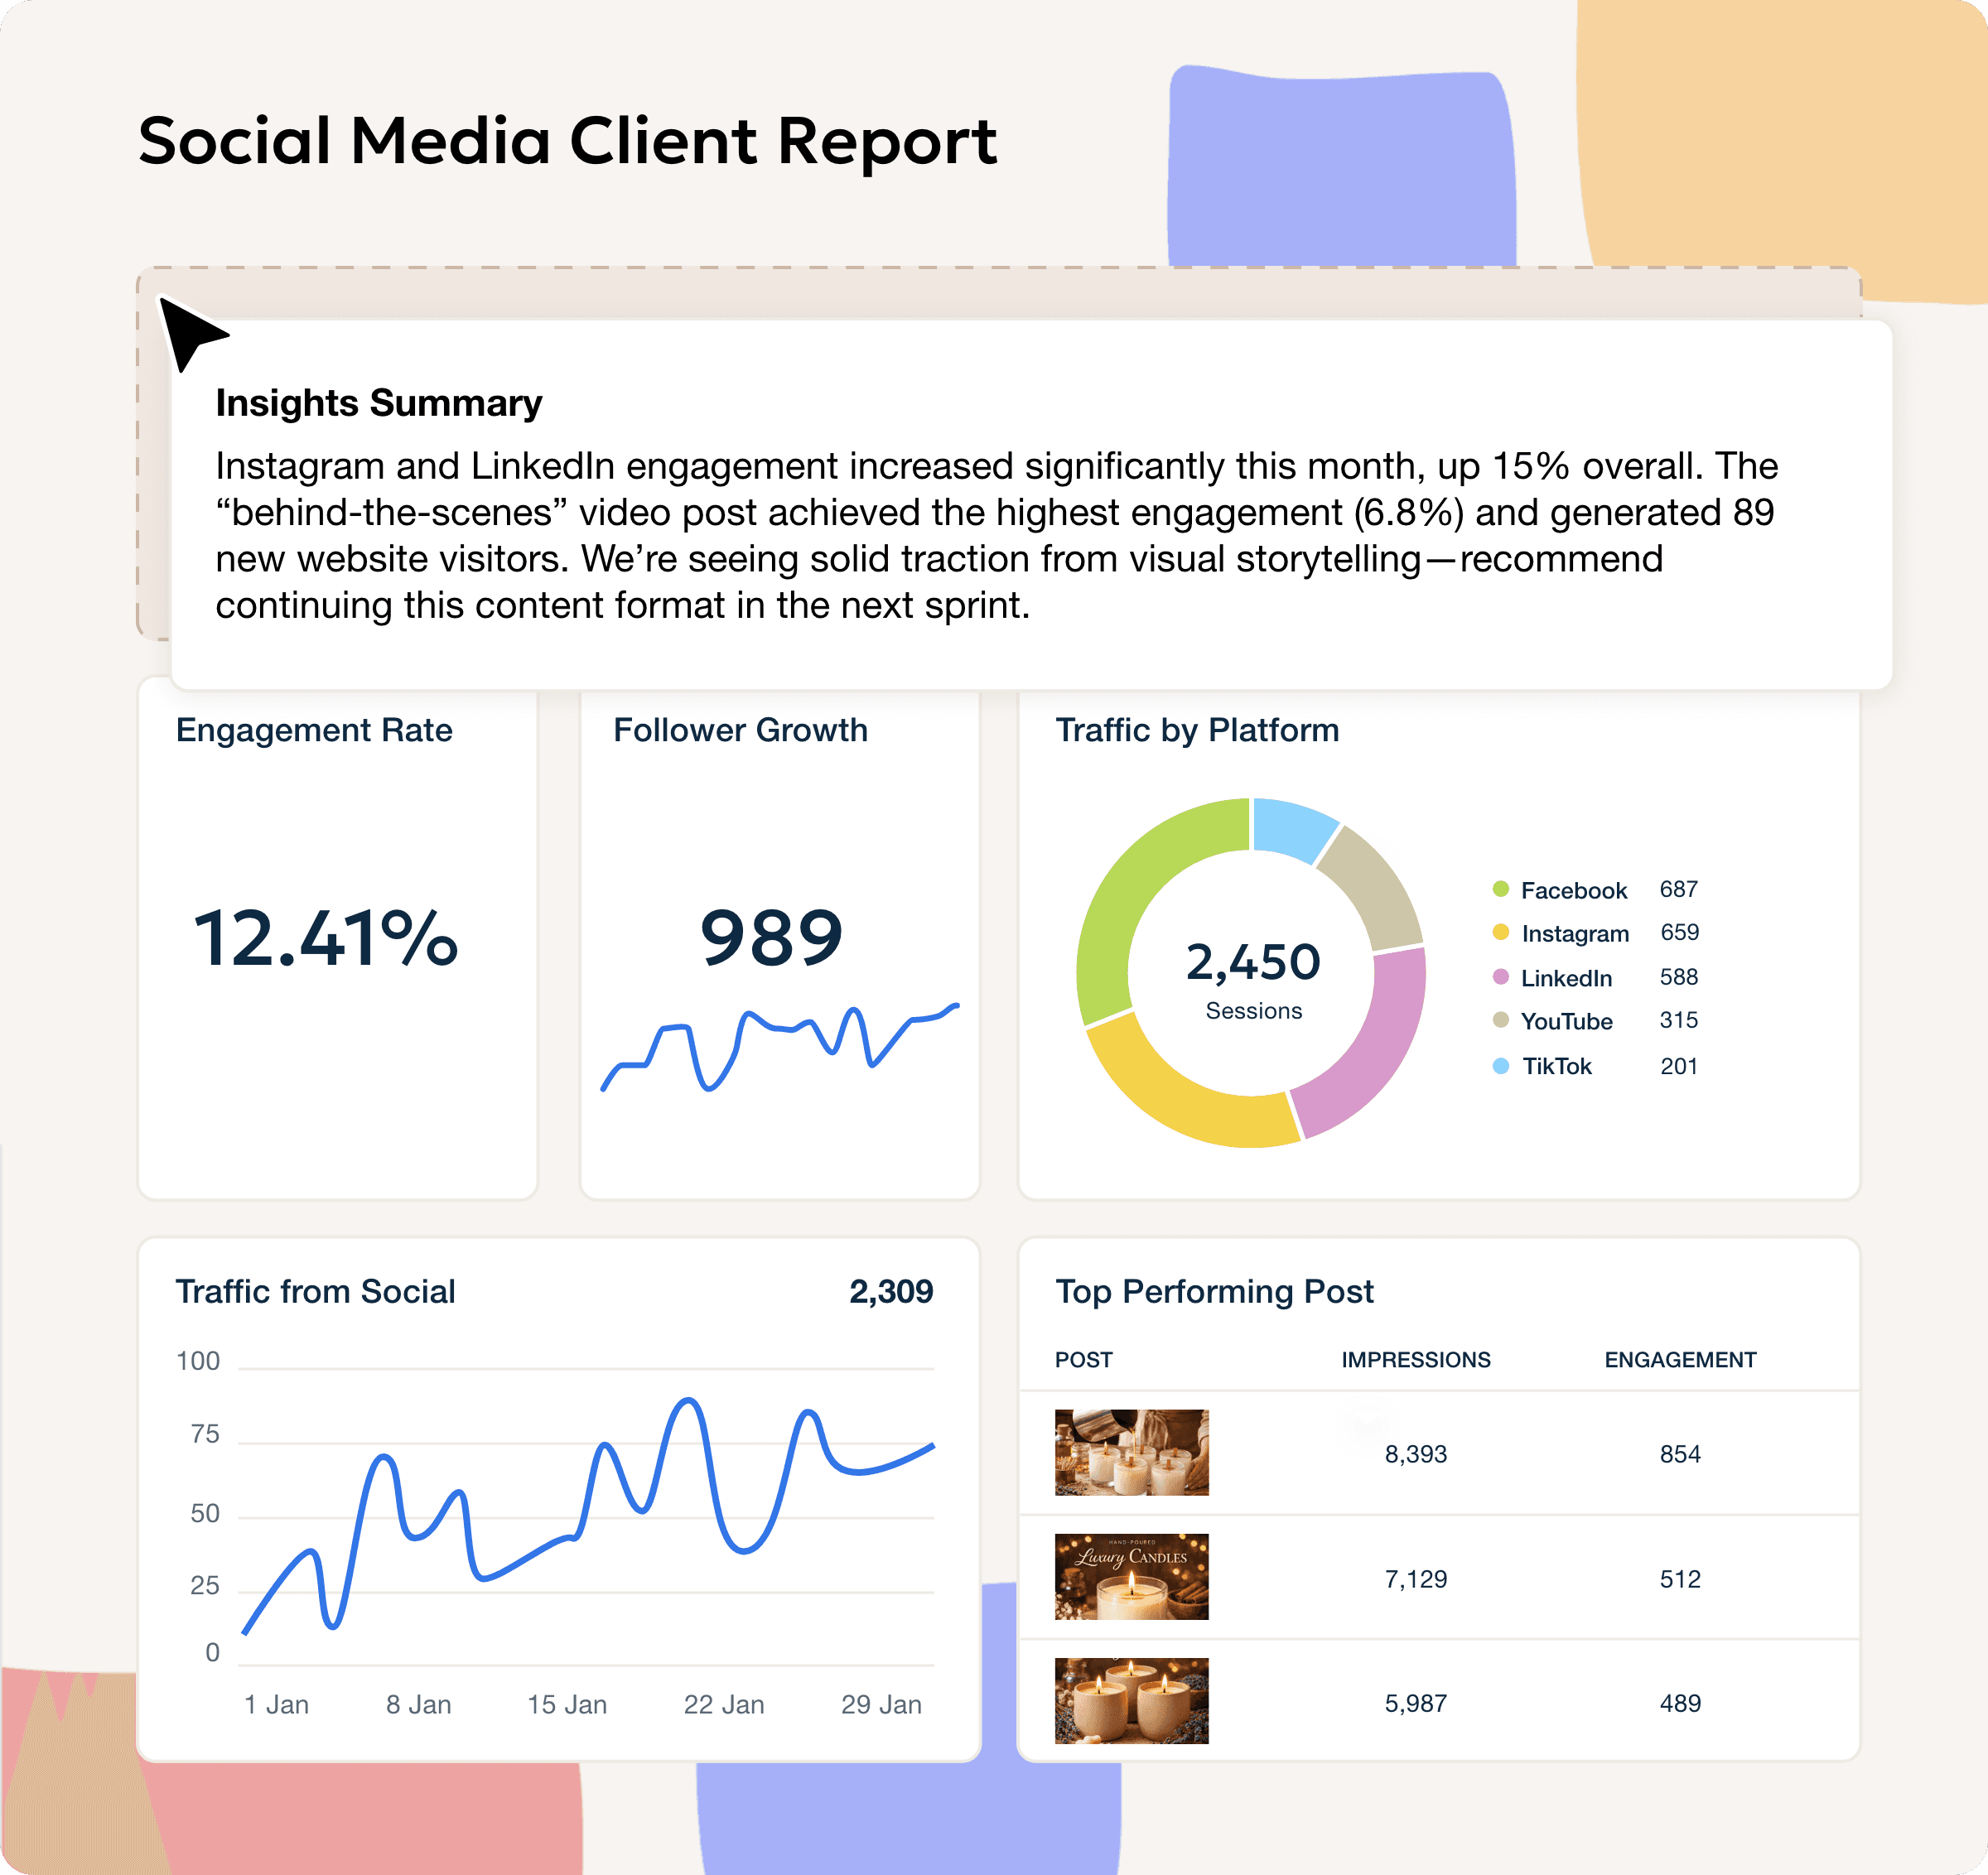
AgencyAnalytics turns social media reports into strategic touchpoints. Built-in AI-generated insights highlight key trends, explain performance shifts, and surface talking points your clients actually care about. Instead of manually interpreting data each month, your team delivers clear analysis that sparks better conversations, builds confidence, and reinforces your role as a trusted advisor.
Customizable Social Media Report Templates That Turn Performance Into Proof
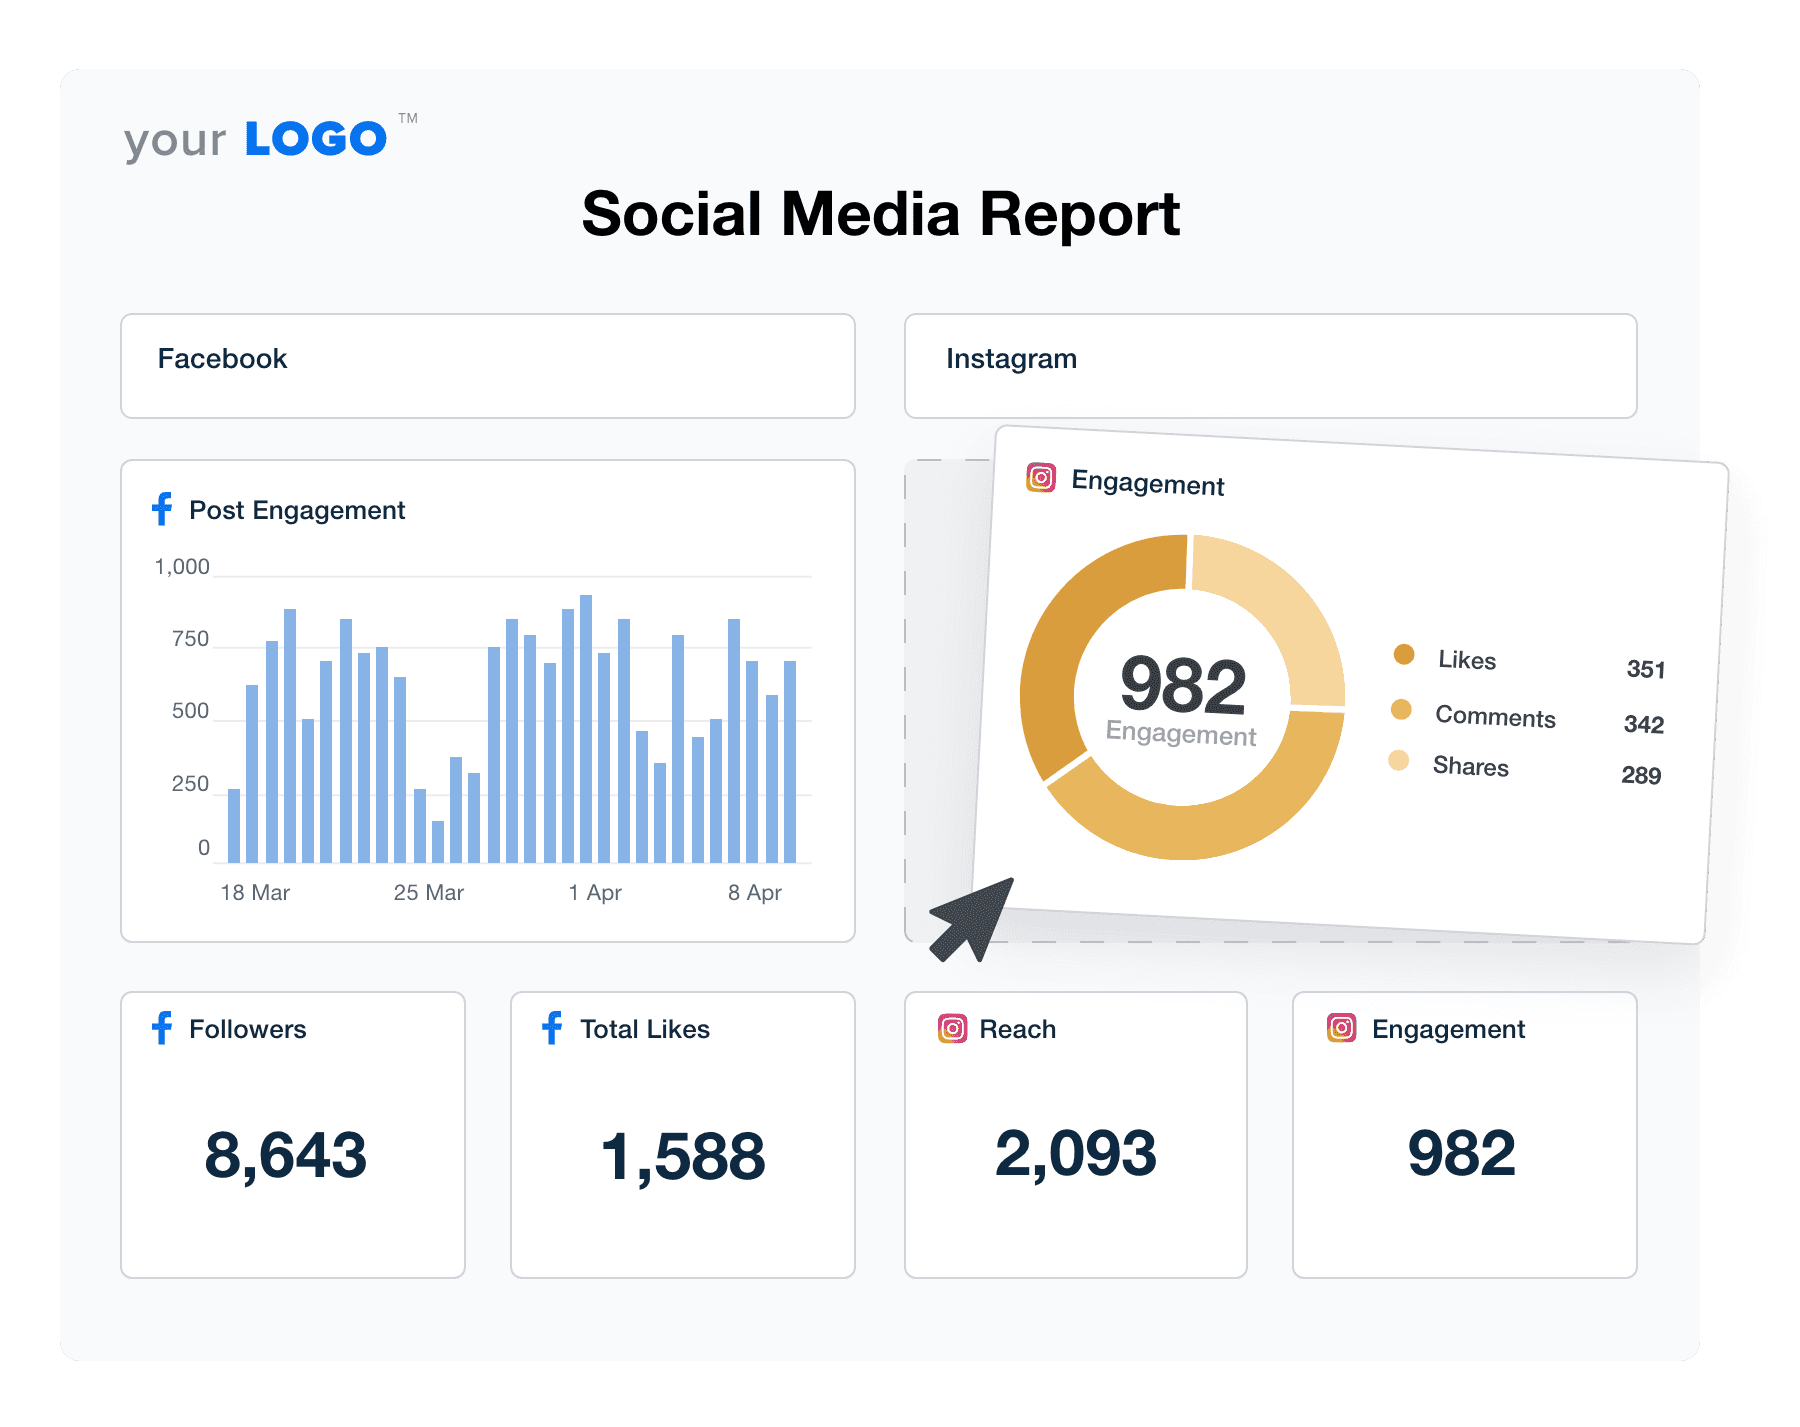
Customizable social media report templates pull live data directly from your connected platforms into a single, consistent social media analytics report. Every metric stays current, every layout follows a clear structure, and every report reflects real performance—without manual updates or rework.
Track engagement, reach, follower growth, and paid social performance across 80+ platforms in one standardized reporting view. Customize layouts, apply your agency’s branding, and present performance in a format clients recognize, understand, and trust month after month.
With automated updates and consistent presentation, your reports become reliable evidence of progress. Your team spends less time compiling data, your clients see results clearly, and your agency defends its impact with confidence.
What Belongs in a Professional Social Media Report Template
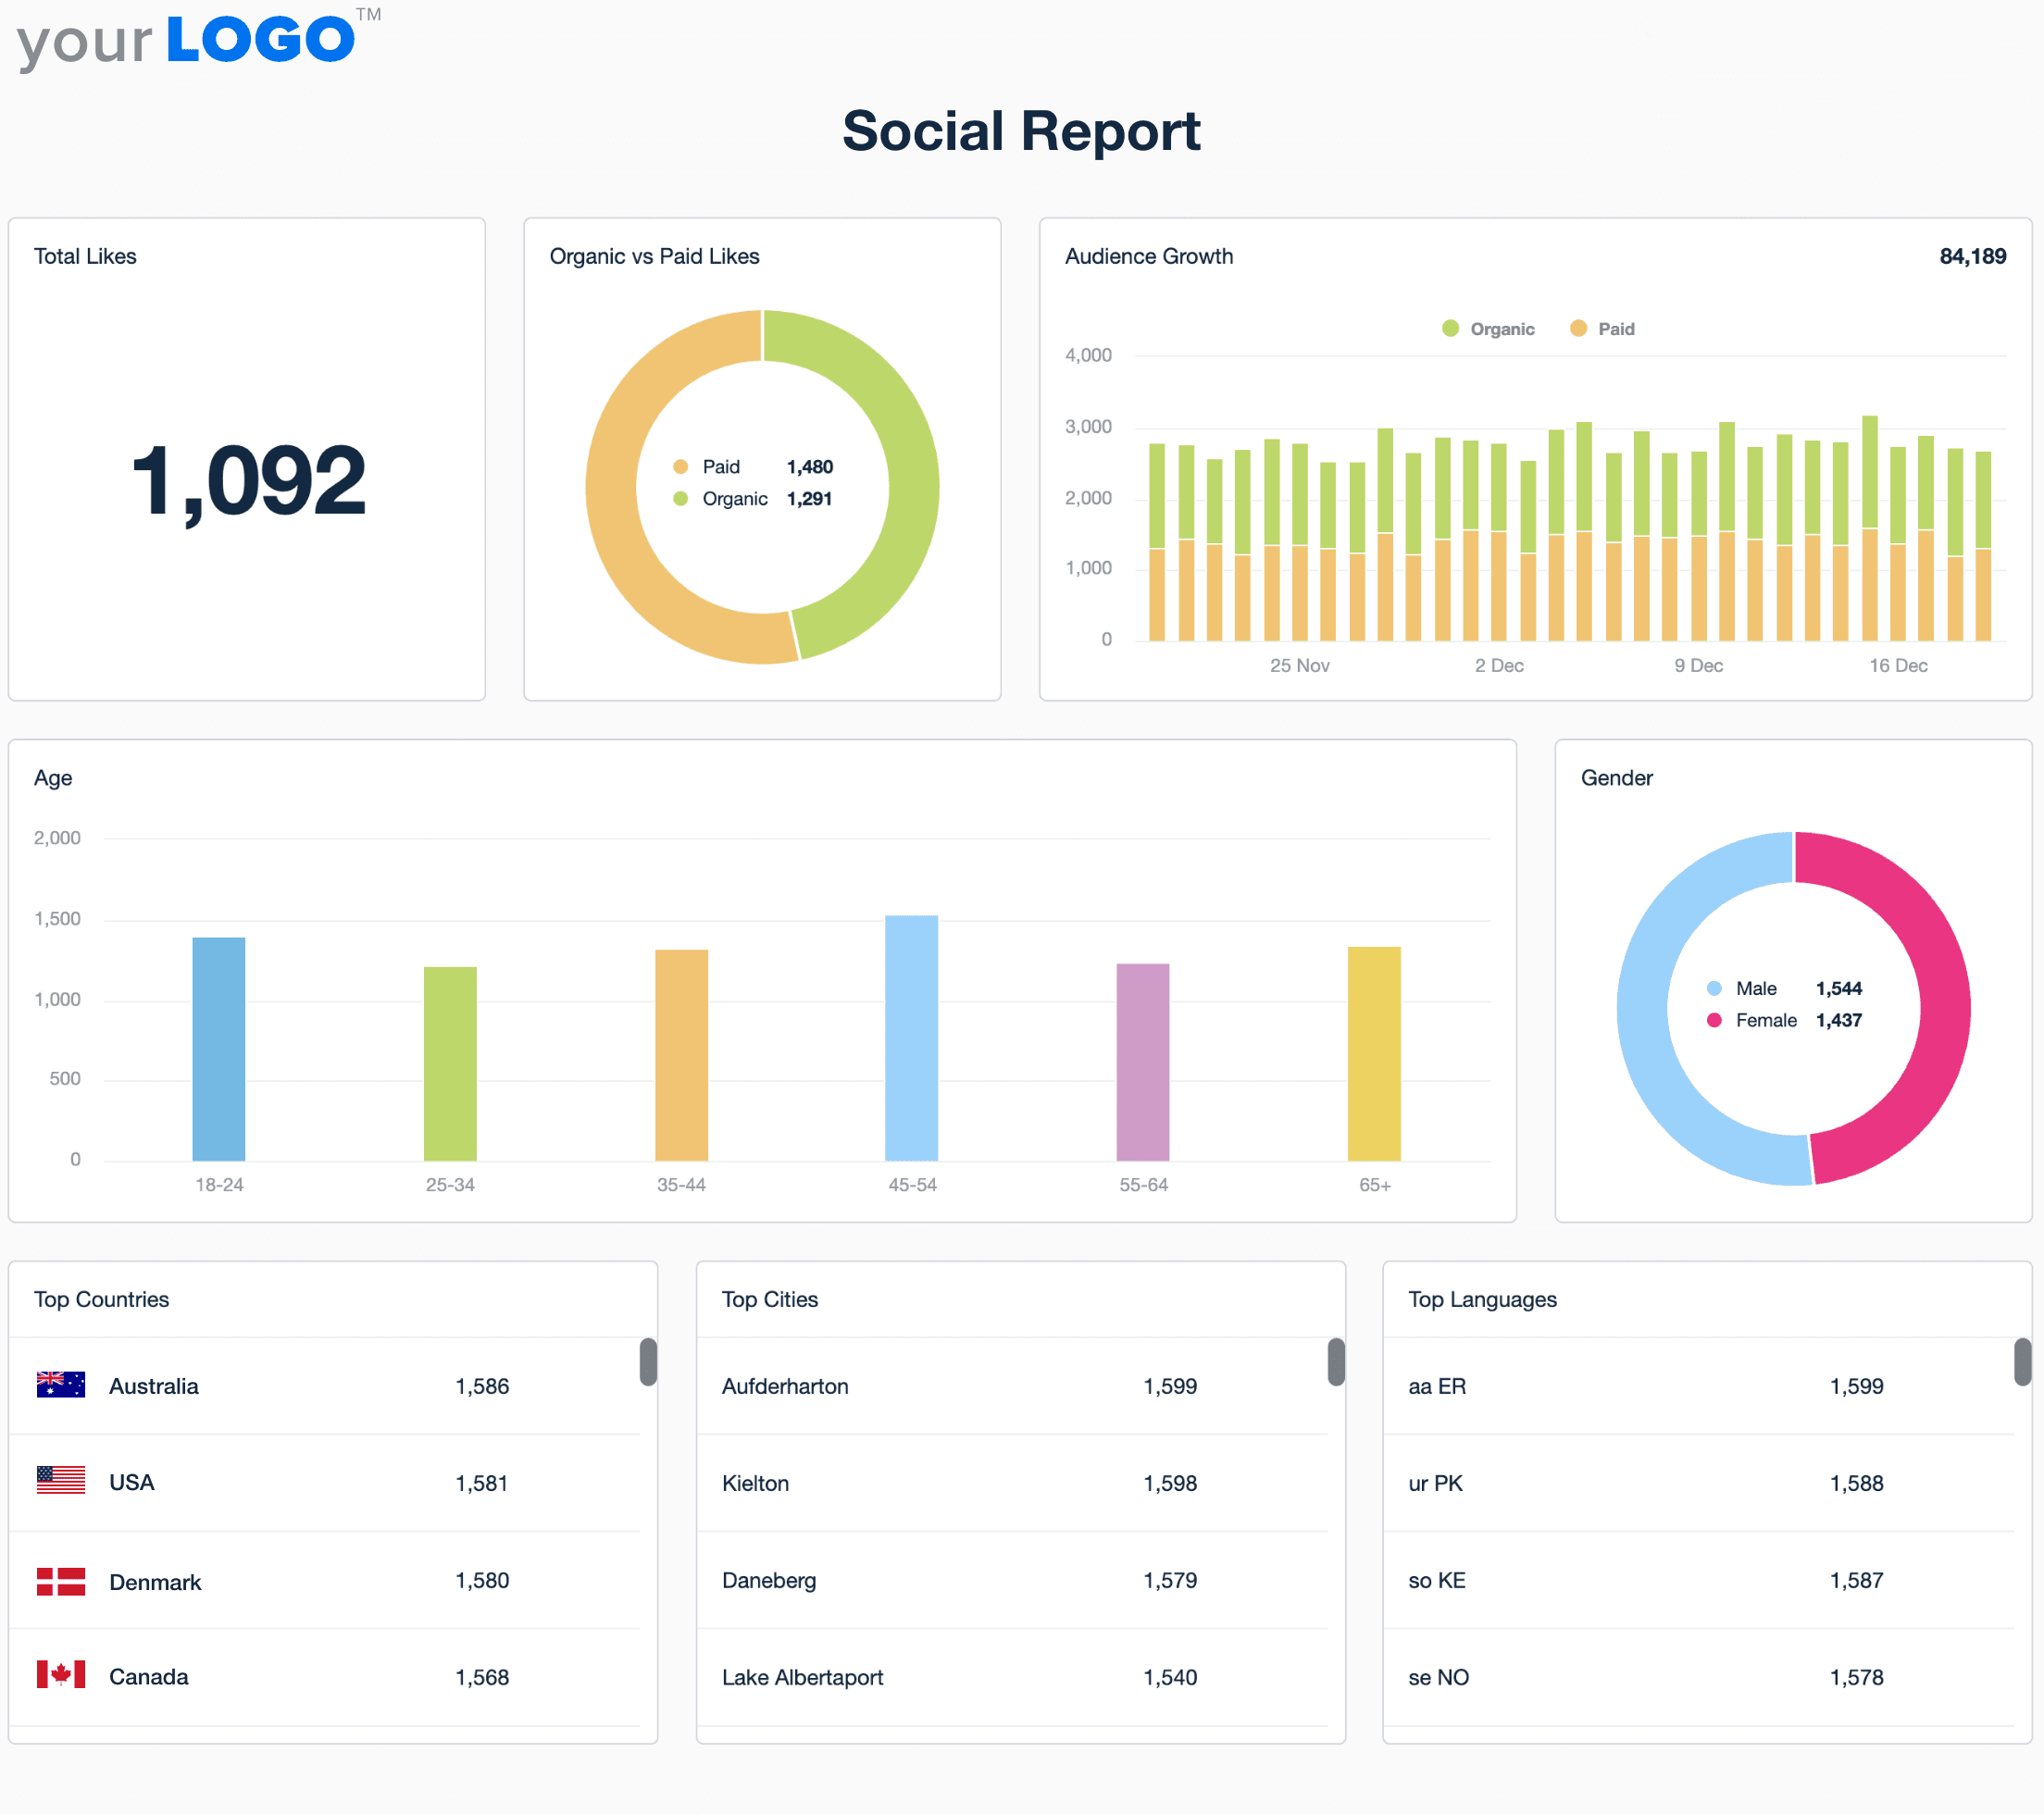
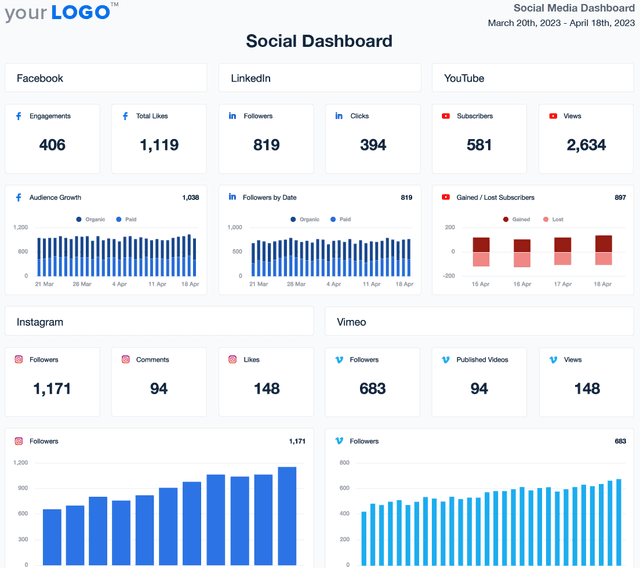
A professional social media report does more than list metrics—it tells a clear story about performance, progress, and priorities. The right structure helps clients understand results quickly, trust the data behind them, and stay aligned on what comes next. These key sections reflect how experienced agencies report on social media performance. Each one focuses on metrics that matter, provides the right level of context, and supports strategic conversations with clients. This customizable social media report template includes the core building blocks agencies rely on to deliver consistent, insight-driven reporting across every account.
Dig Into Channel Performance by Platform Without the Manual Effort
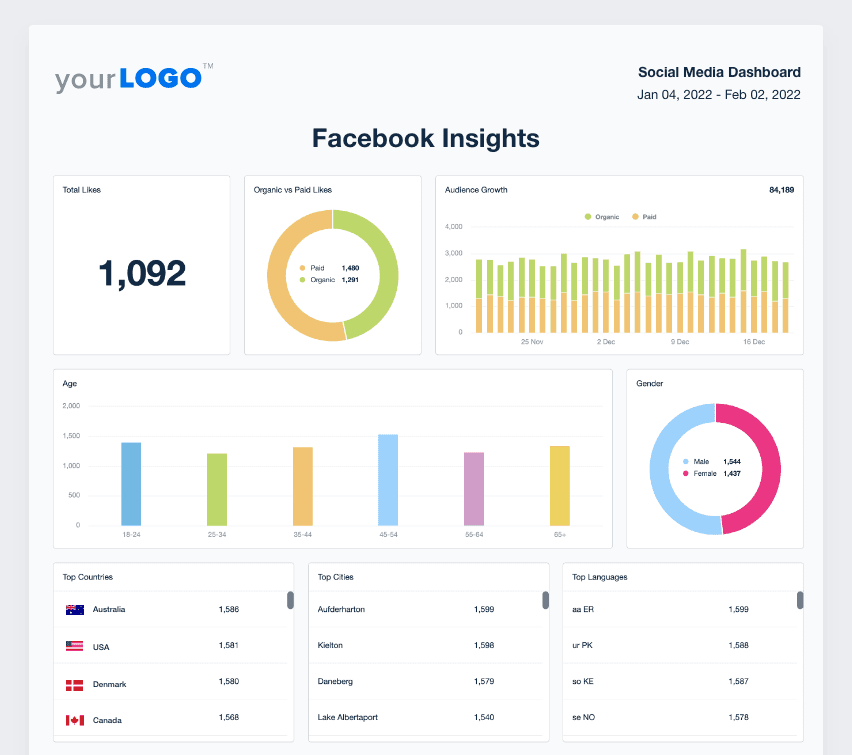
See how each social media platform contributes to overall performance, audience growth, and campaign results—so you know where focus and investment drive the strongest impact.
How to Use the Social Media Report Template to Deliver Results
Create Social Media Reports in Minutes–Not Hours
No more screenshots and Excel spreadsheets! All your client’s real-time social media data is right here waiting for you. With an easy-to-use, automated client reporting platform built for marketing agencies, focus your time on creating social media content that moves the needle.
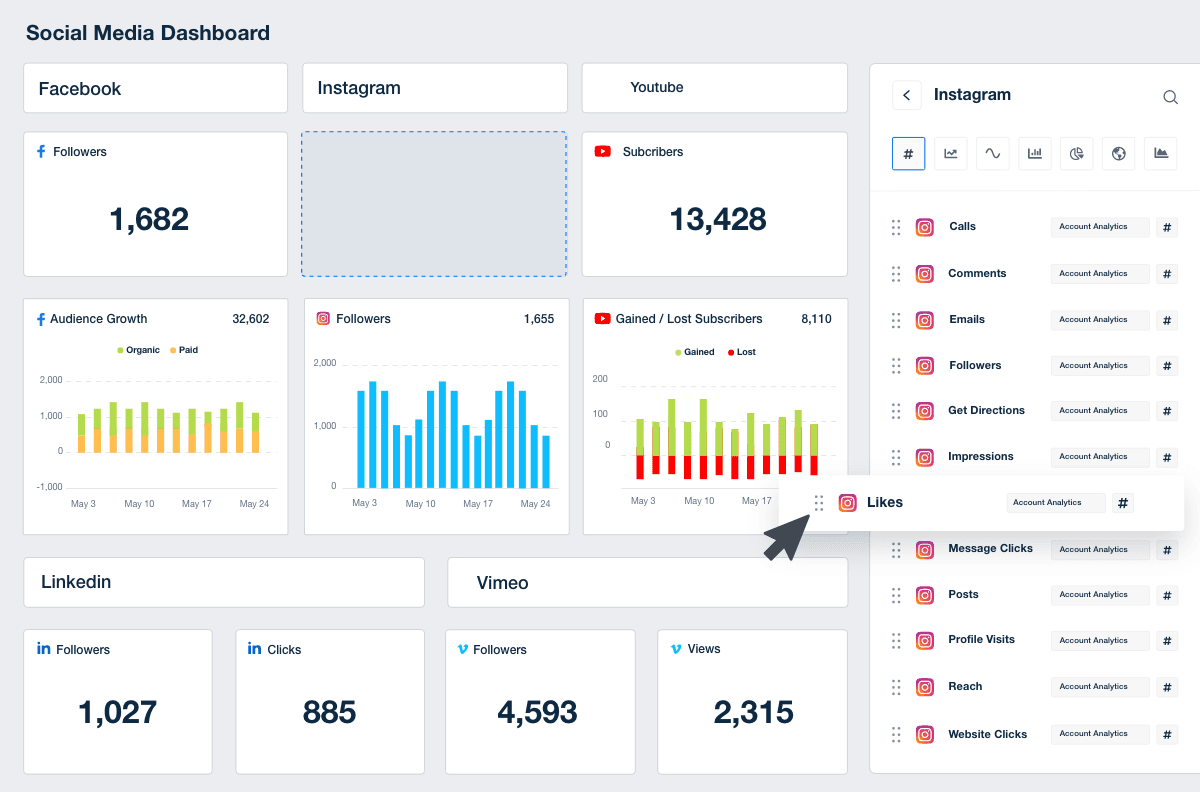
With dozens of report templates and an intuitive drag-and-drop report builder, set up your client reports in no time, with thumbnails of their latest social media posts and all! A social media report template leaves you more time for your social media team to identify actionable insights, optimize client campaigns, scale your agency, and focus on building relationships with your clients.
Instantly Access All Your Clients’ Social Media Data
Switching between multiple platforms to track social media performance is a pain. Not with AgencyAnalytics! Access all your clients’ social media channels from one streamlined platform.
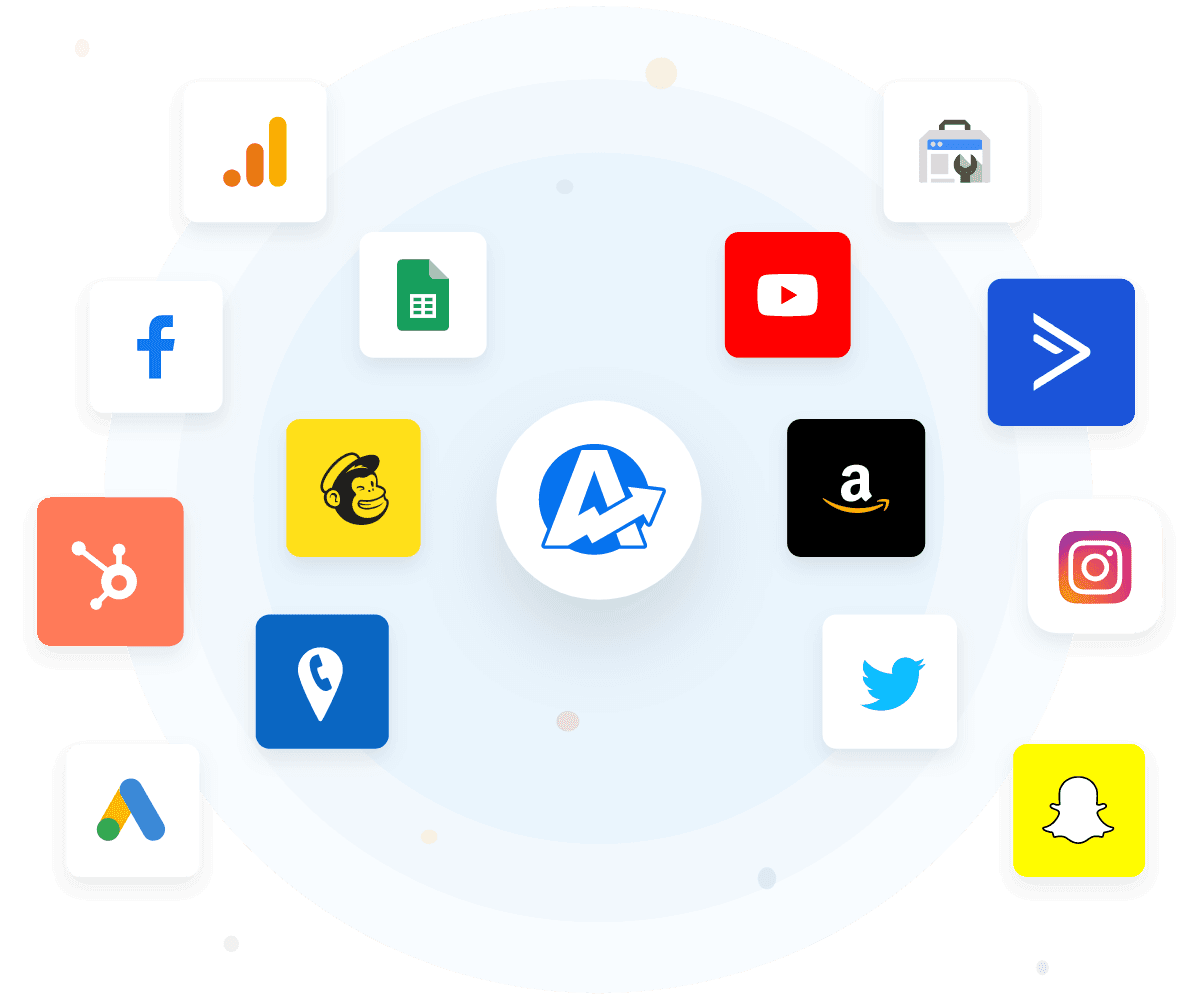
Create reports that paint a complete picture of your social media team's performance by connecting Facebook, Instagram, LinkedIn, Reddit Ads, Snapchat Ads, YouTube, and many more. Managing your client’s social media metrics has never been easier. Go deeper by adding data from over 80 automatic platform integrations to include analytics and insights from PPC campaigns, social media ads, email marketing, SEO, and so much more.
Turn Social Media Metrics into Insights in Seconds
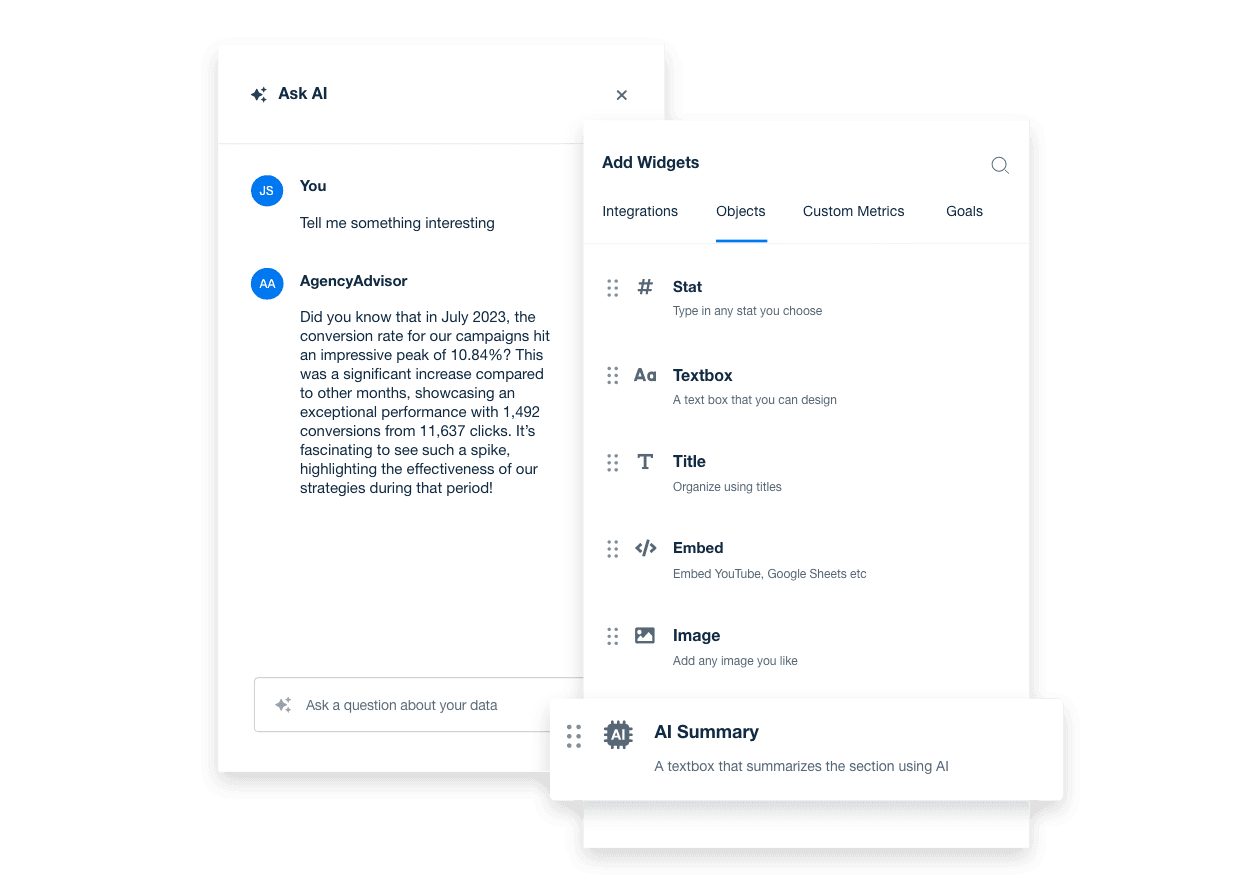
With AI-powered insights built into your social media report template generator, surface the metrics that matter faster than ever. Skip the manual work and pull key data from every connected social platform into one clear report.
Ask AI transforms complex social media data into client-ready takeaways in seconds. From top-performing social campaigns to post reactions, audience growth, and engagement trends, AI Summary delivers high-level overviews that keep your team focused and your clients confident in your digital marketing agency's social media strategy.
Set Social Media Goals and Hit KPI Targets
Create custom social media goals to track what matters most to your clients—whether it’s growing their audience, boosting engagement, or driving more traffic and conversions from social channels. Use goal tracking to highlight key wins against business goals like top-performing posts or follower milestones, turning raw data into a clear, client-friendly story of success.
Strengthen client relationships by connecting every report to real business outcomes, making your agency’s impact on brand visibility, audience growth, and campaign performance impossible to miss.
Real Benchmarks From Real Agency Campaigns
Take the guesswork out of social media reporting with real industry benchmarks built from over 150,000 campaigns managed by leading marketing agencies.
With your custom social media report template, use built in analytics tools to compare client performance against up-to-date data on engagement, reach, and audience growth—so you set realistic goals, show clients exactly how they measure up, and back every recommendation with reliable, real-world data.
White Label Your Social Media Reports
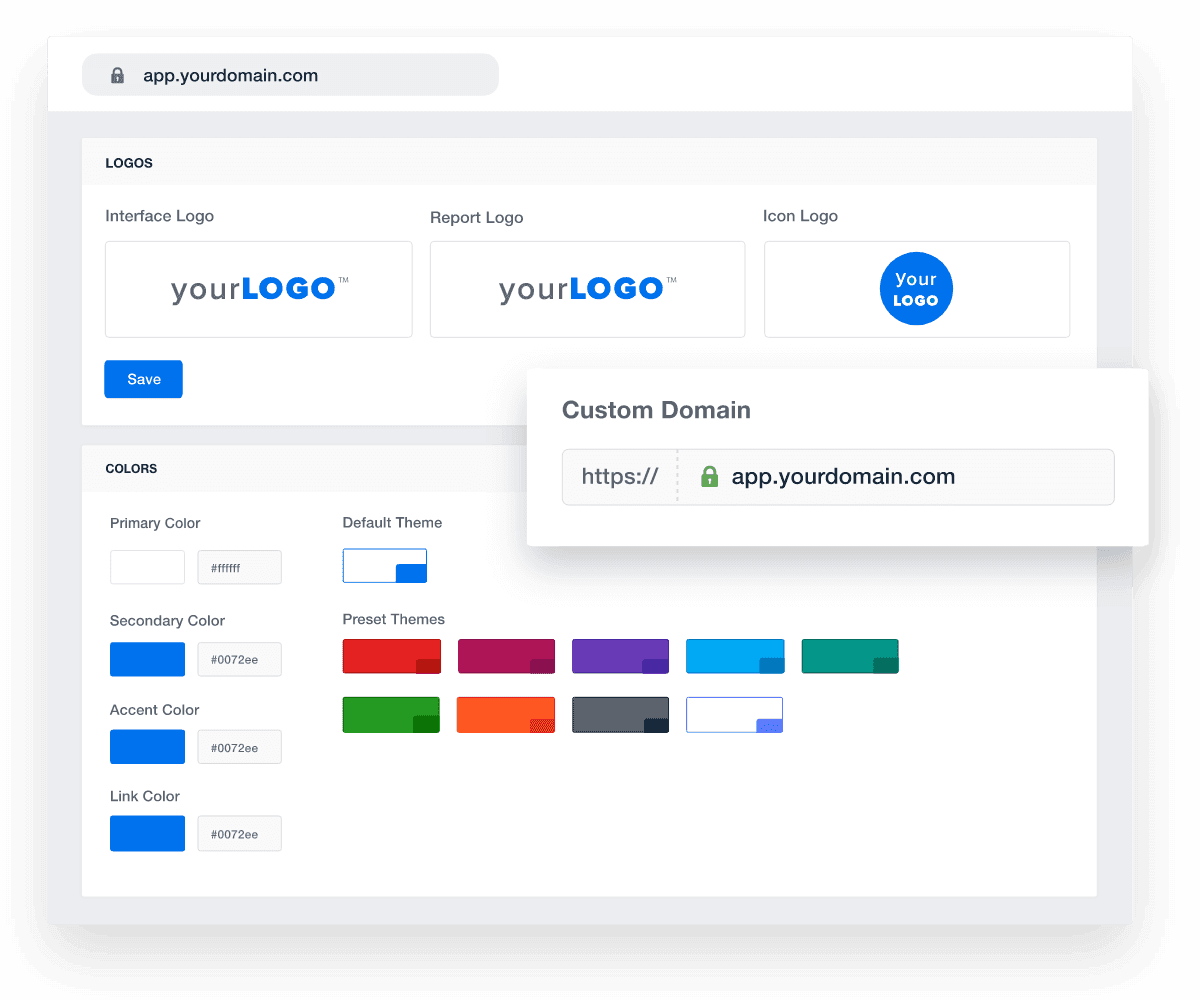
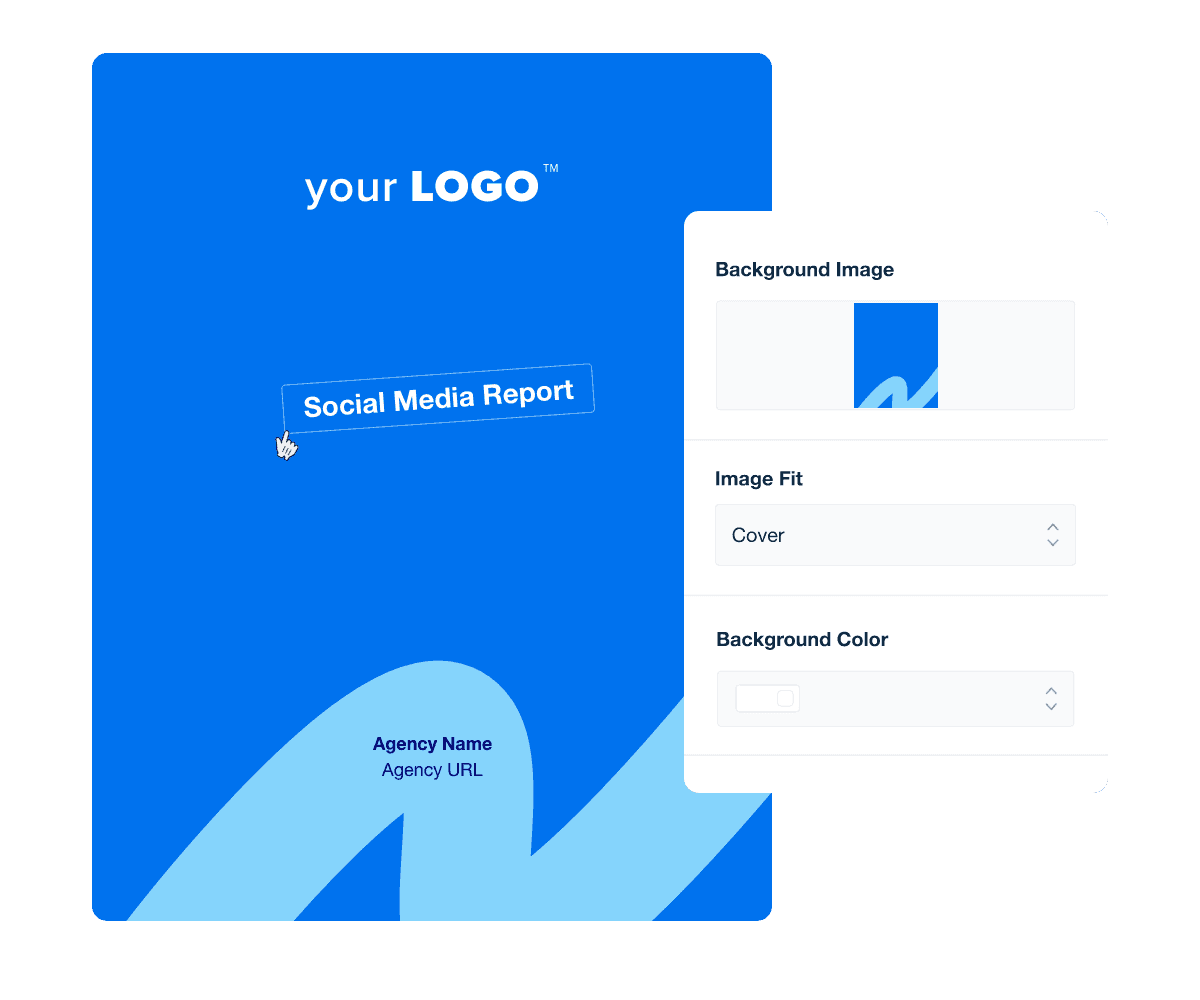
Match your agency’s brand to your professional reports with fully white-labeled dashboards and reports. Just upload your agency logo, use your brand’s color palette, and you’re set! A comprehensive set of white labeled tools helps your agency stand above the competition.
On select plans, create multiple white label profiles for different client-facing brands, including different logos & color schemes. Even host your marketing dashboards on a custom domain and send reports from your email address for a complete white-labeled experience.
Spend More Time on What Matters
Refine your social media reporting process and free up time to focus on what your agency does best—creating campaigns that drive engagement and growth. It’s not just about working smarter; it’s about proving impact where it matters.
Streamline reporting by pulling in key metrics like reach, engagement, follower growth, and post performance—alongside data from 80 other marketing platform integrations. Give clients a complete, professional view of their social media success in one clear, easy-to-read report or live dashboard.
4 Easy Ways to Share Social Media Insights With Clients
Keep key stakeholders in the loop and turn every report into a meaningful conversation. Whether you’re presenting quarterly reports in client meetings or delivering insights automatically, AgencyAnalytics gives digital marketers four seamless ways to share comprehensive analysis that drives informed decision making across every campaign.
Manual or Automated Email Delivery
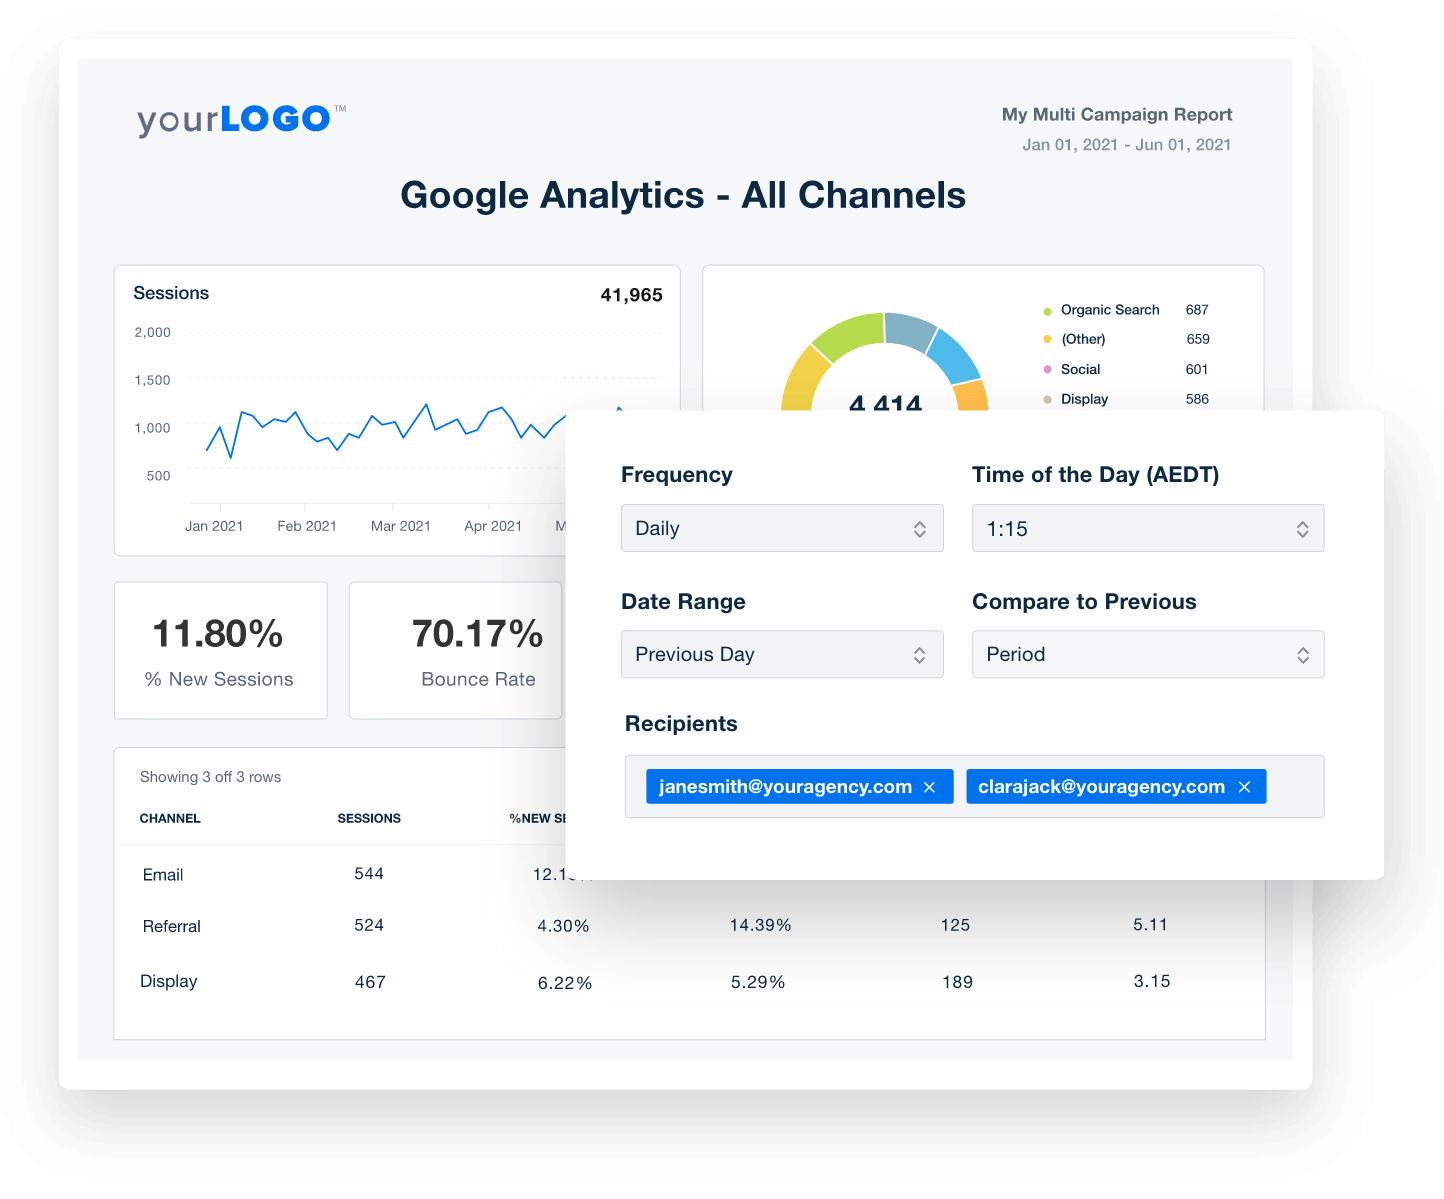
Deliver reports straight to your clients’ inboxes on your schedule—or automate delivery to save even more time. Set up recurring emails to send your social media reports weekly, monthly, or for a specific reporting period, ensuring consistent communication with your clients. Include a PDF attachment for easy offline access and archiving.
PDF Export for Offline Access and Archiving
Download professional, white-labeled PDF versions of your social media reports to share with key stakeholders or reference during internal reviews. Whether you’re reviewing a specific campaign, tracking long-term trends, or preparing a step-by-step guide for a future campaign, PDFs make it simple to showcase your agency’s performance in a polished, portable format.
Presentation Mode for Client Meetings
Turn your live dashboards into presentation-ready visual stories. With presentation mode, agencies display specific metrics such as total engagement, video views, and conversion rates in a format that makes sense for both digital marketers and clients. It’s the perfect way to review performance talking points together and highlight key takeaways in real time.
Shareable URLs for Instant Client Access
Skip the hassle of sending files. Shareable URLs give your clients secure, real-time access to their social media dashboards and reports from any device. It’s ideal for clients who want a quick overview between meetings and ensures that everyone—from account managers to other stakeholders—always sees the most up-to-date data without waiting for a new report.
FAQs About Custom Social Media Report Templates
Still have questions about social media report templates and reporting best practices? Don’t worry, we’ve got you covered!
A social media report template is a comprehensive document that consolidates data points from various social media platforms. It enables marketing teams to analyze performance, track social media campaigns, and present key metrics to stakeholders, ensuring clarity and consistency in reporting.
To write a social media report, collect relevant data points from social media analytics tools and social platforms like Facebook, Instagram, LinkedIn, and TikTok. Highlight marketing performance key performance indicators (KPIs) such as engagement rate, follower growth, and conversions. Analyze data to identify trends and insights, then structure the information to highlight the effectiveness of social media efforts and campaigns.
To make it easier for clients to consume this information, summarize findings, provide actionable recommendations to optimize strategies, and include visual elements like charts and graphs to make data more digestible.
A good social media report presents clear, concise insights into social media campaigns, highlighting key metrics such as reach, engagement, and conversions. It should reflect the impact of social media efforts, provide context through industry trends, and offer actionable recommendations to refine strategies. Key elements of a strong social media report include:
A clear summary of performance highlights
Data visualizations that make trends easy to understand
Context and analysis explaining why metrics changed
Actionable recommendations to improve future performance
Custom branding that reflects the agency’s professionalism
As an agency or social media manager, compile monthly reports by aggregating data from all social media platforms, focusing on key metrics like new followers, engagement rates, and campaign performance. Analyze performance to identify growth opportunities and key learnings, providing the leadership team with insights to guide future social media efforts.
An automated social media reporting tool should make it easy to showcase progress over time and provide strategic insights. The process includes:
Comparing this month’s metrics to previous months to identify trends.
Breaking down performance per platform—engagement rates, impressions, clicks, and conversions.
Highlighting top-performing content to understand what resonates with the audience.
Analyzing audience demographics and behaviors.
Addressing challenges and opportunities for improvement.
Outlining next steps, including content strategy adjustments and campaign optimizations.
A social media report should include key metrics such as engagement rates, follower growth, reach, and conversions. It must cover performance across all relevant social media platforms, analyze data to assess the success of social media campaigns, and offer insights to refine strategies and target audience engagement. The most important elements include:
Engagement metrics – Likes, comments, shares, and saves
Follower growth – Increases or decreases in audience size
Reach and impressions – How many people saw the content
Click-through rate (CTR) – How effectively posts drive traffic
Conversions – Sign-ups, purchases, or other business-driven actions
Platform-specific insights – Performance breakdowns for each social network
Campaign performance – Results from paid and organic efforts
A report should avoid unnecessary complexity and vanity metrics that don’t provide real value. Avoid including excessive or irrelevant data points that do not contribute to understanding social media campaigns' effectiveness. Exclude vanity metrics without context, and refrain from presenting data without analysis, as this can obscure the impact of social media efforts and hinder decision-making.
Here are some things to avoid:
Overloading with raw data – Stick to key insights rather than dumping numbers.
Irrelevant or vanity metrics – Focus on KPIs tied to business objectives.
Unexplained performance trends – Always provide context for data fluctuations.
Unactionable data – Ensure insights lead to clear next steps.
Too much technical jargon – Keep explanations accessible for all stakeholders.
Automate social media reporting by utilizing tools like AgencyAnalytics, which integrate with over 80 marketing platforms to pull up-to-date data. This automation reduces the need to manually gather data and collate it into Google Sheets, Google Slides, or other manual reporting tools. This automation gives marketing teams more time to focus on analyzing data and refining social media campaigns. Apply custom branding and schedule reports to send to clients at regular intervals, typically monthly. This reduces manual work while providing professional, up-to-date insights.
Every client has unique goals, so reports should be customized based on their priorities. AgencyAnalytics allows full customization of social media report templates to suit different clients. Tailor reports by selecting specific data points, key metrics, and branding elements, ensuring each report aligns with the client's social media campaigns and target audience.
Some clients care more about engagement, while others focus on lead generation or ROI. Tailoring reports ensures each client receives insights that matter most to their business.
See how 7,000+ marketing agencies help clients win
Free 14-day trial. No credit card required.


