Web Analytics Dashboard
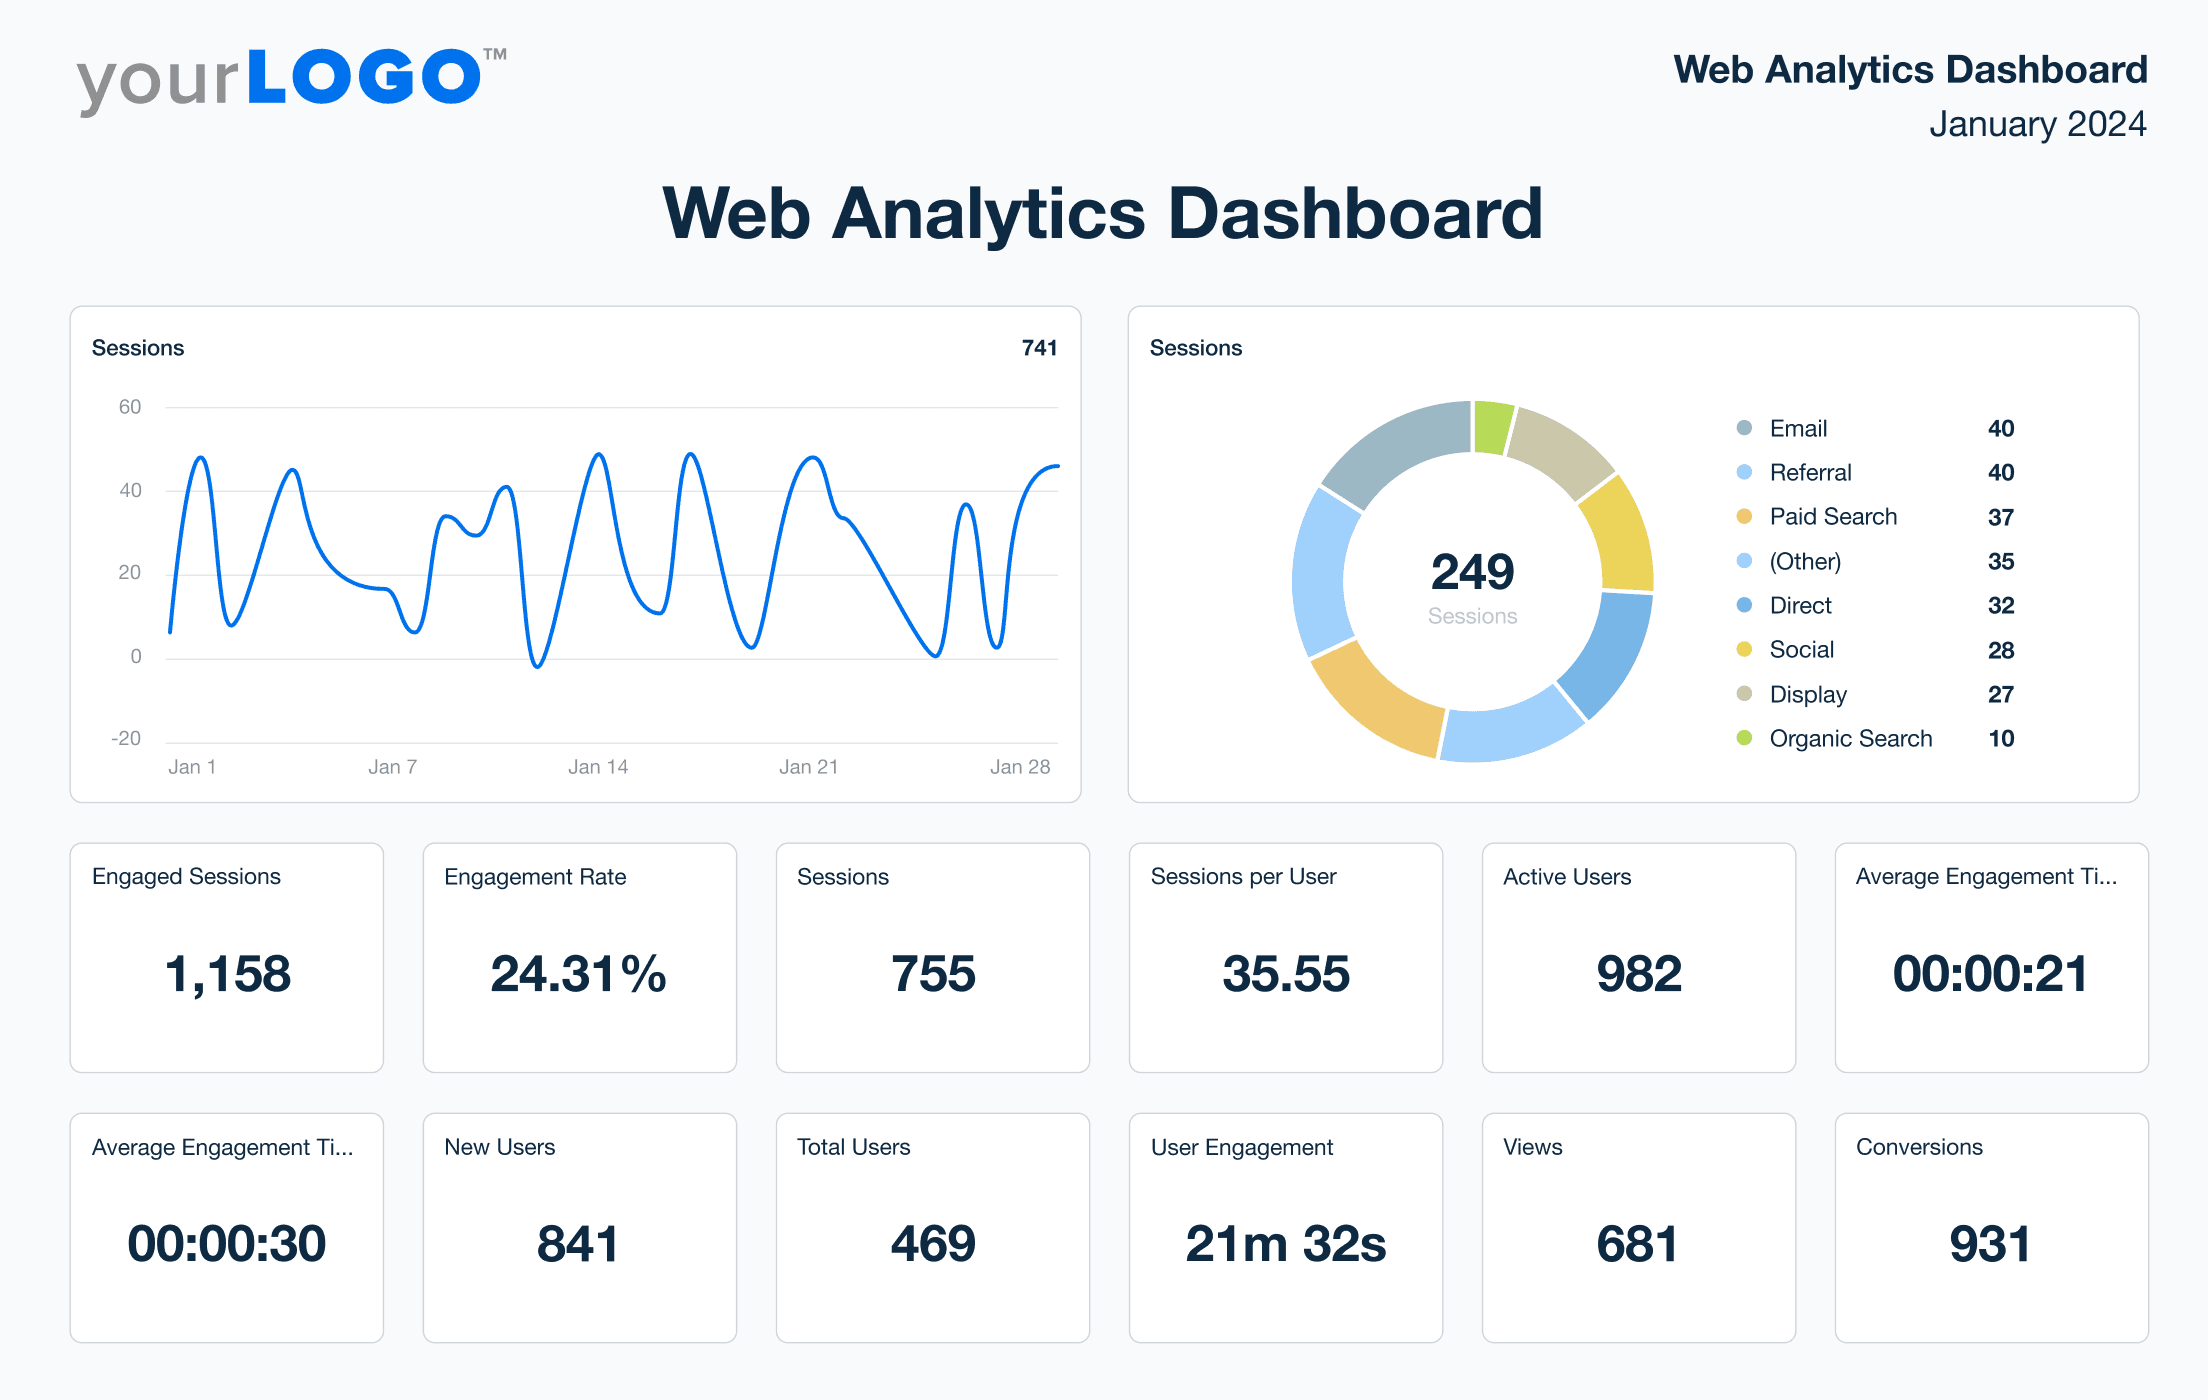
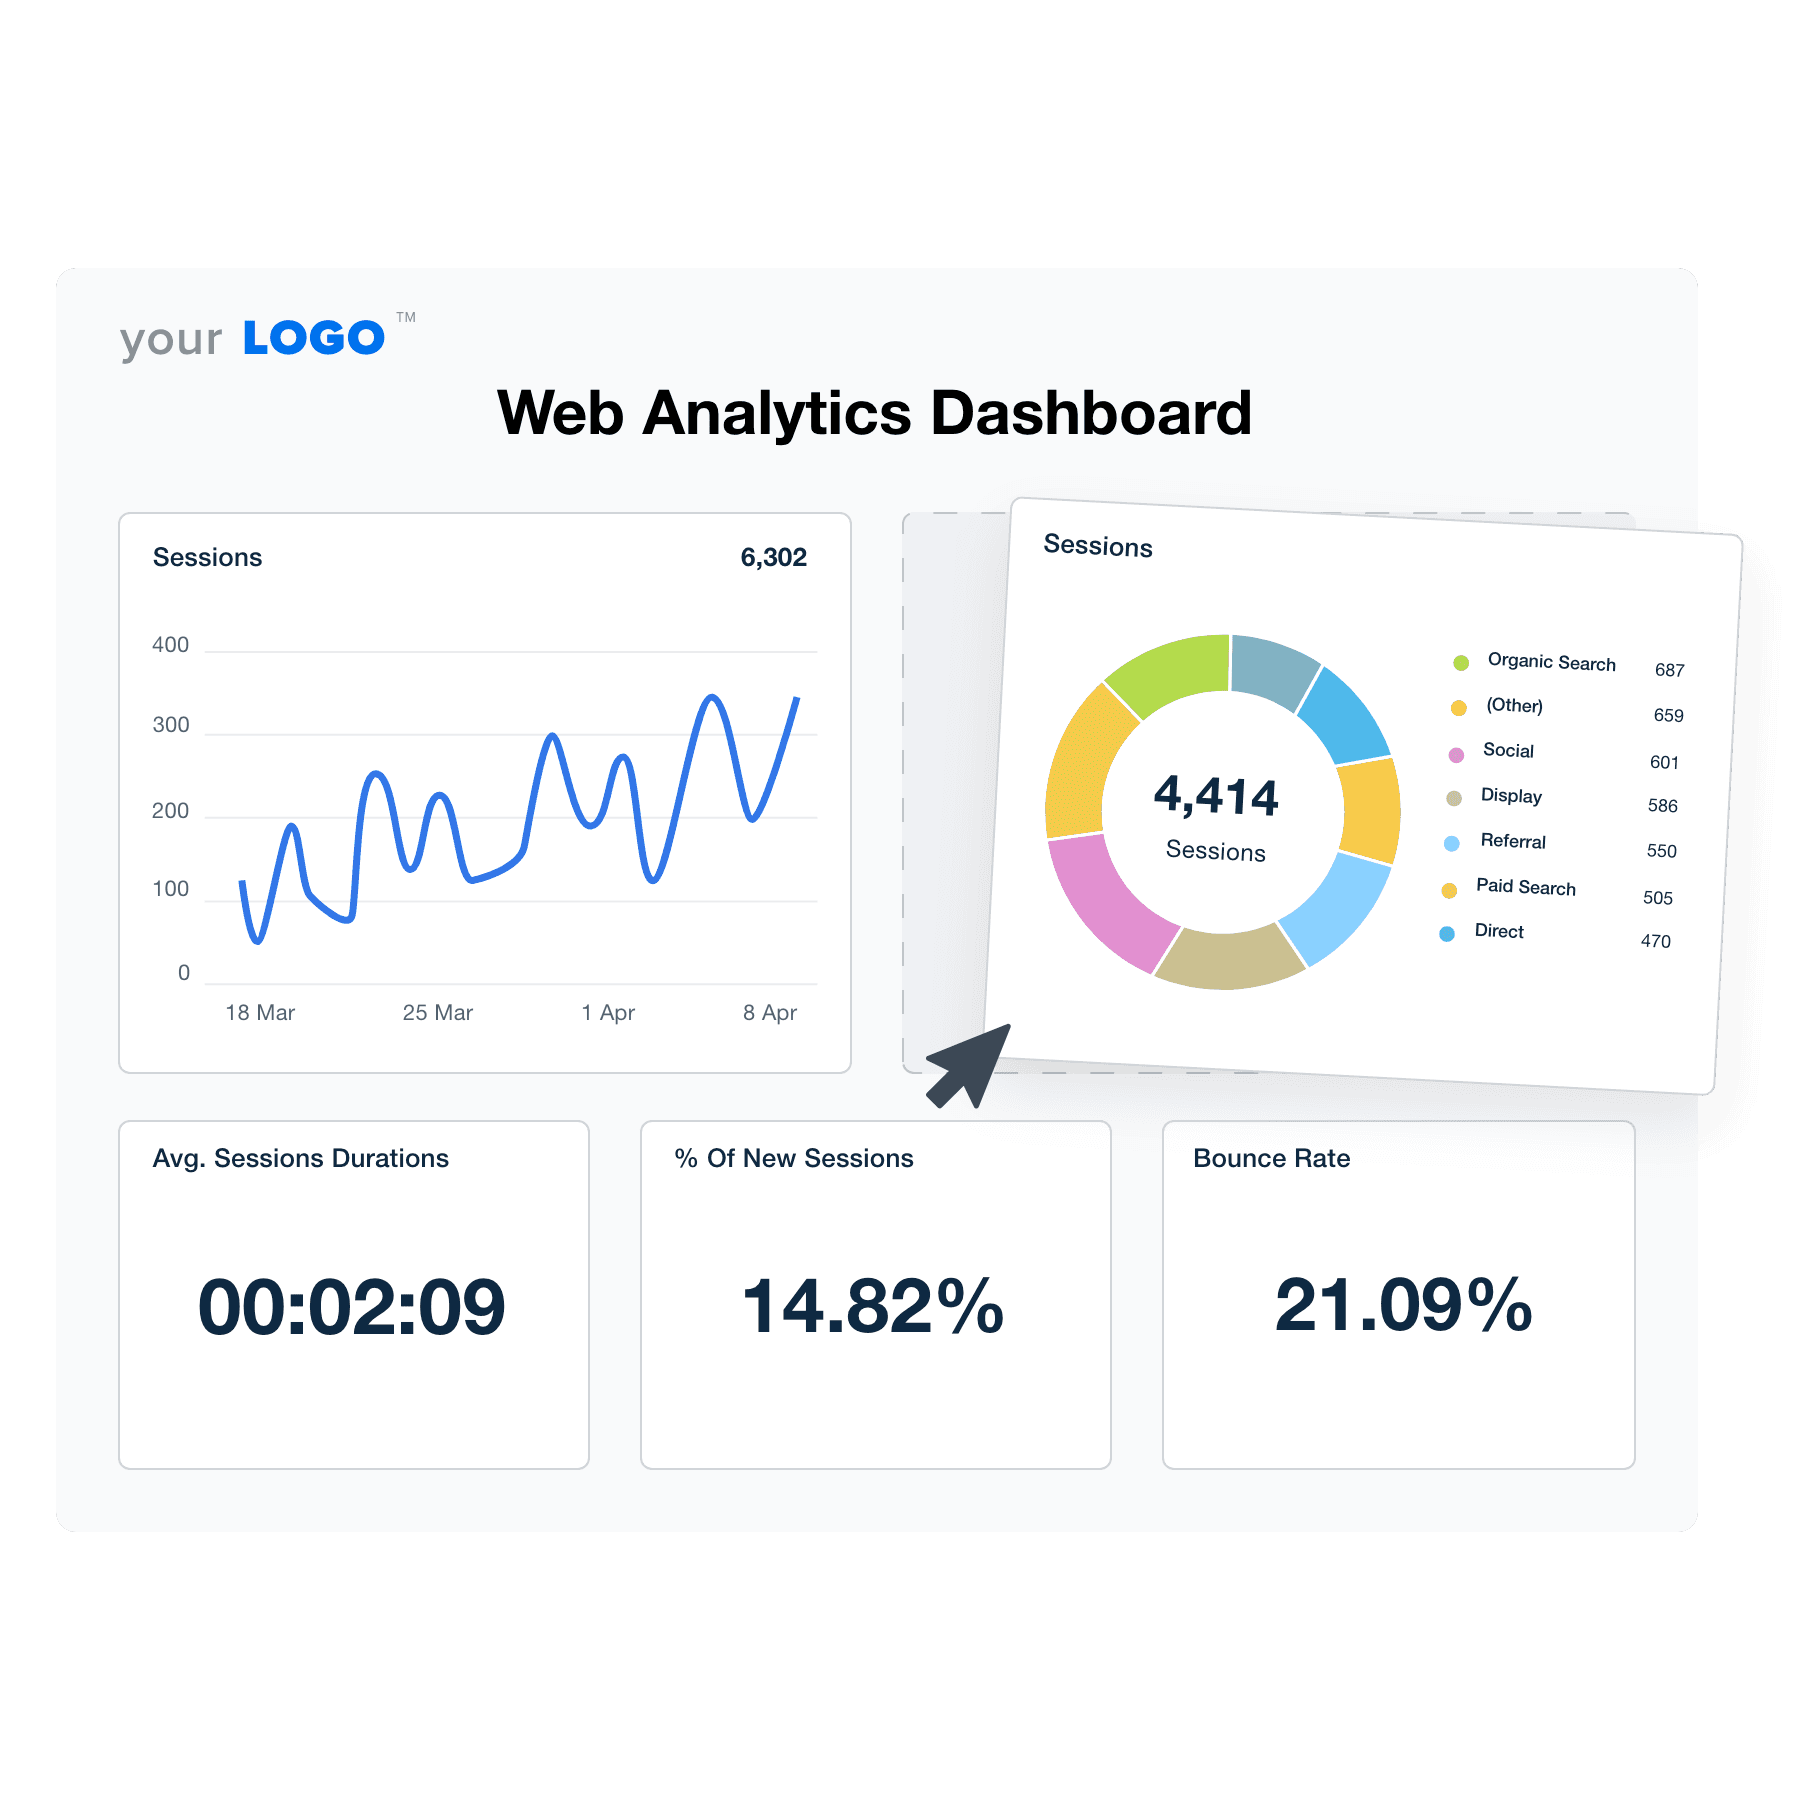
Track the marketing metrics that matter most to your clients with our website analytics dashboard.
Why Your Agency Should Use a Web Analytics Dashboard
Analyzing customer behavior and generating performance reports for your client's website can be tough, especially when you have to sift through data from various platforms.
Using a marketing dashboard that integrates Google Analytics data allows you to analyze, share and report website insights simply and concisely. The platform makes it easy to gain campaign performance insights by sorting pages based on crucial metrics like top exit pages, bounce rate, and user sessions.
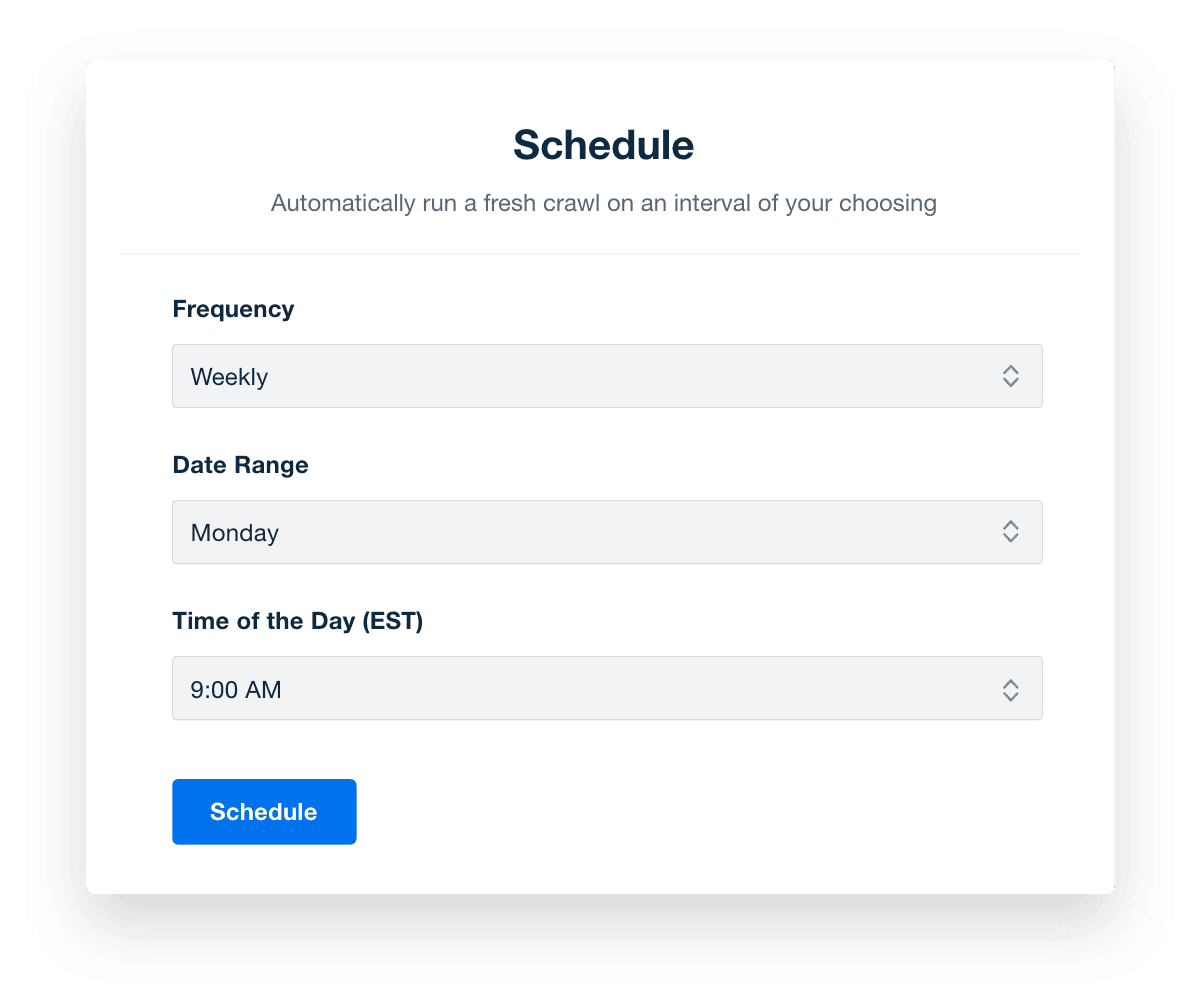
Your clients won't have to miss out on key insights as well because you can provide them with a login to the dashboard so they can view user events in real-time, or you can send them scheduled automated reports (using our web analytics report template).
Easily Track All Your Client’s Web Analytics Data
Start Your Free Trial Today!11 Sections Included In Our Template
1. Goal Conversions
Goal conversions allow you to determine what actions on your clients’ websites align with their company objectives. You can choose certain actions or interactions like filling a contact form or clicking on a call-to-action button and set them as goals. AgencyAnalytics pulls in this information via Google Analytics.

Defining your goals is a critical aspect of any web marketing strategy. Properly defined objectives allow the dashboard to provide you with valuable data such as conversion rates and the number of conversions your campaigns are achieving.
This information helps your marketing team evaluate the effectiveness of your marketing strategies and will help you provide your clients with meaningful progress reports.
2. Goal Value
The goal value metric is the monetary amount you assign to a specific conversion. Every time a visitor completes the revenue-related goal, there should be a dollar amount attached to it so you can track the return on your digital marketing activities.

This doesn't have to be limited to eCommerce–any goal can have a value. Just figure out what that conversion is worth for your client. This metric will let you assign the value of each conversion so you can clearly quantify the ROI of your marketing efforts.
3. Conversion Rate
Conversion rate represents the percentage of visitors that have converted on a specific page. When a particular landing page has a high conversion rate, it indicates that the page is effective in motivating users to carry out the desired action tagged as a conversion. It's a vital KPI to track because it tells you immediately if people are responding to your offer.
You can analyze the conversion rates of your clients’ landing pages to know what strategies are most effective in converting website visitors into customers. If the insights on your website analytics dashboard reveal that the conversion rate of a particular page is high, you can figure out the kind of content or design elements your client’s target audience finds appealing. With pages exhibiting low conversion rates, you may want to revisit them and find out what elements to improve for a boost in conversions.

You can base conversion rates on goals or traffic sources. When users complete a goal, the percentage is the conversation rate of that goal. For example, if a conversion goal were for visitors to fill and submit a contact form, the percentage of users who satisfy this goal on a particular page would be the conversion rate of that goal on the page.
4. Page Views
The page view metric measures pages that are loaded or reloaded in a web browser. It is the total number of pages viewed by visitors. This metric, however, does not reveal the number of visitors who viewed the page or how often the pageviews occurred in each session.

This means that a single visitor may be responsible for multiple page views, and that a particular page can be viewed many times in each session. Page views can offer an indication on the popularity of a post, but having high page views doesn't necessarily equate to post popularity.
Using this KPI alone to determine how viral a post is may provide inaccurate results. You need to combine it with other metrics like unique visitors and page views per visitor to get the accurate results.
5. Bounce Rate
The bounce rate of a client's website’s page is the percentage of visitors who left the website right after coming to a page. If a website visitor lands on the page from a social media post or search engine and leaves immediately without navigating to any other page, it will be reported as a bounce.

Your goal should be to keep the bounce rate as low as possible. If the bounce rate of a particular page is high, then you may want to figure out why it's happening. One of the most probable reasons is that the page takes too long to load. The bounce rate could also be high if certain design elements on the page are not relevant to the target audience or you may need to improve the content quality of the page.
This metric gives you an idea as to why visitors are not staying on your client's website. Using the data, you can restructure your strategy to address why prospects are not staying long enough to convert.
6. Traffic Sources (Percentage Breakdown)
Monitoring traffic sources helps you know where your client's site visitors are coming from. This is an important metric, especially if you are on a budget and running an ad campaign for your client.

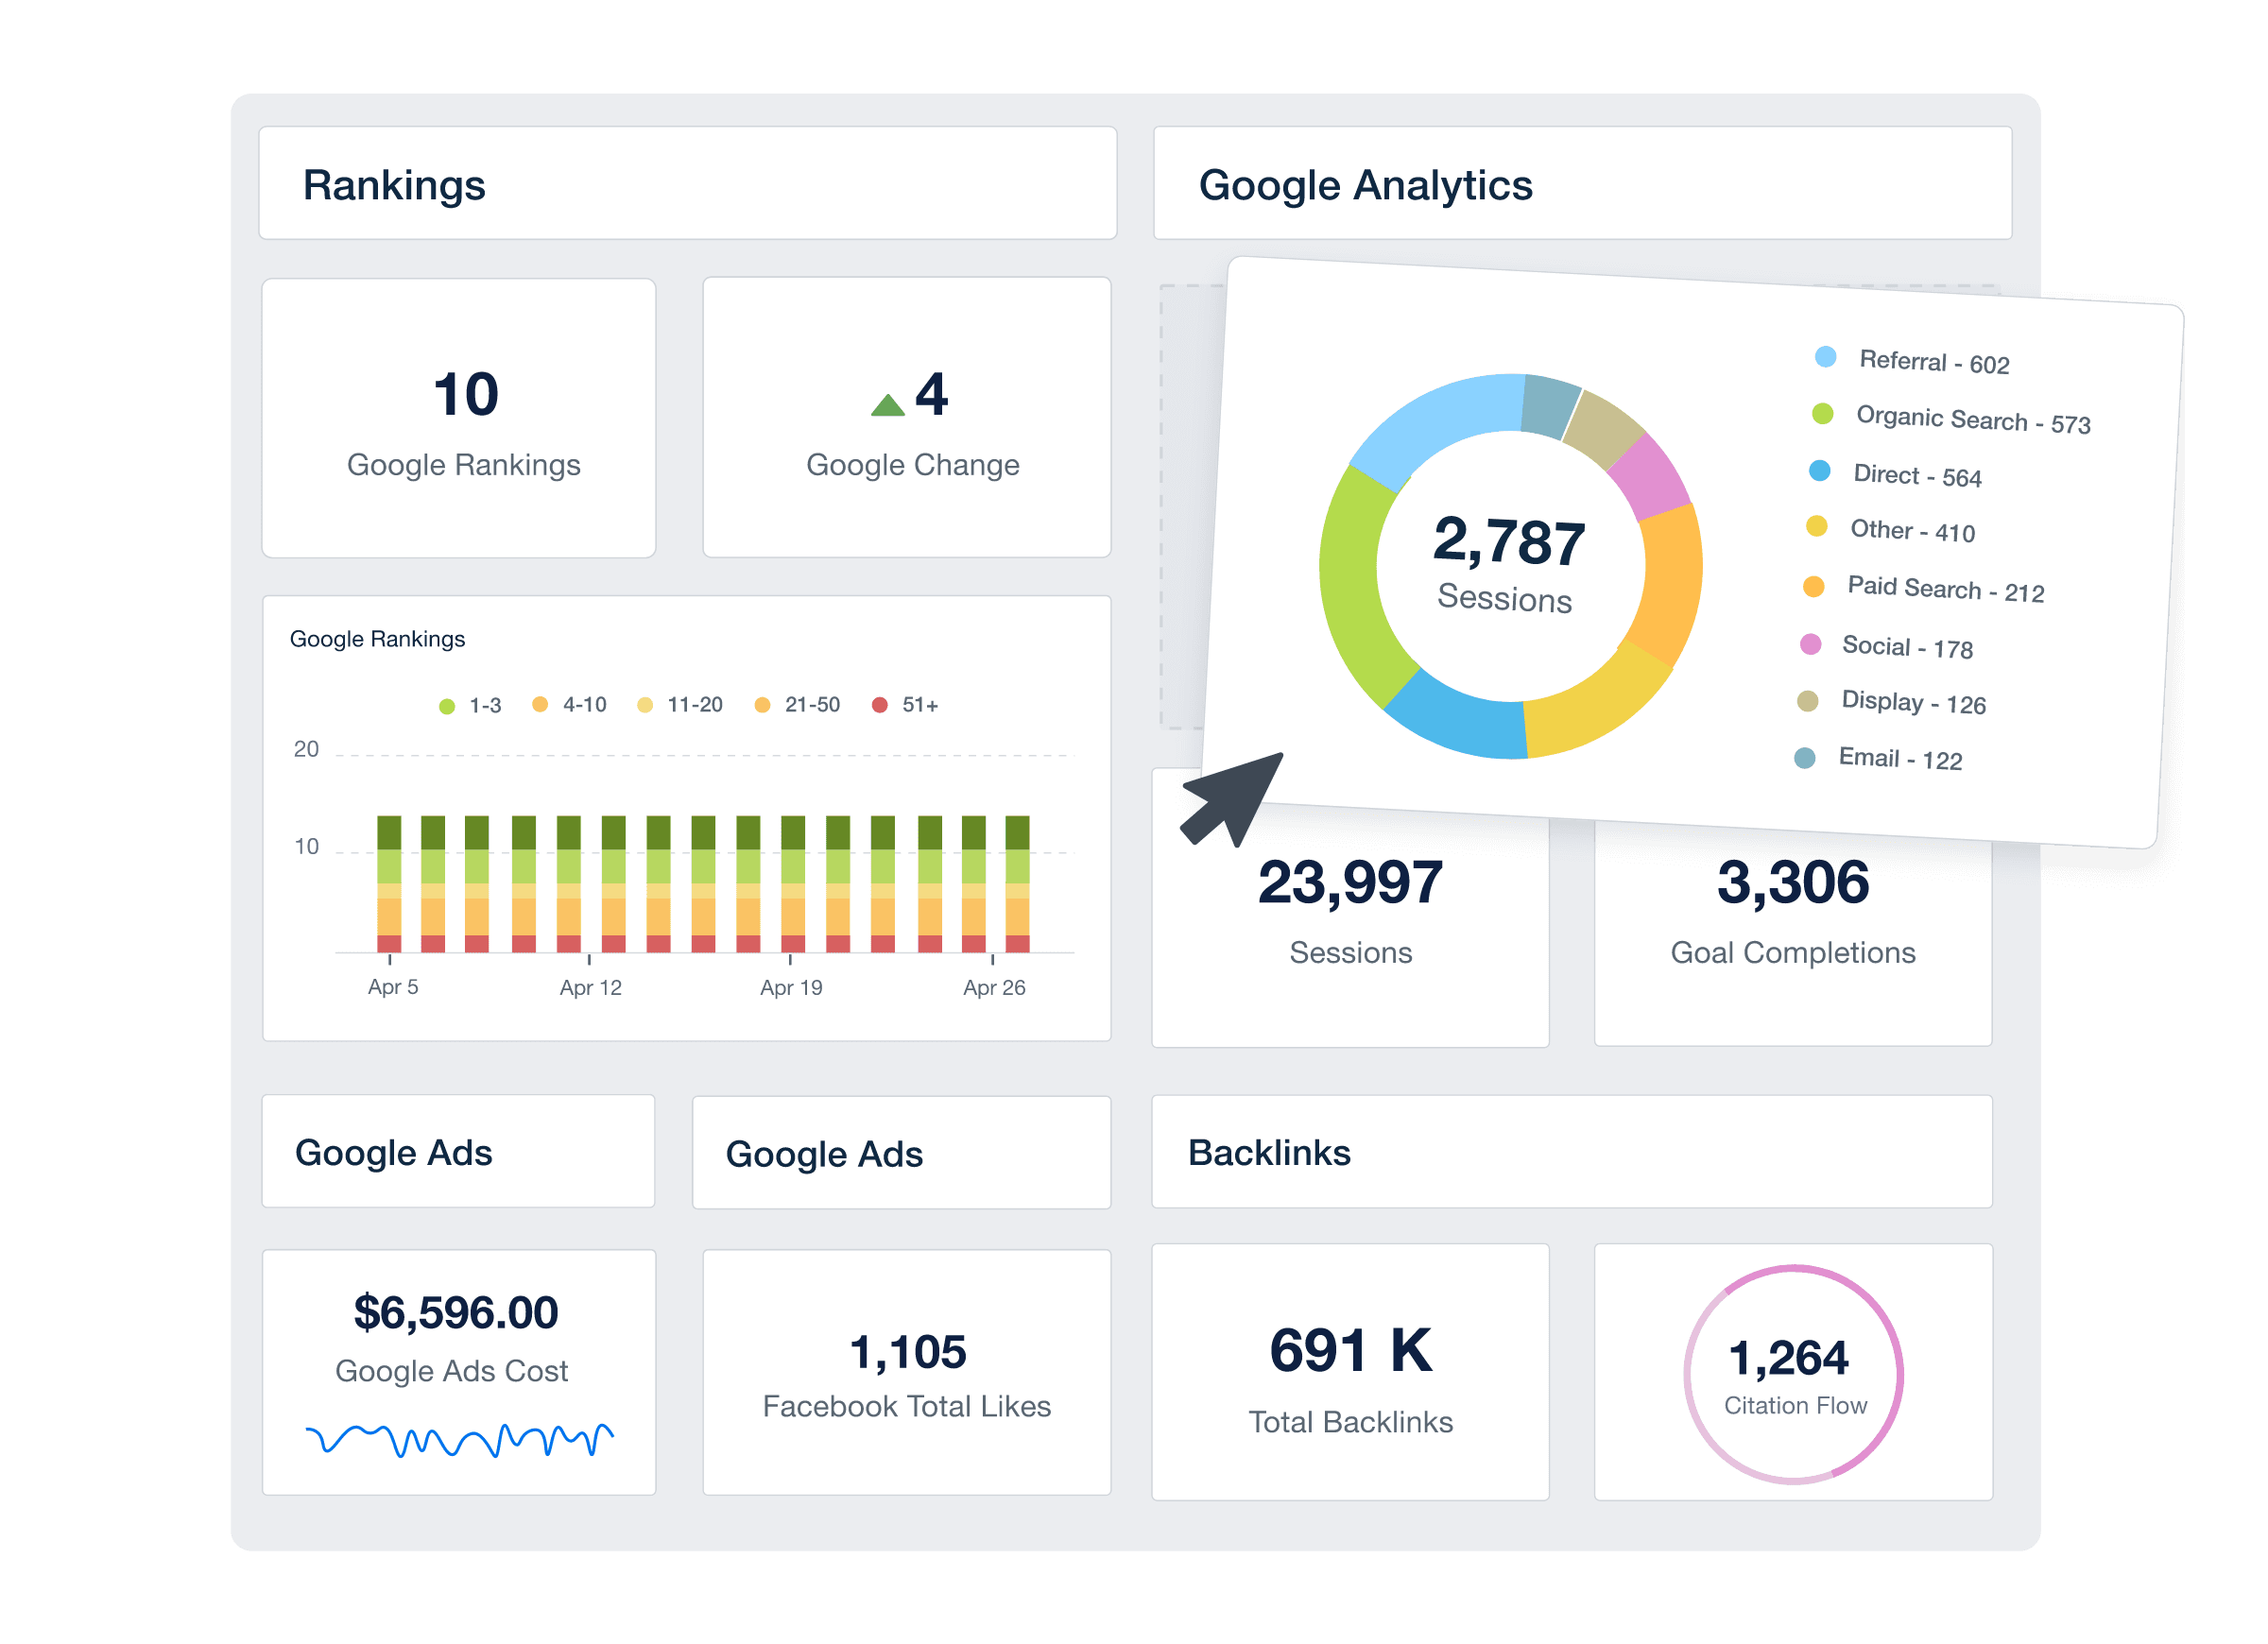
The main traffic sources that are brought in via Google Analytics are: search traffic (SEO), direct traffic, referral traffic, paid traffic (PPC) and social media traffic. By analyzing the percentage breakdown of the various traffic sources you can easily point out which marketing campaign strategy is sending traffic to the website.
7. Sessions
The session metric measures a group of user interactions with a website that occur within a specific period. A single session can have numerous page views, social interactions, purchases, and events. Sessions are like the container of the actions visitors take on the website.

One user can have multiple sessions and they can all happen on the same day, over weeks, or months. Immediately one session expires, another one can start.
Sessions can end in two ways:
Time-Based Expiration: Time-based expiration occurs at midnight based on your time zone setting or after 30 minutes of user inactivity, but you can adjust it to several hours or some seconds.
Campaign Change: A session can end if a visitor lands on the web page through one campaign, exits, and arrives again via another campaign.
Using the session metric you can identify the user’s journey to conversion by monitoring their interaction with the website. You'll be able to know what events they carried out and what pages they spent the most time on.
8. Users (Unique Visitors)
Users are the number of unique website visitors. This metric is definitely one your clients want to see on their web analytics dashboard, as it measures if the website's audience is rising, stagnant or decreasing.

You may need to be careful when taking the numbers of users into account because a rise in unique visitors might not necessarily mean an increase in web audience. A single user may come to the site today, leave and come again tomorrow and this would appear as a unique visit on both days. It depends on whether cross device tracking is set up correctly.
It's not the end-all-be-all metric but it's important to see how many people are visiting a website.
9. Pages per session (Pages/Session)
The pages per session is the number of pages viewed in a single session. This is a great engagement metric for brands that desire high engagements, and low bounce rates. To calculate this metric you need to divide the number of pages viewed by the number of sessions of the website.

For example, If your client's website has had 2000 sessions and 4500 page views, your page/session would be 4500/2000, which equals 2.25 pages per session.
Page views per session is an excellent indicator of engagement. Most times, the more pages a visitor navigates to shows that they have an interest in your client's website content. This may not hold if the time spent on each page is small as it could be pointing out a user who is unable to find what they are searching for on the website.
10. Top Landing Pages (By Page Views)
A landing page is the initial page visitors arrive on from a traffic source. It's the page that initiates a session. Let's say you implemented a new SEO strategy, a landing page can give insights into what attracted the target audience to navigate to the website.

In a sense, landing pages offer you knowledge on your client's audience. You can identify what landing pages are performing better based on the number of views each one gets. The page views tell you if visitors were satisfied with the content they saw after landing on the website or if not.
Once you locate the top landing pages by page views, you can then replicate the tactics that pulled in a high amount of page views on poorly performing landing pages.
11. Top Exit Pages
For most client websites, prospects will need to navigate from the landing page or homepage to convert. If you want to boost website conversions, it's vital to know which page visitors exit on. Locating the top exit pages will most times point out where users experience difficulties that prevent them from converting.

Let's say potential customers are exiting the client's website on the checkout page. This kind of user behavior could indicate a tedious checkout process or an error in the process. You then need to know what pages visitors are leaving on and find out why they leave the website on those particular pages.
Need more sections or custom metrics? No problem, AgencyAnalytics lets you easily drag and drop new sections to your web analytics dashboard.
Streamline Your Agency’s Web Analytics Reporting
Start Your Free 14-day TrialWhy Your Agency Needs a Web Analytics Dashboard
Live, Customizable Dashboards

Control Who Sees What Web Analytics

Automate Your Client Reporting

Full White Labeling Features

I was looking for a reporting tool for my clients, but I found a whole lot more. My business is SEO focused, so the added tools, such as rank tracking were a big plus.

OnPoint Results
Check out our Web Analytics Dashboard