NOW AVAILABLE: Unlock Data-Driven Insights with AI, Benchmarks, Anomaly Detection & Forecasting

PPC Dashboard

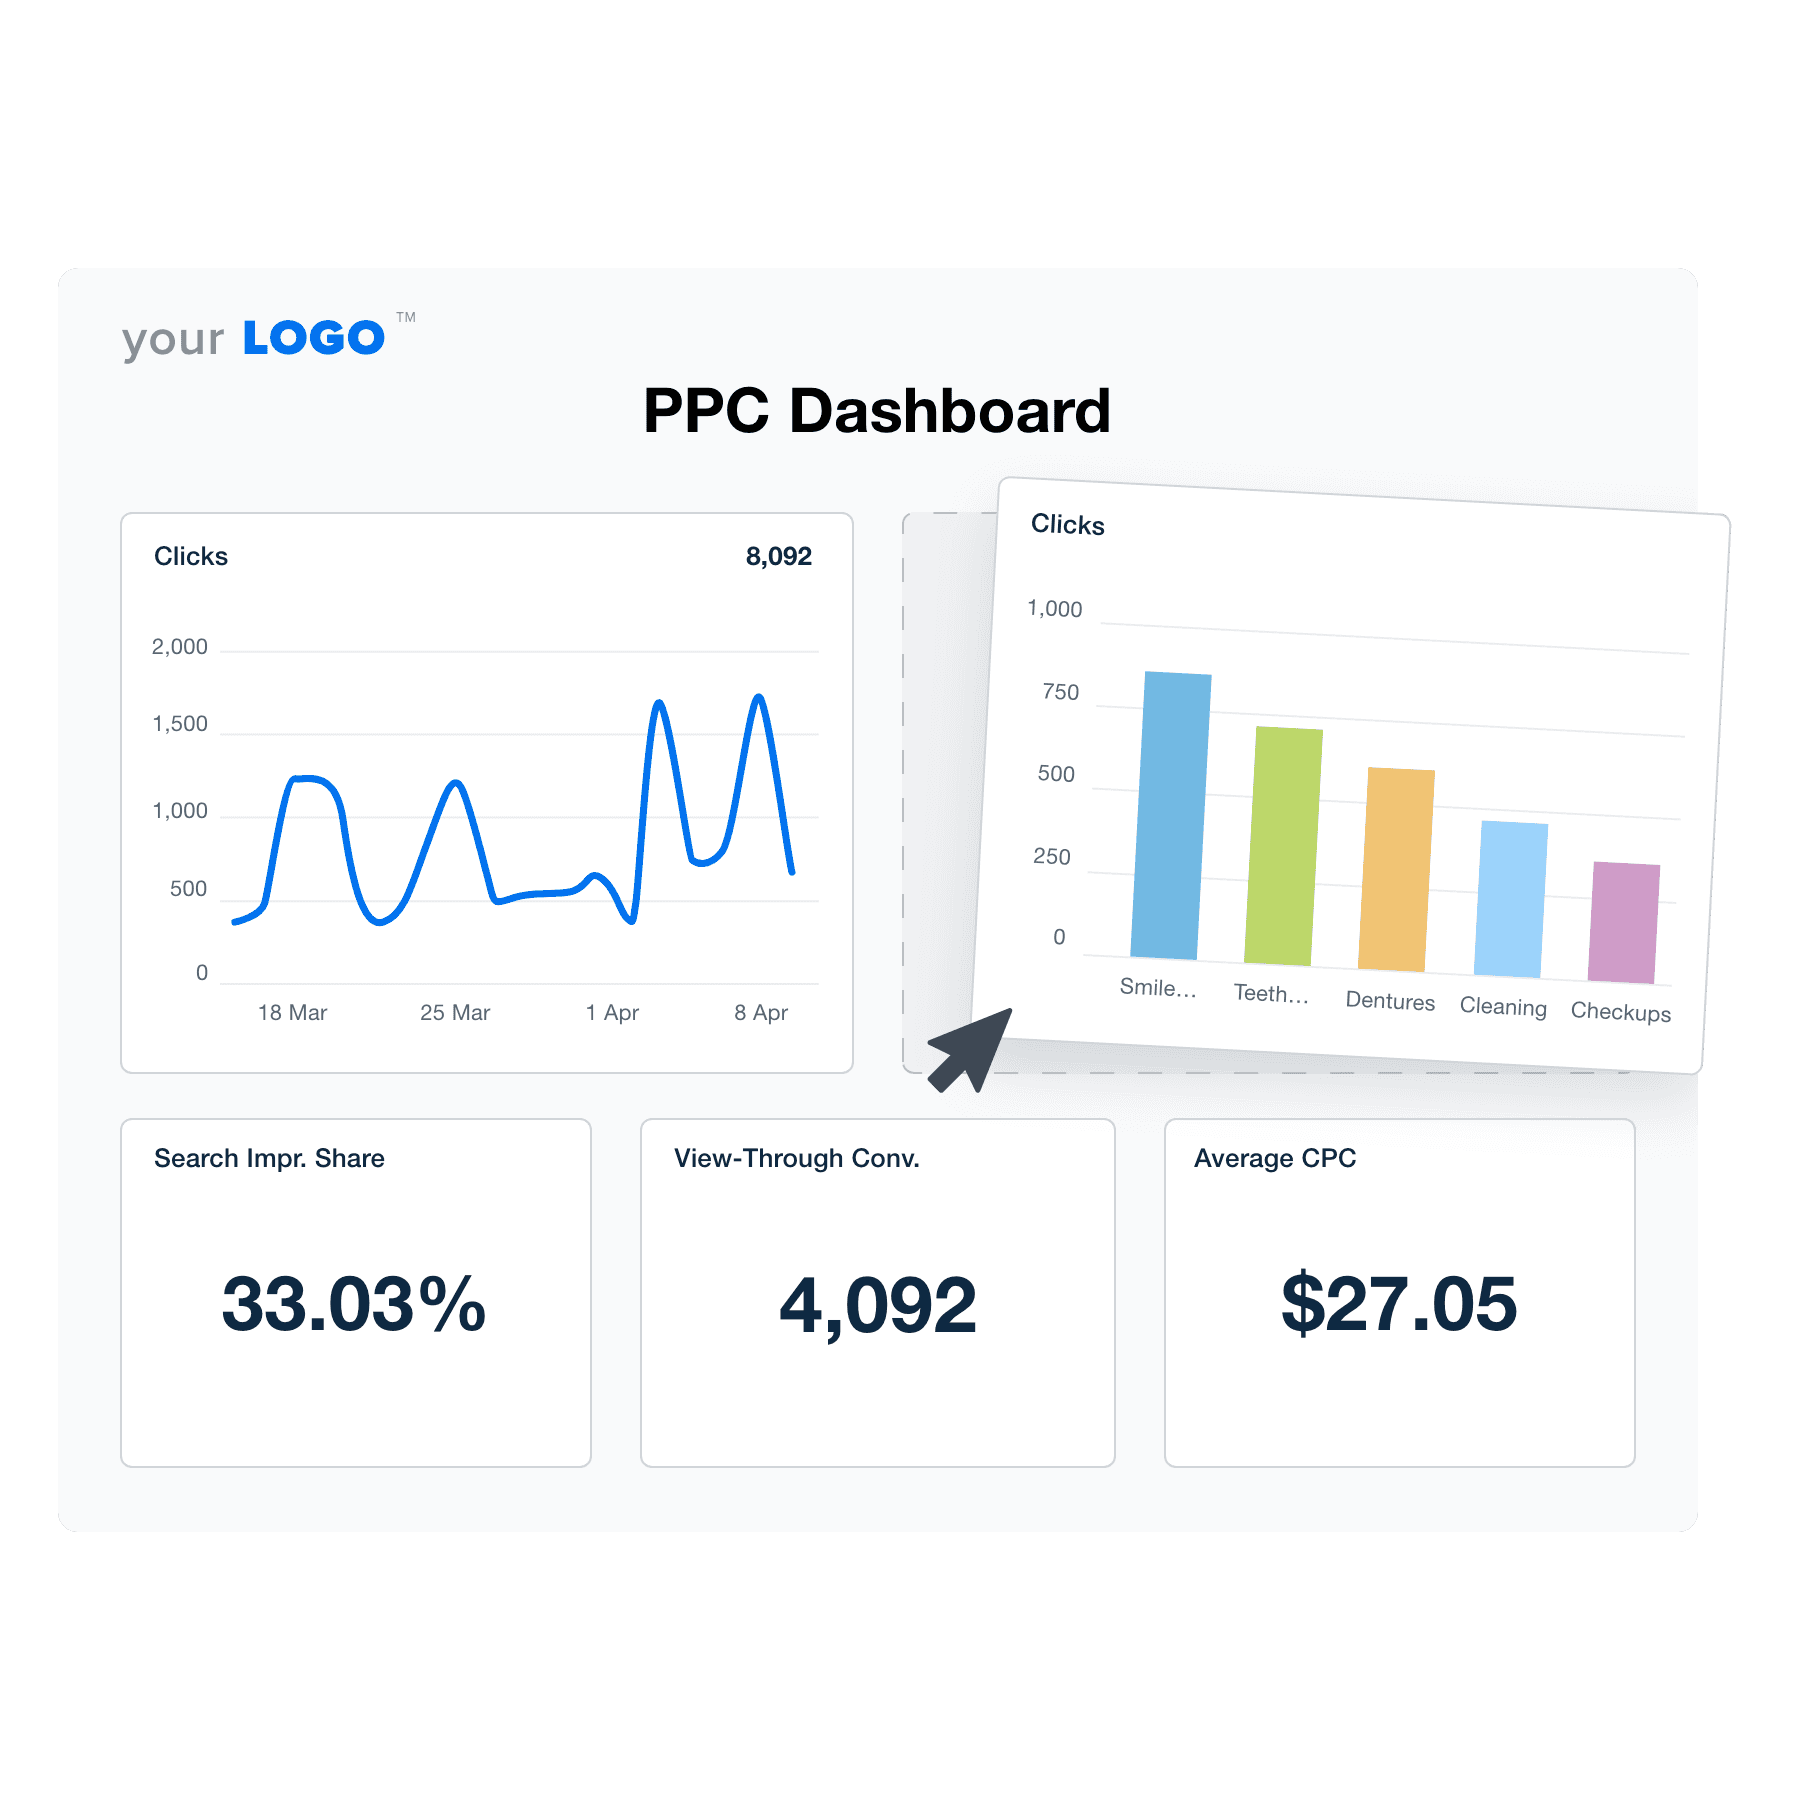
Streamline your client reporting with the only PPC dashboard built for marketing agencies. This all-in-one reporting tool consolidates real-time metrics from Google Ads, Bing Ads, Facebook Ads, and more. Track essential KPIs, showcase your agency’s performance, and improve client retention. Monitor PPC campaign results without the hassle of manual data collection.
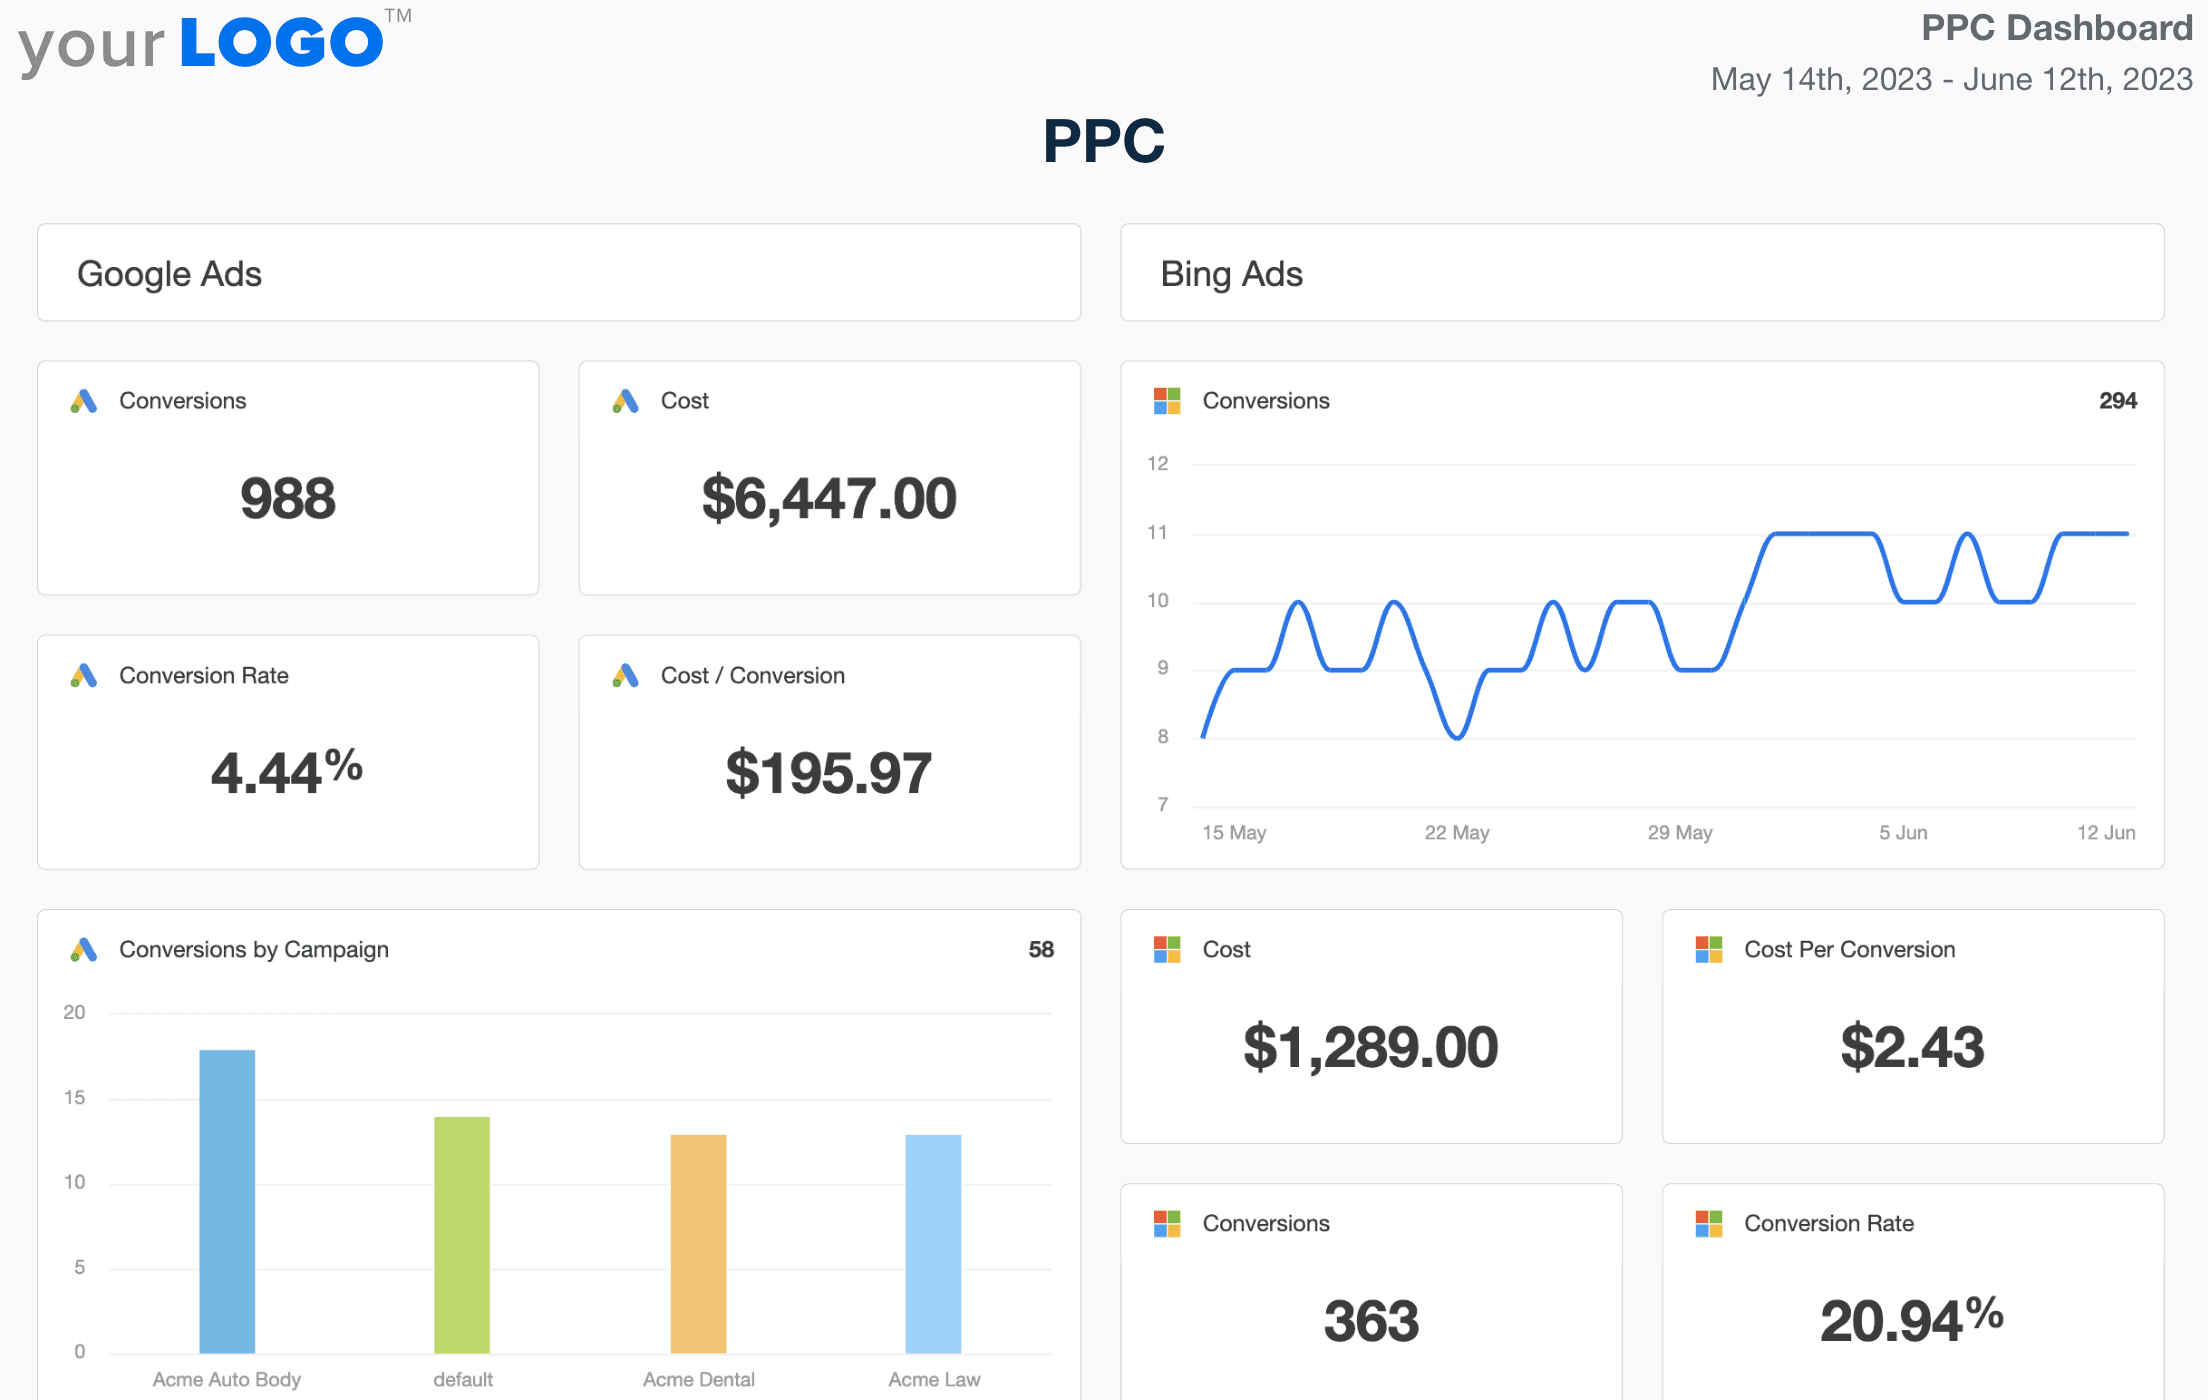
PPC Dashboard Template Example

What is a PPC Dashboard?

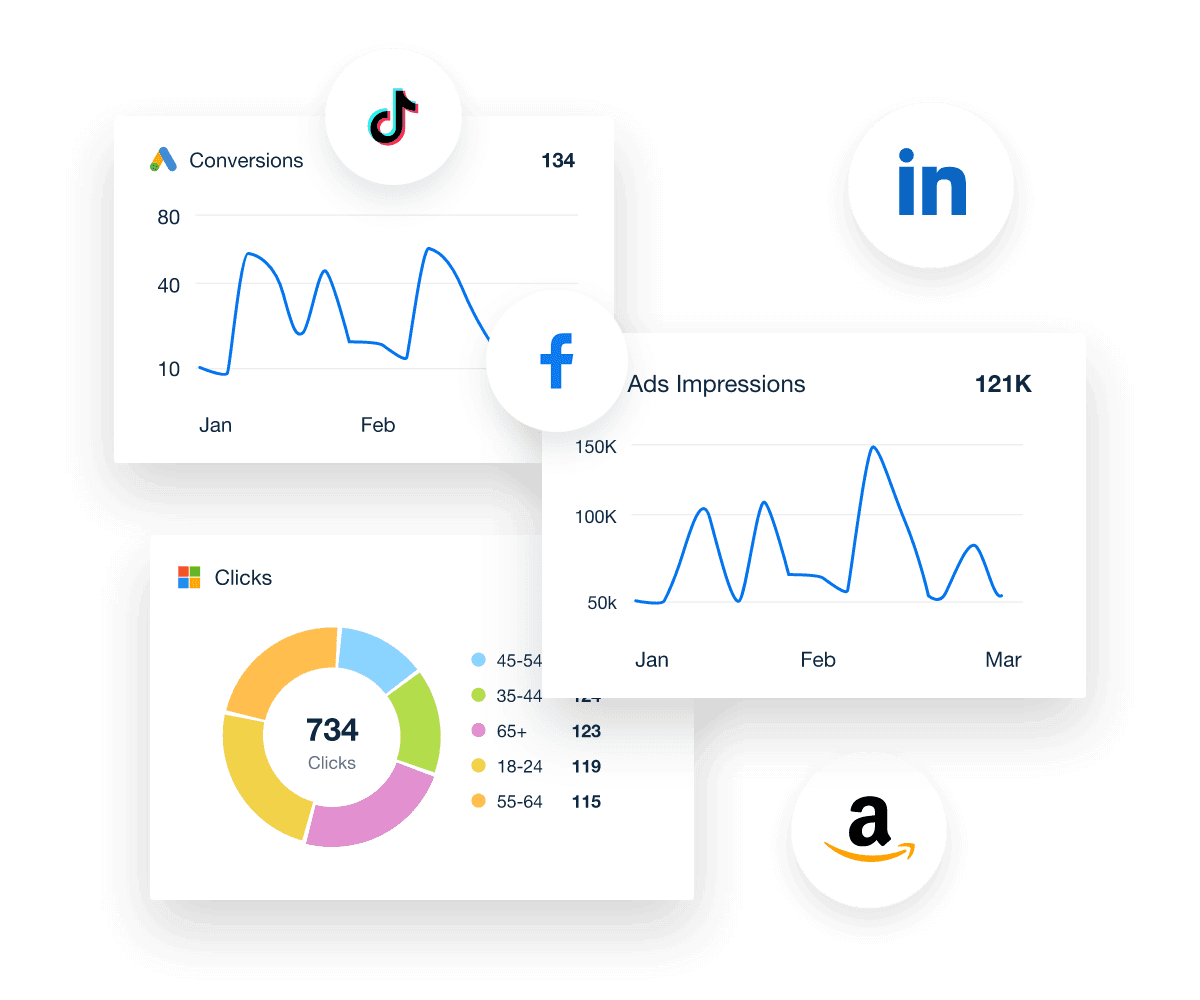
A PPC dashboard displays key metrics from your clients' pay-per-click campaigns in real-time. These metrics are automatically retrieved from multiple ad platforms, including Google Ads, Facebook Ads, Microsoft Ads, Instagram Ads, Spotify Ads, and more. That means no more manual data collection, screenshots, or clunky spreadsheets! Instead, you'll have a single interface that displays top PPC dashboard metrics, all in one place.

Create custom dashboards tailored to each client's PPC campaigns and provide a unique, comprehensive view of advertising performance. Even share granular insights according to ad groups and individual ad sets; it's all up to you.

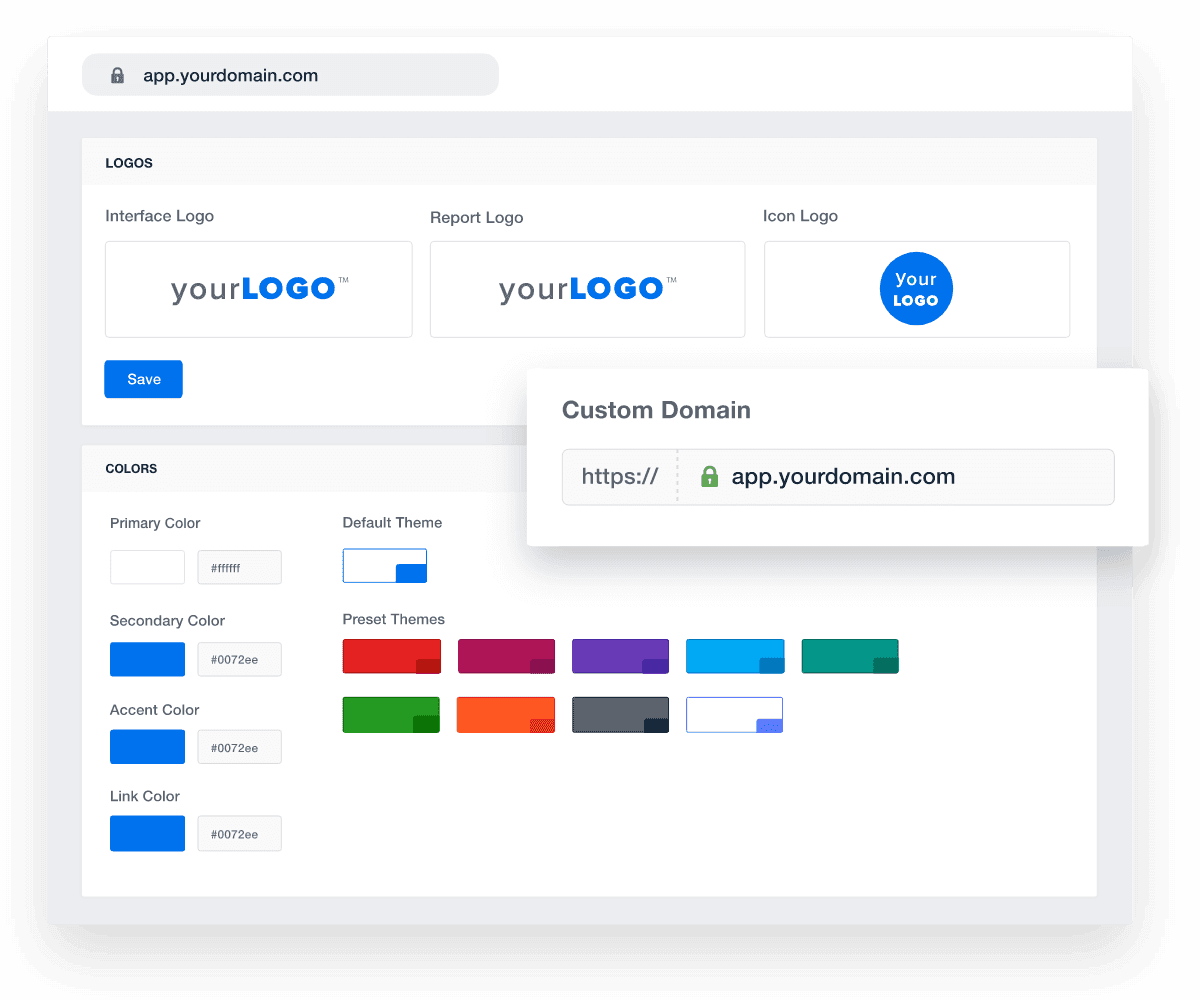
For extra personalization, add your brand colors and logo with the white label feature, which demonstrates professionalism and attention to detail. Impress clients with professional dashboards, streamline client onboarding, and make client reporting a breeze.

Why Your Agency Needs a PPC Dashboard

When running a large-scale PPC campaign, you've likely got multiple efforts across several advertising platforms. Because of this, it can be incredibly difficult to keep track of all the moving parts. To truly measure a campaign’s success, you definitely don’t want to miss insights that could contribute to the bigger picture.

Take your agency's success to new heights with a scalable PPC dashboard designed to complement your agency's growth. With costs, click-through rates, conversion rates, and other key PPC dashboard metrics at your fingertips, interpreting data has never been easier.

Spend less time creating client reports and more time optimizing PPC spend, budget distribution, and bidding strategies. Quickly view insights from your clients' advertising campaigns and even across multiple data sources (like Google Analytics, LinkedIn Ads and Facebook).

If your clients prefer a static format, simply convert this data into a white labeled client report in just a few clicks. Alternatively, use a pre-built PPC report template from the get-go.

Streamline Your Agency’s PPC Reporting
Start Your 14-Day Free Trial

8 Sections To Include in a PPC Dashboard

Ready to deliver PPC dashboards that provide the most value to your clients? Here are a few key sections to include. The best part? This clean format also reiterates your agency's expertise in managing PPC campaigns, which builds client confidence.
1. Cost

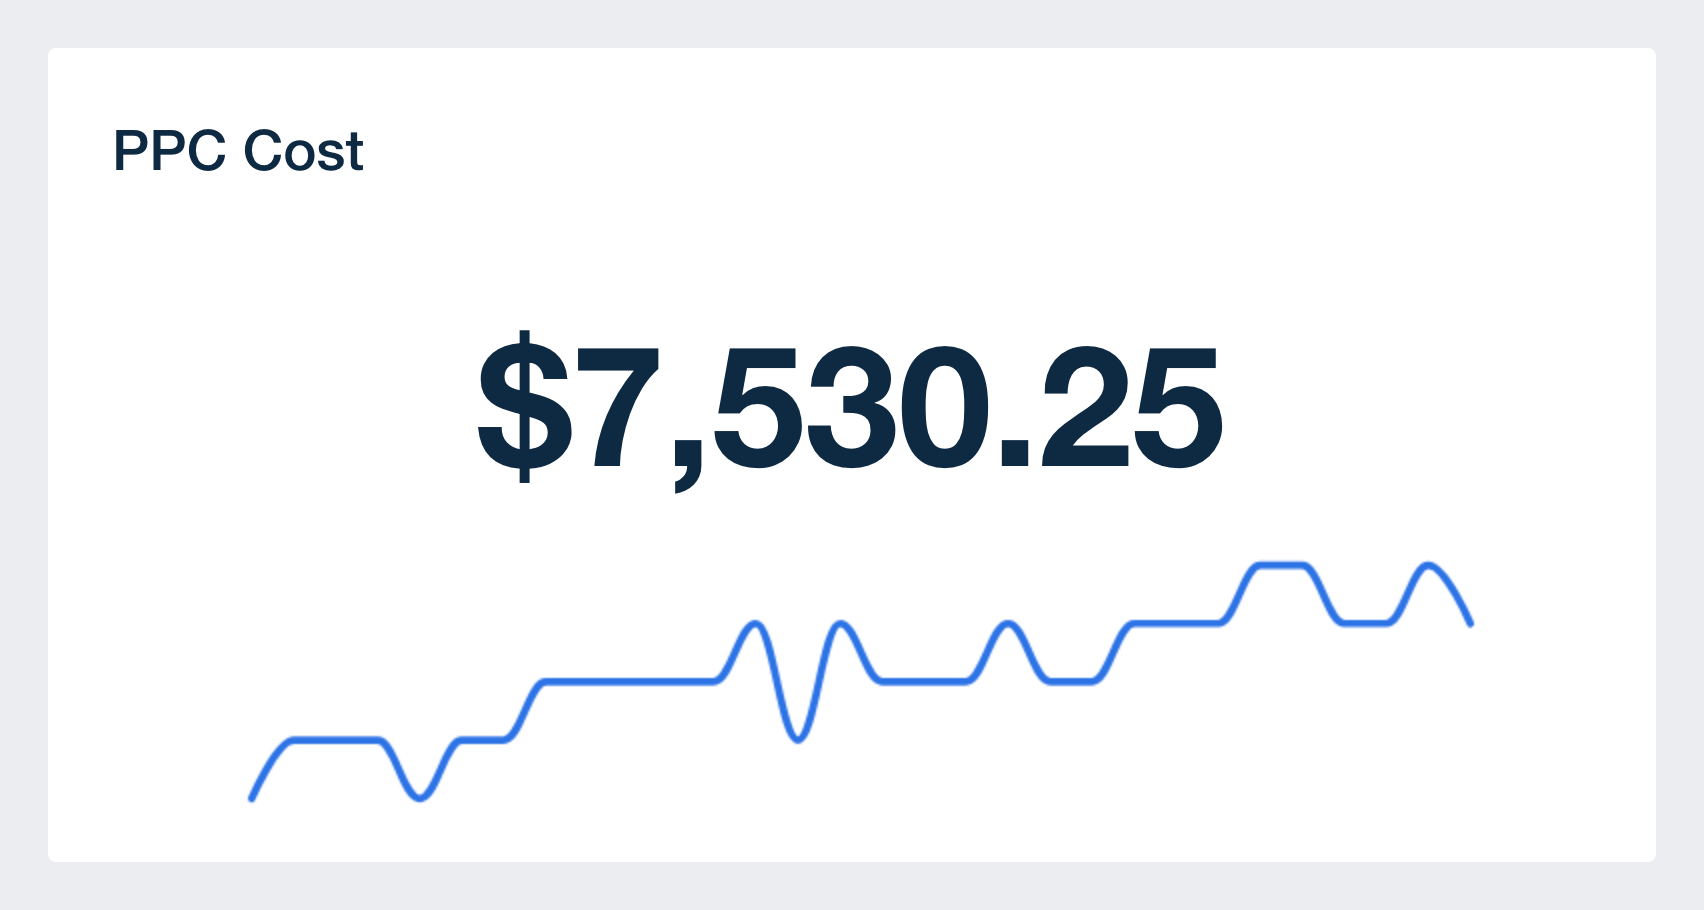
Display the cost of all of your client's PPC ad campaigns in a single place, which makes it easier to track your overall cost vs. budget. This keeps transparency on the table, ensuring they know exactly how much has been invested so far.

PPC cost metric in PPC Dashboard template

It’s important to remember that some platforms (like Google Ads) will sometimes spend marginally more than your client's daily budget to maximize the number of clicks. To ensure things go according to plan, monitor the total monthly amount on this PPC dashboard closely, especially for stricter budgets.

2. Conversions

Conversions are one of the most important numbers to include in a client's PPC dashboard. This metric is calculated by counting the number of times someone clicks on one of their ads and completes a call to action (e.g., purchasing a product or signing up for a newsletter).

PPC conversions metric in PPC Dashboard template

A high number of conversions shows that your client's PPC strategy is encouraging users to engage and take action. On the other hand, a low number may mean improvements are needed. For example, consider refining ad copy, adding more strategically placed CTAs, or trying a different bidding strategy.

3. Conversion Rate

Conversion rate is expressed as a percentage, showing the total number of conversions achieved relative to the number of clicks.

conversion rate metric in ppc dashboard template

By examining conversion rate alongside the number of conversions, your agency will better assess the effectiveness of campaign CTAs and the appeal of a client's offerings.

For example, say a client has a high number of conversions but a low conversion rate. It suggests that their ads have potential to perform better with optimization tweaks.

4. Cost Per Conversion

Cost per conversion shows how much is spent to win a new customer or achieve a desired outcome (e.g., an online sale). This metric shows whether your client's expenditure is yielding a significant enough ROI.

PPC cost per conversion metric in PPC Dashboard template

A low cost per conversion generally means that your client's campaign is cost-efficient. Essentially, they're spending less to acquire each conversion, which is a positive sign.

However, if conversions are low despite a low cost, it might indicate low-quality leads or a budget that isn't competitive enough. To fix this, refine your client's targeting strategy, ensuring they're spending enough to acquire conversion-oriented customers.

Automated Client Reports. Ready in 30 Minutes or Less.
Spend Less Time Creating Reports and More Time Delivering Results
Start Your 14-Day Free Trial

5. Impressions

Impressions measure how many users view your client's ad. While this metric doesn't include clicks or conversions, it shows whether PPC campaigns are receiving enough visibility and reach.

PPC impressions metric in PPC Dashboard template

A high number of impressions means your client's ad is frequently displayed, which increases the chances of brand recognition. However, if impressions are high but engagement is low, it could signal a disconnect between ad content and what resonates with the audience.

6. Clicks

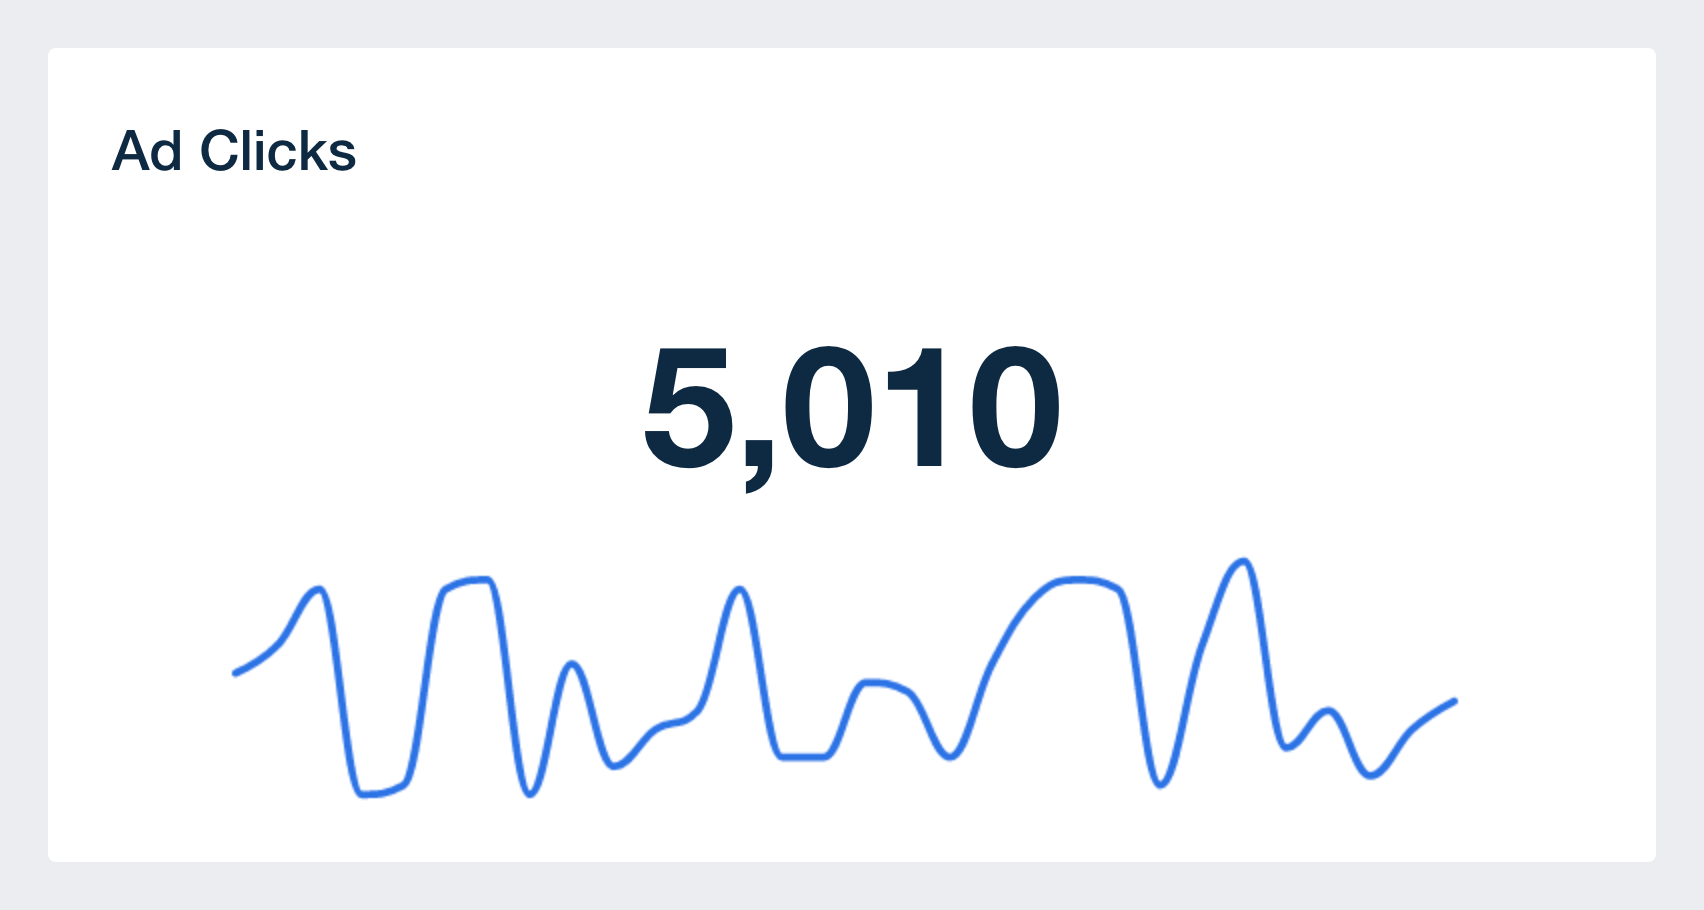
Clicks show how many users interact with your client's ads by clicking on them, which indicates some level of heightened interest.

PPC clicks metric in PPC Dashboard template

A high number of clicks may be be a good indicator of campaign success, especially if this is your client's end goal. If these clicks aren't leading to the desired concrete actions (e.g., form submissions), determine if there are any roadblocks in the conversion funnel. For example, this may include a lengthy checkout process or a sign-up form with too many fields.

7. Click-Through Rate (CTR)

Click-through rate (CTR) measures the percentage of users that click on your client's ad, compared to the total number of impressions. This metric shows whether ad campaigns are effective in getting users to act, beyond passive viewing.

PPC CTR metric in PPC Dashboard template

A high CTR means your client's ad is compelling and relevant to the target audience. On the other hand, a low CTR may signal that a few tweaks are needed (e.g., adjusting keywords or using a different creative).

8. View-Through Conversions

View-through conversions (VTC) occur when a user sees your client's ad but doesn’t click on it. Instead, they return to the site within 30 days and complete a conversion.

Though it's a relatively a newer KPI in PPC advertising, it’s a valuable metric to monitor (especially for display ads), as it measures the indirect impact of ad impressions on conversions.

PPC view-through conversions metric in PPC Dashboard template

Since display ads often have a minimal CTR, it can be incredibly difficult to determine how effective they are. VTCs show a more accurate performance overview, which shows that your agency's strategy is effective.

9. Goal Tracking

To demonstrate whether your client's targets are on the right track, use the goal tracking feature. This is a dynamic way to show real-time progress, visualize performance, and maintain data transparency. Plus, it equips your agency to make any PPC campaign optimizations if needed (e.g., adjusting ad spend to achieve more conversions).

Create, monitor, and display clear goals to prove the value your agency delivers to its clients.

Here are some best practices for setting goals in PPC campaigns:

  • Create Relevant Goals: Align PPC campaign goals with your client’s overall marketing strategy. This may include increasing conversions, driving qualified leads, or improving ROAS.

  • Remain Adaptable: Regularly review and adjust PPC goals based on KPIs like click-through rates (CTR), cost per conversion, or overall cost.

  • Use Clear Performance Metrics: Set measurable, quantifiable targets like a specific number of leads or conversions.

See the PPC Dashboard Template in Action
Use This Template To Create Custom Dashboards in Minutes
View Template Demo

Seamlessly Integrate Data from Top PPC Platforms

This PPC dashboard integrates with leading marketing platforms, giving your agency real-time tracking and reporting capabilities.

No more cutting and pasting screenshots into a spreadsheet. Provide a comprehensive view of overall campaign performance by consolidating all your clients' PPC data into one convenient dashboard.

Make informed decisions, identify trends, and optimize strategies for maximum impact. For best results:

  • Start with a pre-built PPC dashboard template to save time from creating one from scratch.

  • Utilize an intuitive drag-and-drop dashboard builder to customize the dashboard, move widgets around, and meet your clients' exact needs.

  • Highlight specific KPIs, rearrange data visualizations, or add other unique elements (like annotations for more context).

  • Create custom metrics that reflect your client's specific PPC goals and business objectives (e.g., overall return on ad spend for all PPC campaigns).

Custom metrics drag-and-drop dashboard example

Need a way to speed up your reporting process even more? Try the 11-second Smart Dashboard feature! In the blink of an eye, watch your client's unique PPC metrics populate into a sleek, professional dashboard.

Make the most of your billable time, enhance the reporting process, and streamline internal operations. It's a must-have for sustainable agency growth.

If you’re looking for an all-in-one reporting tool for your agency that manages various marketing tactics and channels, AgencyAnalytics has to be your go-to reporting solution. Create stunning automated reports and dashboards in just a few minutes.

Michael Wisby
Michael Wisby / CEO
Two Trees PPC
Track and Analyze Your Client’s Paid Advertising Metrics in a Dedicated Dashboard
Start Your 14-Day Free Trial

Professional PPC Dashboards as Unique as Your Agency

All Your Online Advertising Data in One Place

Integrate Data From All Your Clients’ Paid Channels

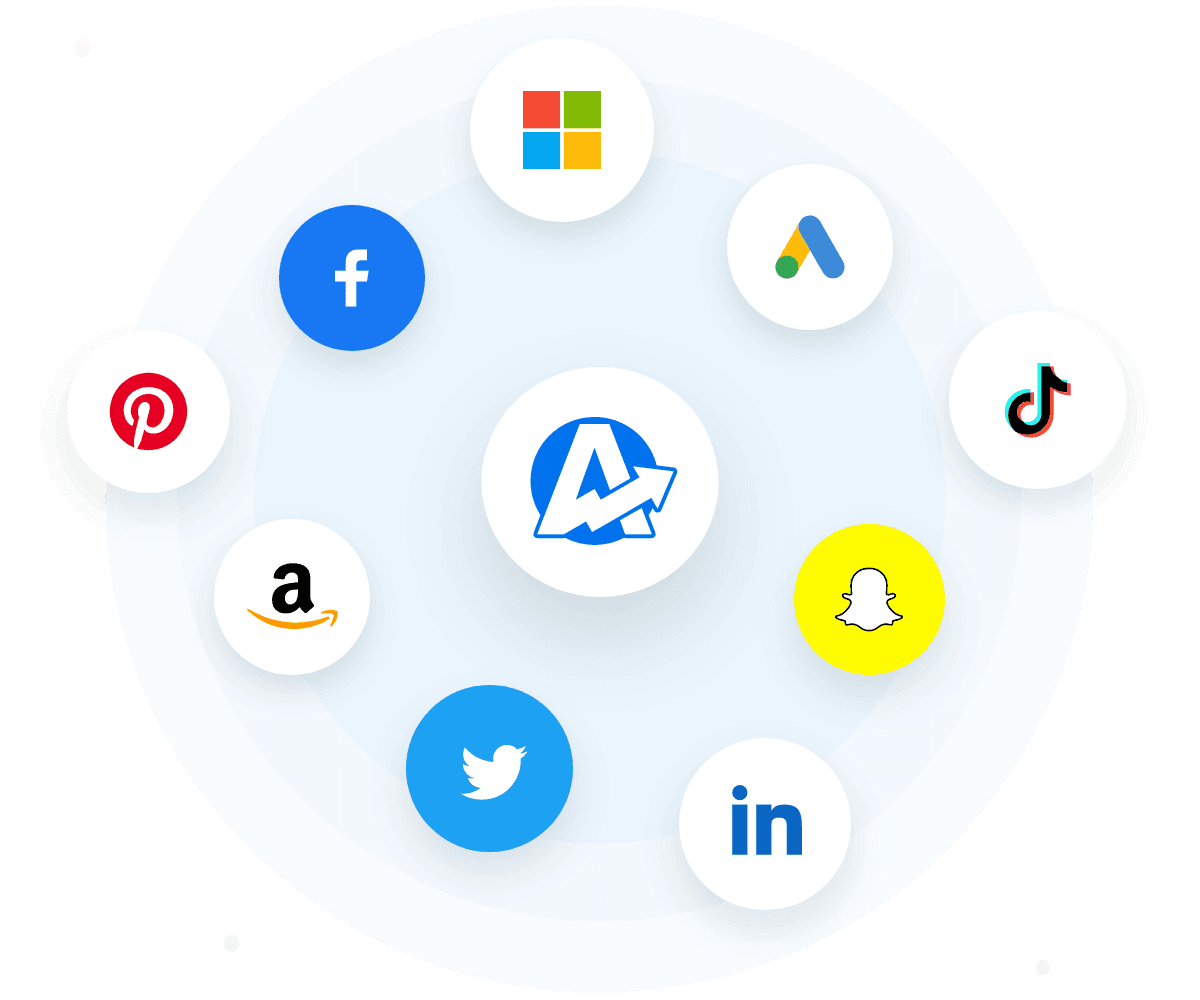
Integrate insights from your clients' PPC marketing channels, including Facebook advertising campaigns, Google Ads, AdRoll, and more. Even infuse data points across 80+ platforms to grasp overall performance! Start saving time and impress clients with beautiful, customized reporting.

House your client's digital marketing metrics in a central, convenient hub. Cut down report preparation time, track real-time PPC insights, and optimize data-tracking with one platform.

ppc integrations
Unlimited Number of Users

Grant Clients Access To Their Data

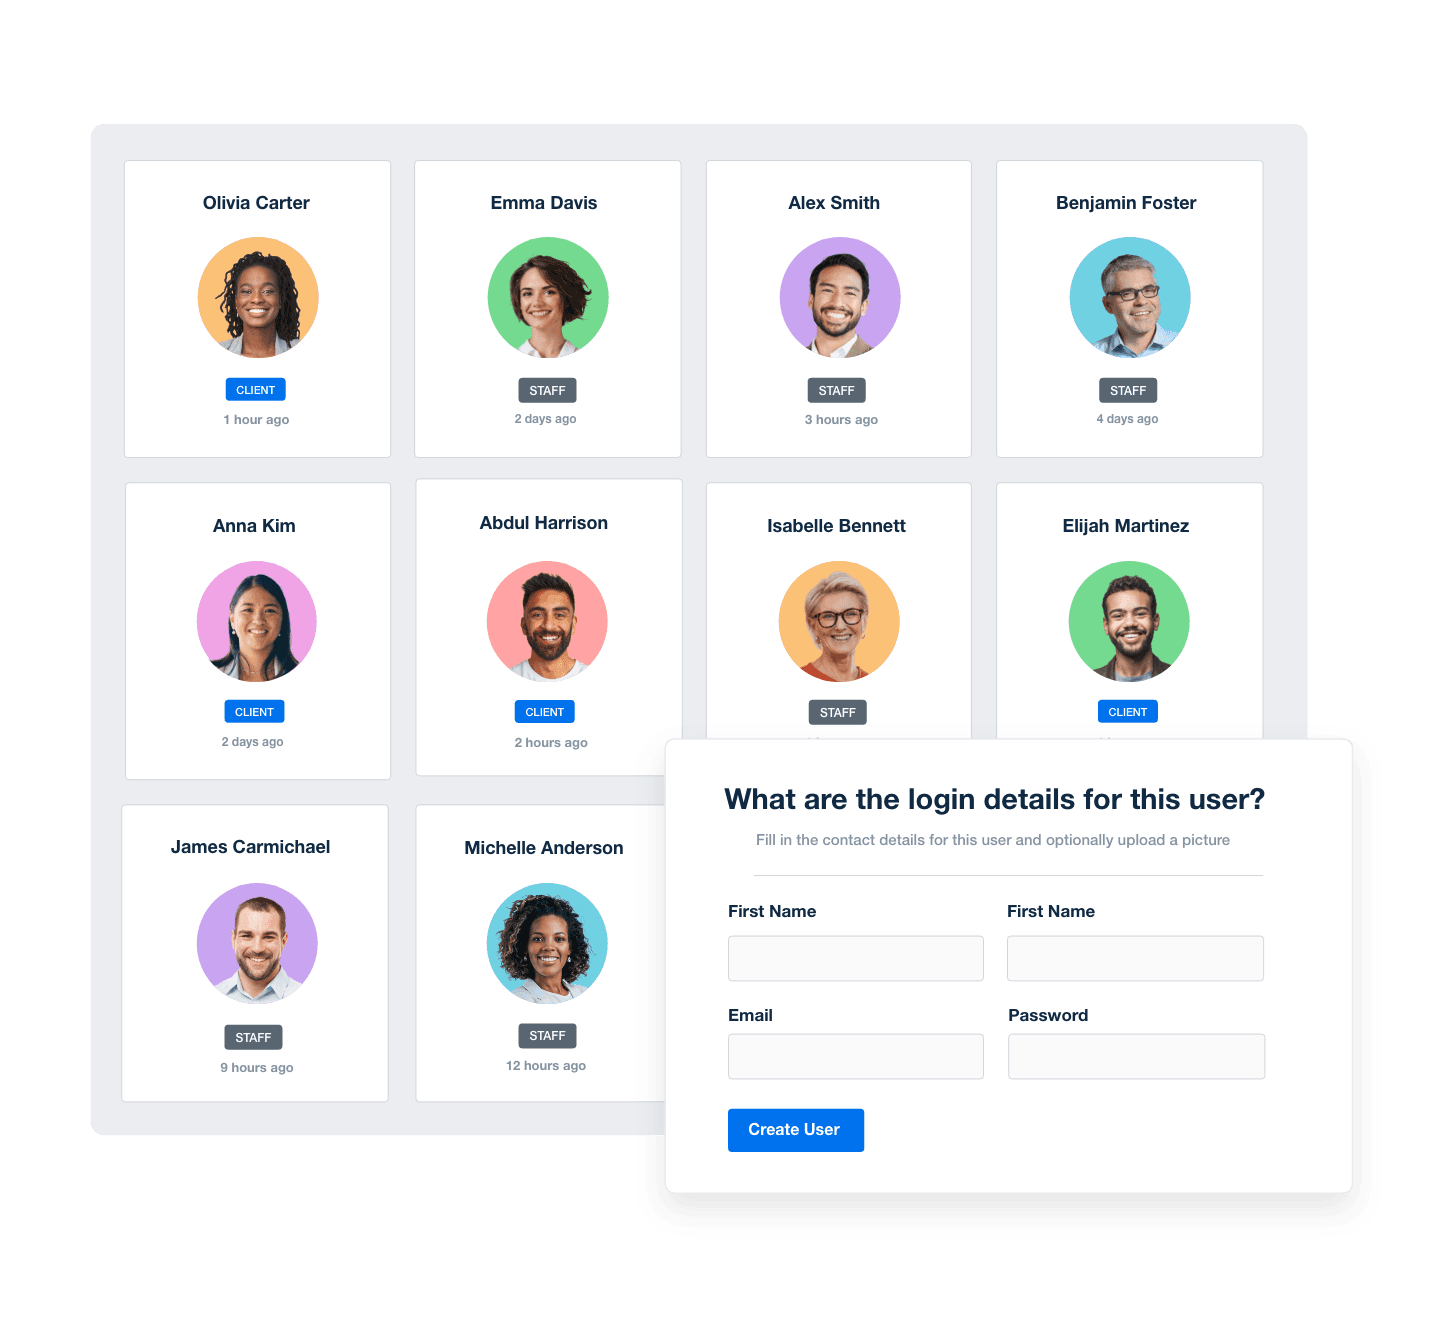
Transparency breeds trust. Granting live dashboard access allows your agency to share PPC performance with clients, showing that you've got nothing to hide. Reduce follow-up times and give clients the autonomy to track performance whenever they choose.

Worried about sharing too much data (like vanity metrics)? Simply set user permissions beforehand. That way, clients will only see relevant insights that are straightforward, relevant, and actionable. You've also got the option to schedule automated, static PPC reports!

Manage your entire agency with staff and client logins
Impressions, CTR, Clicks and More

Share Actionable PPC Analytics

Clients need data to make sound decisions. Customize dashboards to provide an in-depth breakdown or a high-level overview, whatever works for your client. Showcase impressions, cost, conversions, clicks–all in a visual, easy-to-understand format.

Need to shift things around? No worries. Drag-and-drop widgets, add custom comments and even replicate sections from existing dashboards. Take reporting to the next level with a tool that's built for your agency's needs.

ppc analytics in ppc dashboard template
ADD ANNOTATIONS AND GOALS

Align PPC Metrics With Your Client’s Goals

Don't just show the numbers–tell a story with your client's data. With the goals feature, create custom targets that show the real-time progress of PPC campaigns. Whether it's achieving quarterly conversions or weekly form sign-ups, present actionable insights that clients will value.

To explain complex metrics, directly add annotations to data visualizations. Contextualize upticks, sudden drops, or emerging trends. That way, clients will have a crystal-clear understanding of what their marketing results mean.

A screenshot of annotations applied to a chart
Include Your Margin in All PPC Dashboards

Add a Custom Markup to PPC Spend

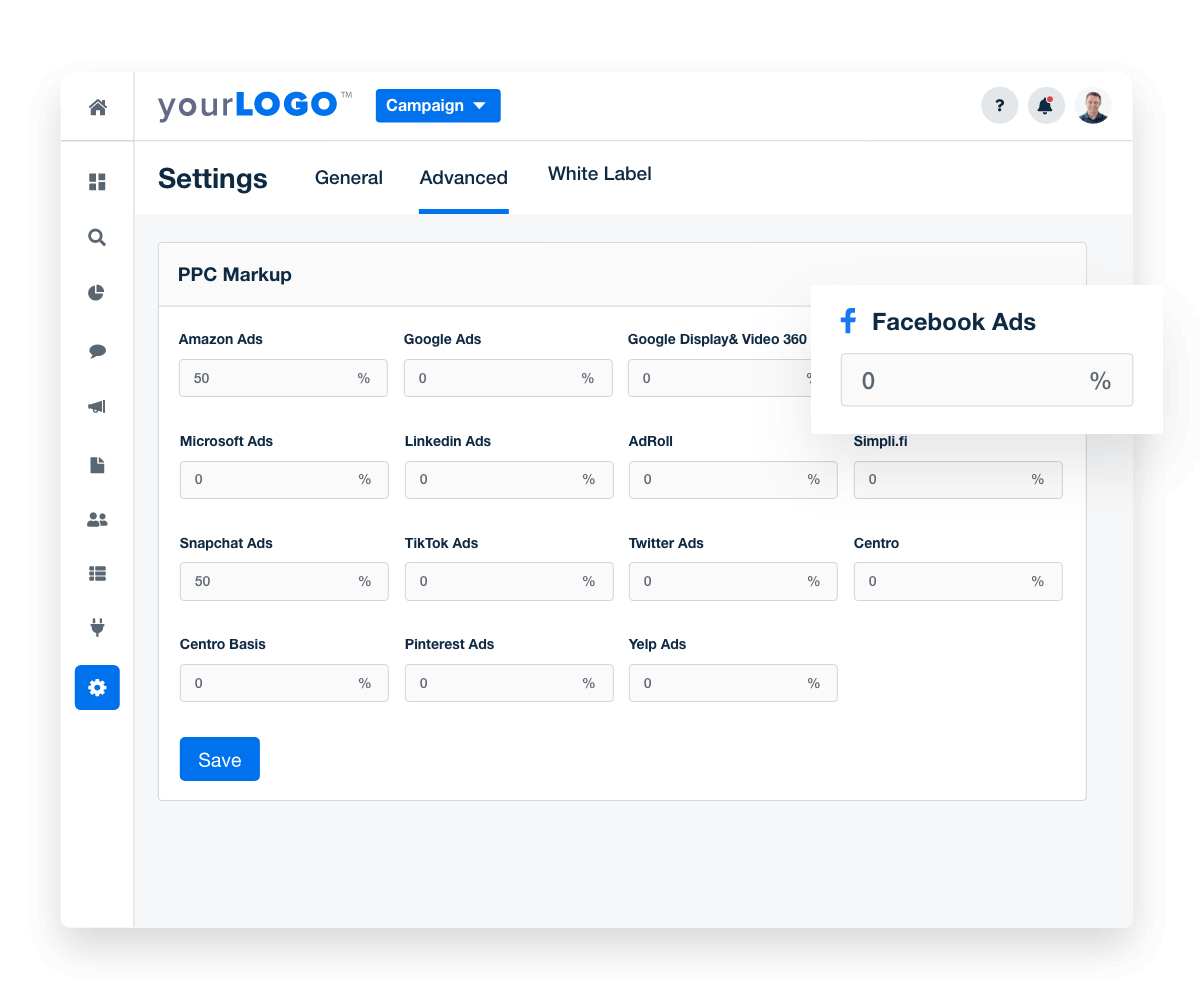
Most clients simply want to know your agency's upfront cost. To make things easier, automatically add your markup to PPC ad spend. That way, clients aren't left with multiple invoices or confusion about pricing. Instead, they'll see a single cost that lets them know exactly how much they have to pay.

Integrate pricing directly into your agency's reporting structure. Maintain transparency and keep clients in the loop with ease.

custom ppc markup in ppc dashboard
GET A BIRD'S EYE VIEW

Use an Account-Level Agency Dashboard

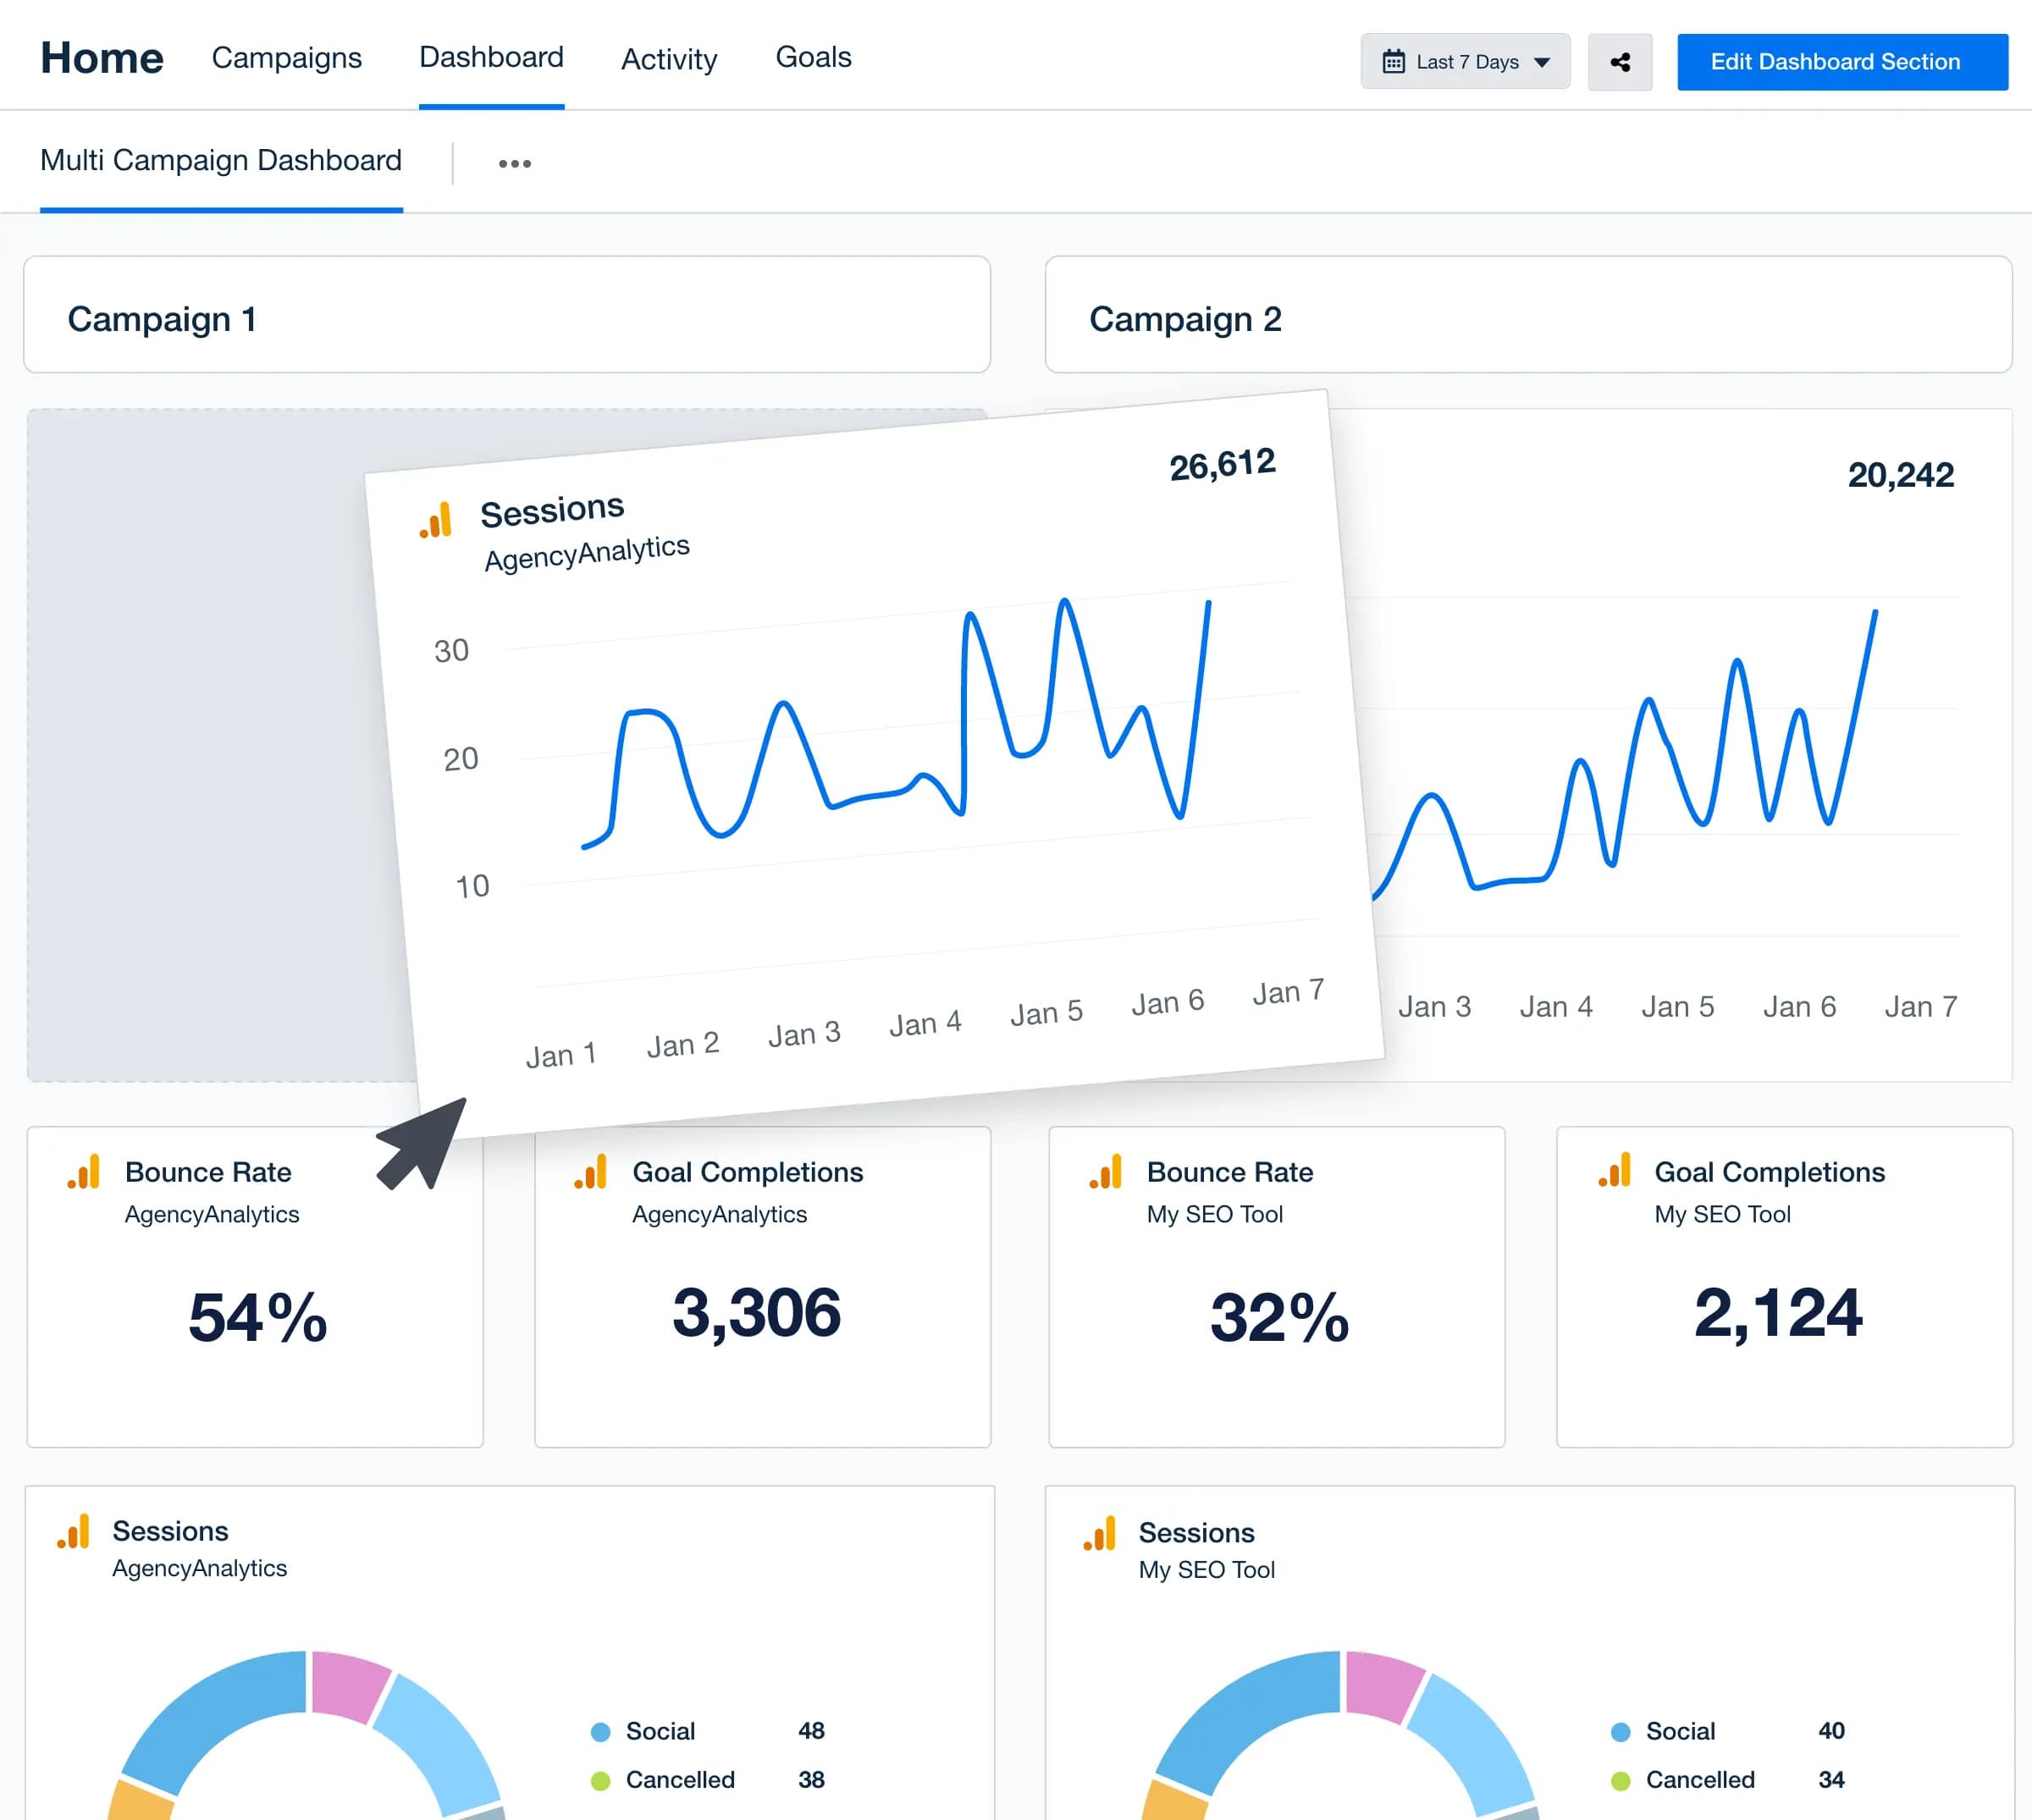
With so many campaigns in conjunction, your agency needs a system to track the moving parts. With an account-level dashboard, consolidate insights from multiple client metrics into a single interface. Get a comprehensive overview without breaking a sweat!

Ensure that all critical KPIs are in direct view. Quickly identify ad campaign hiccups, monitor trends, and compare performance across client accounts. Optimize your data-tracking process and ensure nothing slips through the cracks.

Drag-and-Drop Agency-Level Account Dashboard Builder
100% White Labeled PPC Dashboards

Feature Your Logo & Branding

Presentation goes a long way. Use the white label feature to add your agency's logo, brand colors, and even a custom cover page. That way, all your dashboards and reports look like they were created in-house. That extra bit of customization makes a difference!

Deliver reporting that makes a favorable impression. Share actionable insights, demonstrate attention to detail, and show that your agency means business.

white labelled google sheets reports and dashboards
SAY BYE-BYE TO LAST-MINUTE CLIENT REPORTING

Automate Report Scheduling & Approval

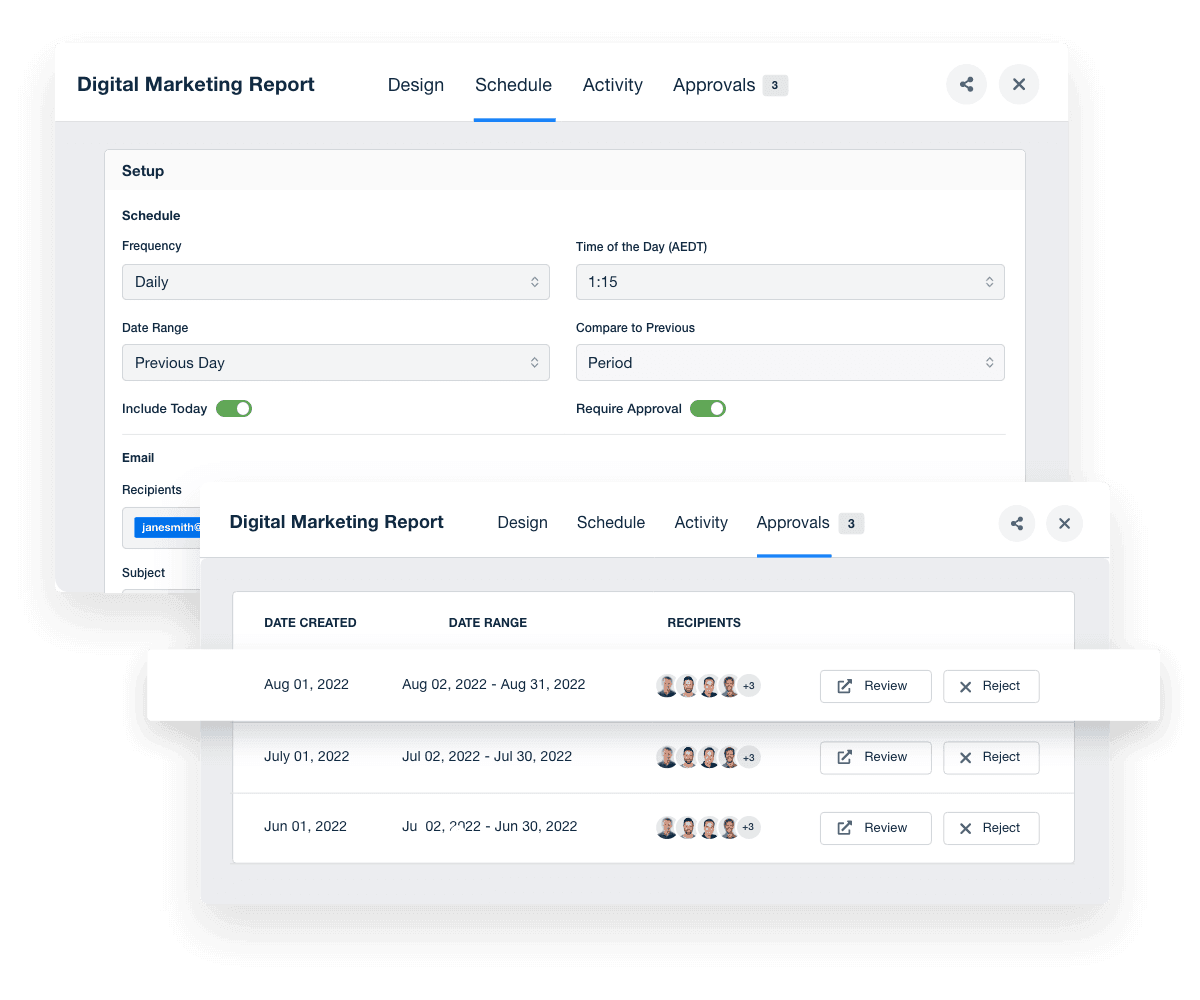
Use the scheduling feature to put things on autopilot and deliver insights just on time. On select plans, get notified before each report is sent out. That way, you'll have a heads-up to do a final approval and add expert commentary.

Choose the exact day and time to share reports. That way, clients know when to expect them, which creates consistency. Whether it's a weekly update or a monthly deep dive, you’ll be in control of how and when key information is communicated.

An example of the AgencyAnalytics report scheduling feature for automated marketing reports
WE'RE HERE TO HELP

Customer Support is Our Top Priority

Your agency's success is our main focus. Our dedicated support team is here to assist you 24/5 through live chat, with an average response time of under 3 minutes.

With a satisfaction rate of over 95%, we’re committed to helping your agency achieve exceptional results every time. You care about your clients' success. We care about yours.

Best in Class Customer Support

By consolidating all of our tools into dashboards, we have saved so much time and money—it’s truly been invaluable. As an agency owner, I don’t know of a better platform than AgencyAnalytics.

Jason Hylan
Jason Hylan
Clix

Get Started for Free

Try AgencyAnalytics risk-free for 14 days. No credit card required.
AgencyAnalytics Dashboard Preview