Matomo Reporting

Bring Matomo data into focus
Transform complex Matomo website analytics into clear, client-friendly reports that reveal what's working and where to improve.
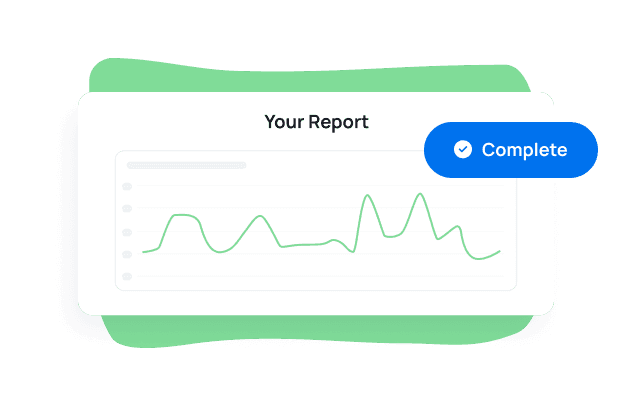
Visualize Data
Simplify complex web analytics into beautiful, easy-to-understand charts and graphs
Segment Channels
Monitor Matomo metrics by channel and understand what’s driving performance
Know Your Audience
Analyze visitors, users, conversions, and revenue by country and browser
Track Goals
Create impactful dashboards and reports that highlight client goals and results
Intuitive Matomo Analytics
Easily track and demonstrate the impact of your agency's ongoing digital strategies with the AgencyAnalytics Matomo dashboard. Matomo is a Google Analytics alternative that prioritizes data protection and user privacy.
Transform complex Matomo web analytics and KPIs into easy-to-understand charts and graphs that display performance. Monitor your clients’ Matomo metrics like visitors, behavior, acquisition, and goals alongside key data from all their other important marketing tools.

Explore All Available Matomo Metrics
- Actions
- Average Actions
- Average Time
- Bounce Rate
- Bounces
- Conversion Rate
- Conversions
- Converted Visits
- Date
- Event Average
- Event Max
- Event Min
- Event Sum
- Events
- Events With Value
- Goal Revenue
- Max Actions
- New Visit Conversion Rate
- New Visit Conversions
- New Visit Converted Visits
- New Visit Revenue
- Returning Visit Conversion Rate
- Returning Visit Conversions
- Returning Visit Converted Visits
- Returning Visit Revenue
- Total Time
- Unique Visitors
- Users
- Visits

MASTER YOUR METRICS
Drive Decisions With Matomo Visitor and Acquisition Data
Analyze Matomo visitor and acquisition data by channel for clear understanding of what’s driving results. Use detailed visitor data to tailor your content and offers, increasing engagement and loyalty. Optimize your campaigns with real-time insights into customer behavior and conversion trends.

BOOST YOUR CLIENT’S WEBSITE PERFORMANCE
Page & Event Level Performance Data
Review pages by Matomo performance metrics like entry visits, hits, and time spent. Examine high-performing web pages and identify underperforming ones for potential optimization and content revision. Then, add context to the time visitors are spending on your client’s website. Track events over time and top events by visits, as well showcasing events with value.

ELEVATE CLIENT SATISFACTION
Highlight ROI With AgencyAnalytics' Matomo Dashboard
Leverage the AgencyAnalytics Matomo dashboard for a transparent view of your clients’ digital performance. Monitor critical metrics such as traffic sources, user behavior, and conversion rates in a compelling format. Tailor data presentations to match each client's specific goals, highlighting the effectiveness of campaigns and offering concrete proof of agency ROI. Clearly demonstrate your agency’s significant impact on client success and reinforce your role as an indispensable partner in achieving business growth.

Discover the white label reporting tool trusted by 7,000+ marketing agencies.


FAQs About Matomo Reporting for Marketing Agencies
Digging into web analytics shouldn’t feel like a deep dive into code. These FAQs show how to surface audience behavior, visualize web performance, brand reports, automate them, and manage insights across multiple sites.
Top-performing agencies focus on user behavior and site health: Visits, Unique Visitors, Bounce Rate, Average Time on Page, Conversion Rate, and Goal Completions. Monitoring entry/exit pages and event tracking reveals where UX and conversion paths shine—or need optimization. These core web analytics help justify both SEO and CRO strategies.
Creating a custom Matomo report is easy with AgencyAnalytics. Start with the Matomo dashboard template or build from scratch using drag-and-drop widgets. Mix in Visits, Bounce Rate trends, Page Views, Events, and Goal conversions. Add annotations or use AI reporting tools to spotlight anomalies or successes. Enhance the narrative by combining Matomo insights with ad performance or backlink data to tell a full-funnel story.
Absolutely. AgencyAnalytics turns Matomo reporting into a no-touch experience through scheduled report distribution—daily, weekly, or monthly. Reports update automatically, eliminating manual exports and ensuring timely delivery of website performance insights.
Brand consistency matters. Agencies integrate logos, brand colors, custom layouts, and domains into both dashboards and scheduled reports. Whether clients view a live Matomo dashboard or receive it in inboxes, everything reflects your agency's brand. Use white label client reporting to reinforce credibility at every touchpoint.
Busy agencies build individual Matomo report templates for each domain and layer in roll-up views to assess aggregate site performance. This dual setup delivers detailed site-level data and portfolio-wide trends—without siloed workflows.
More integrations
Everything your agency needs
Automated Reports

White Label Dashboard
Client & Staff Access

Connect Your Data
AI Powered
