Matomo Dashboard for Website Analytics and Client Reporting
Custom Matomo Dashboards as Unique as Your Agency
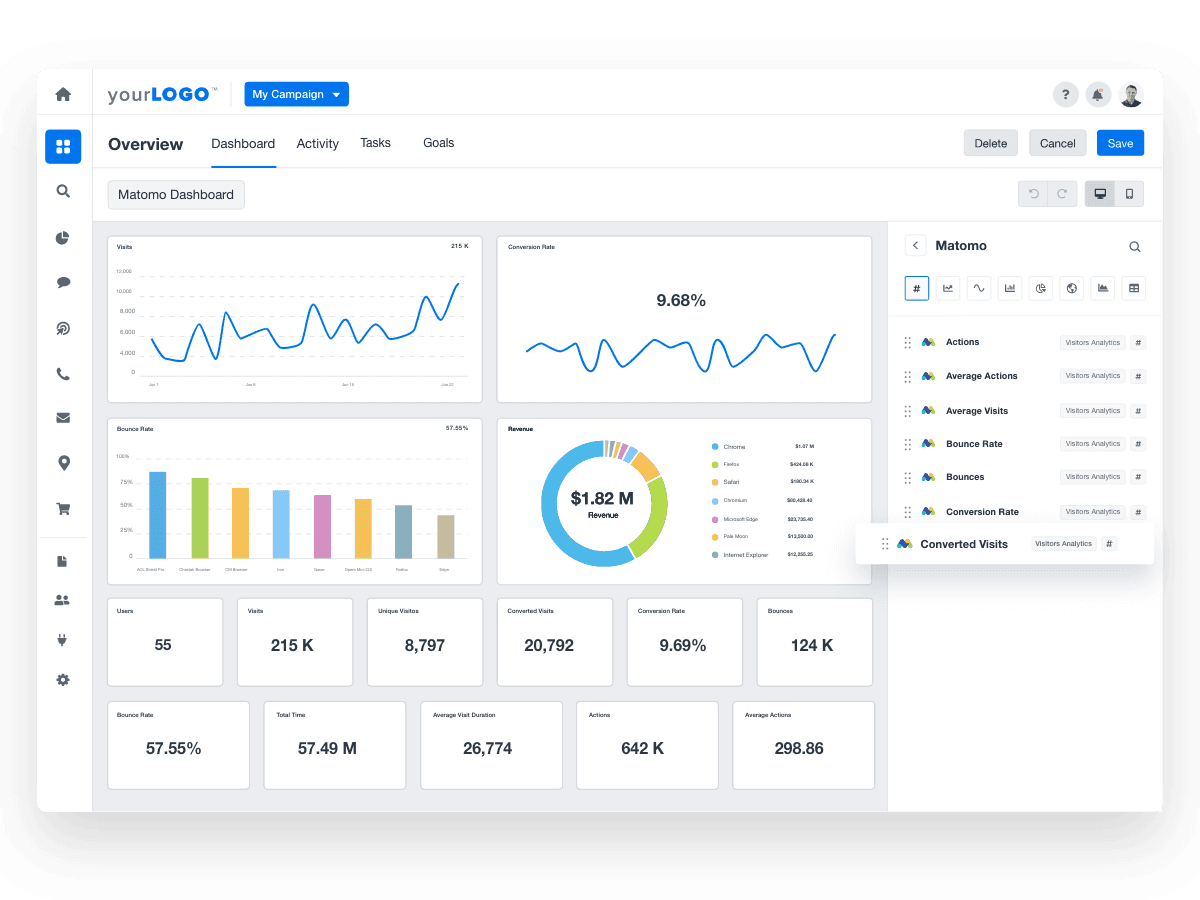
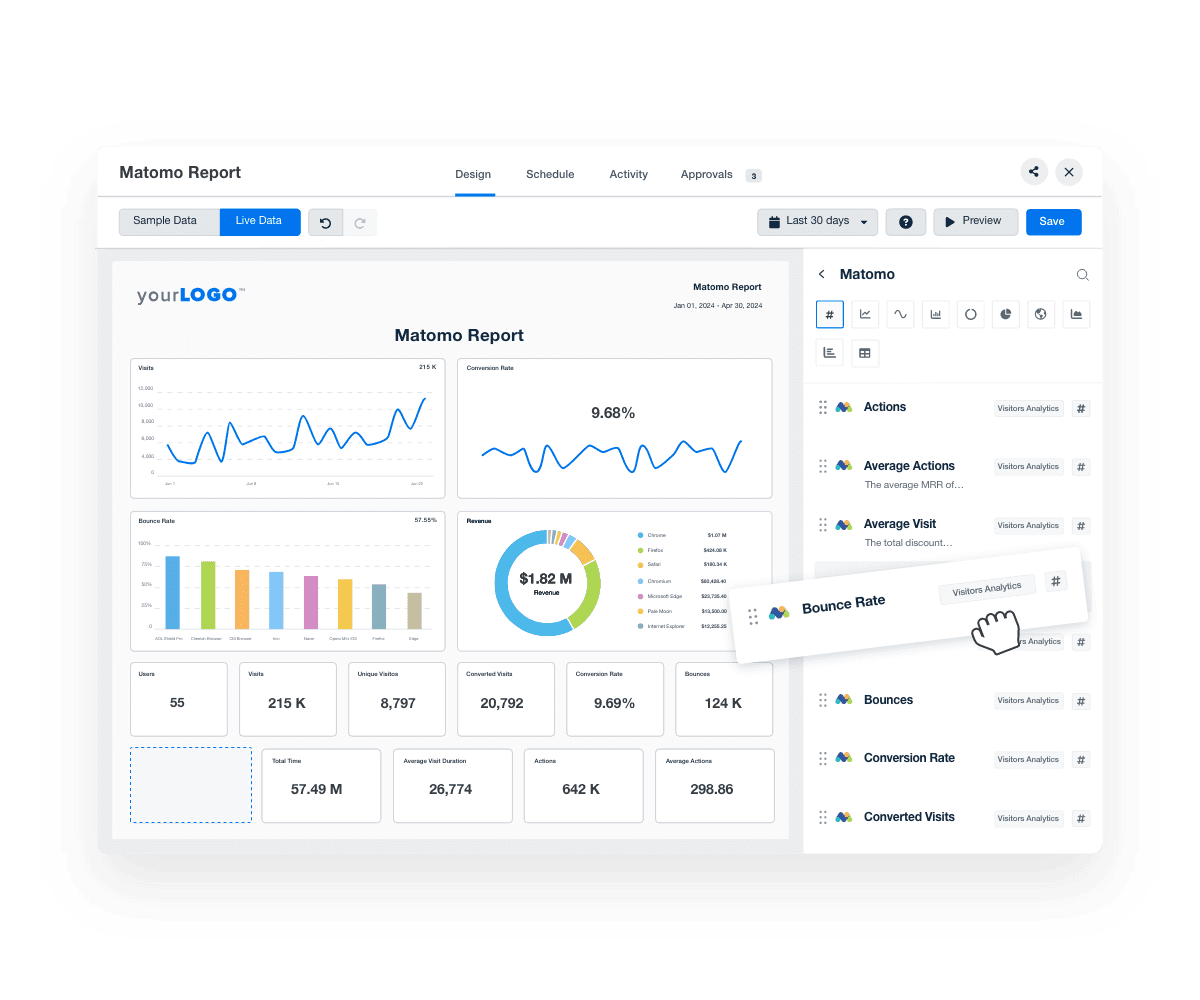
Customizable Matomo Dashboard for Smarter Web Analytics
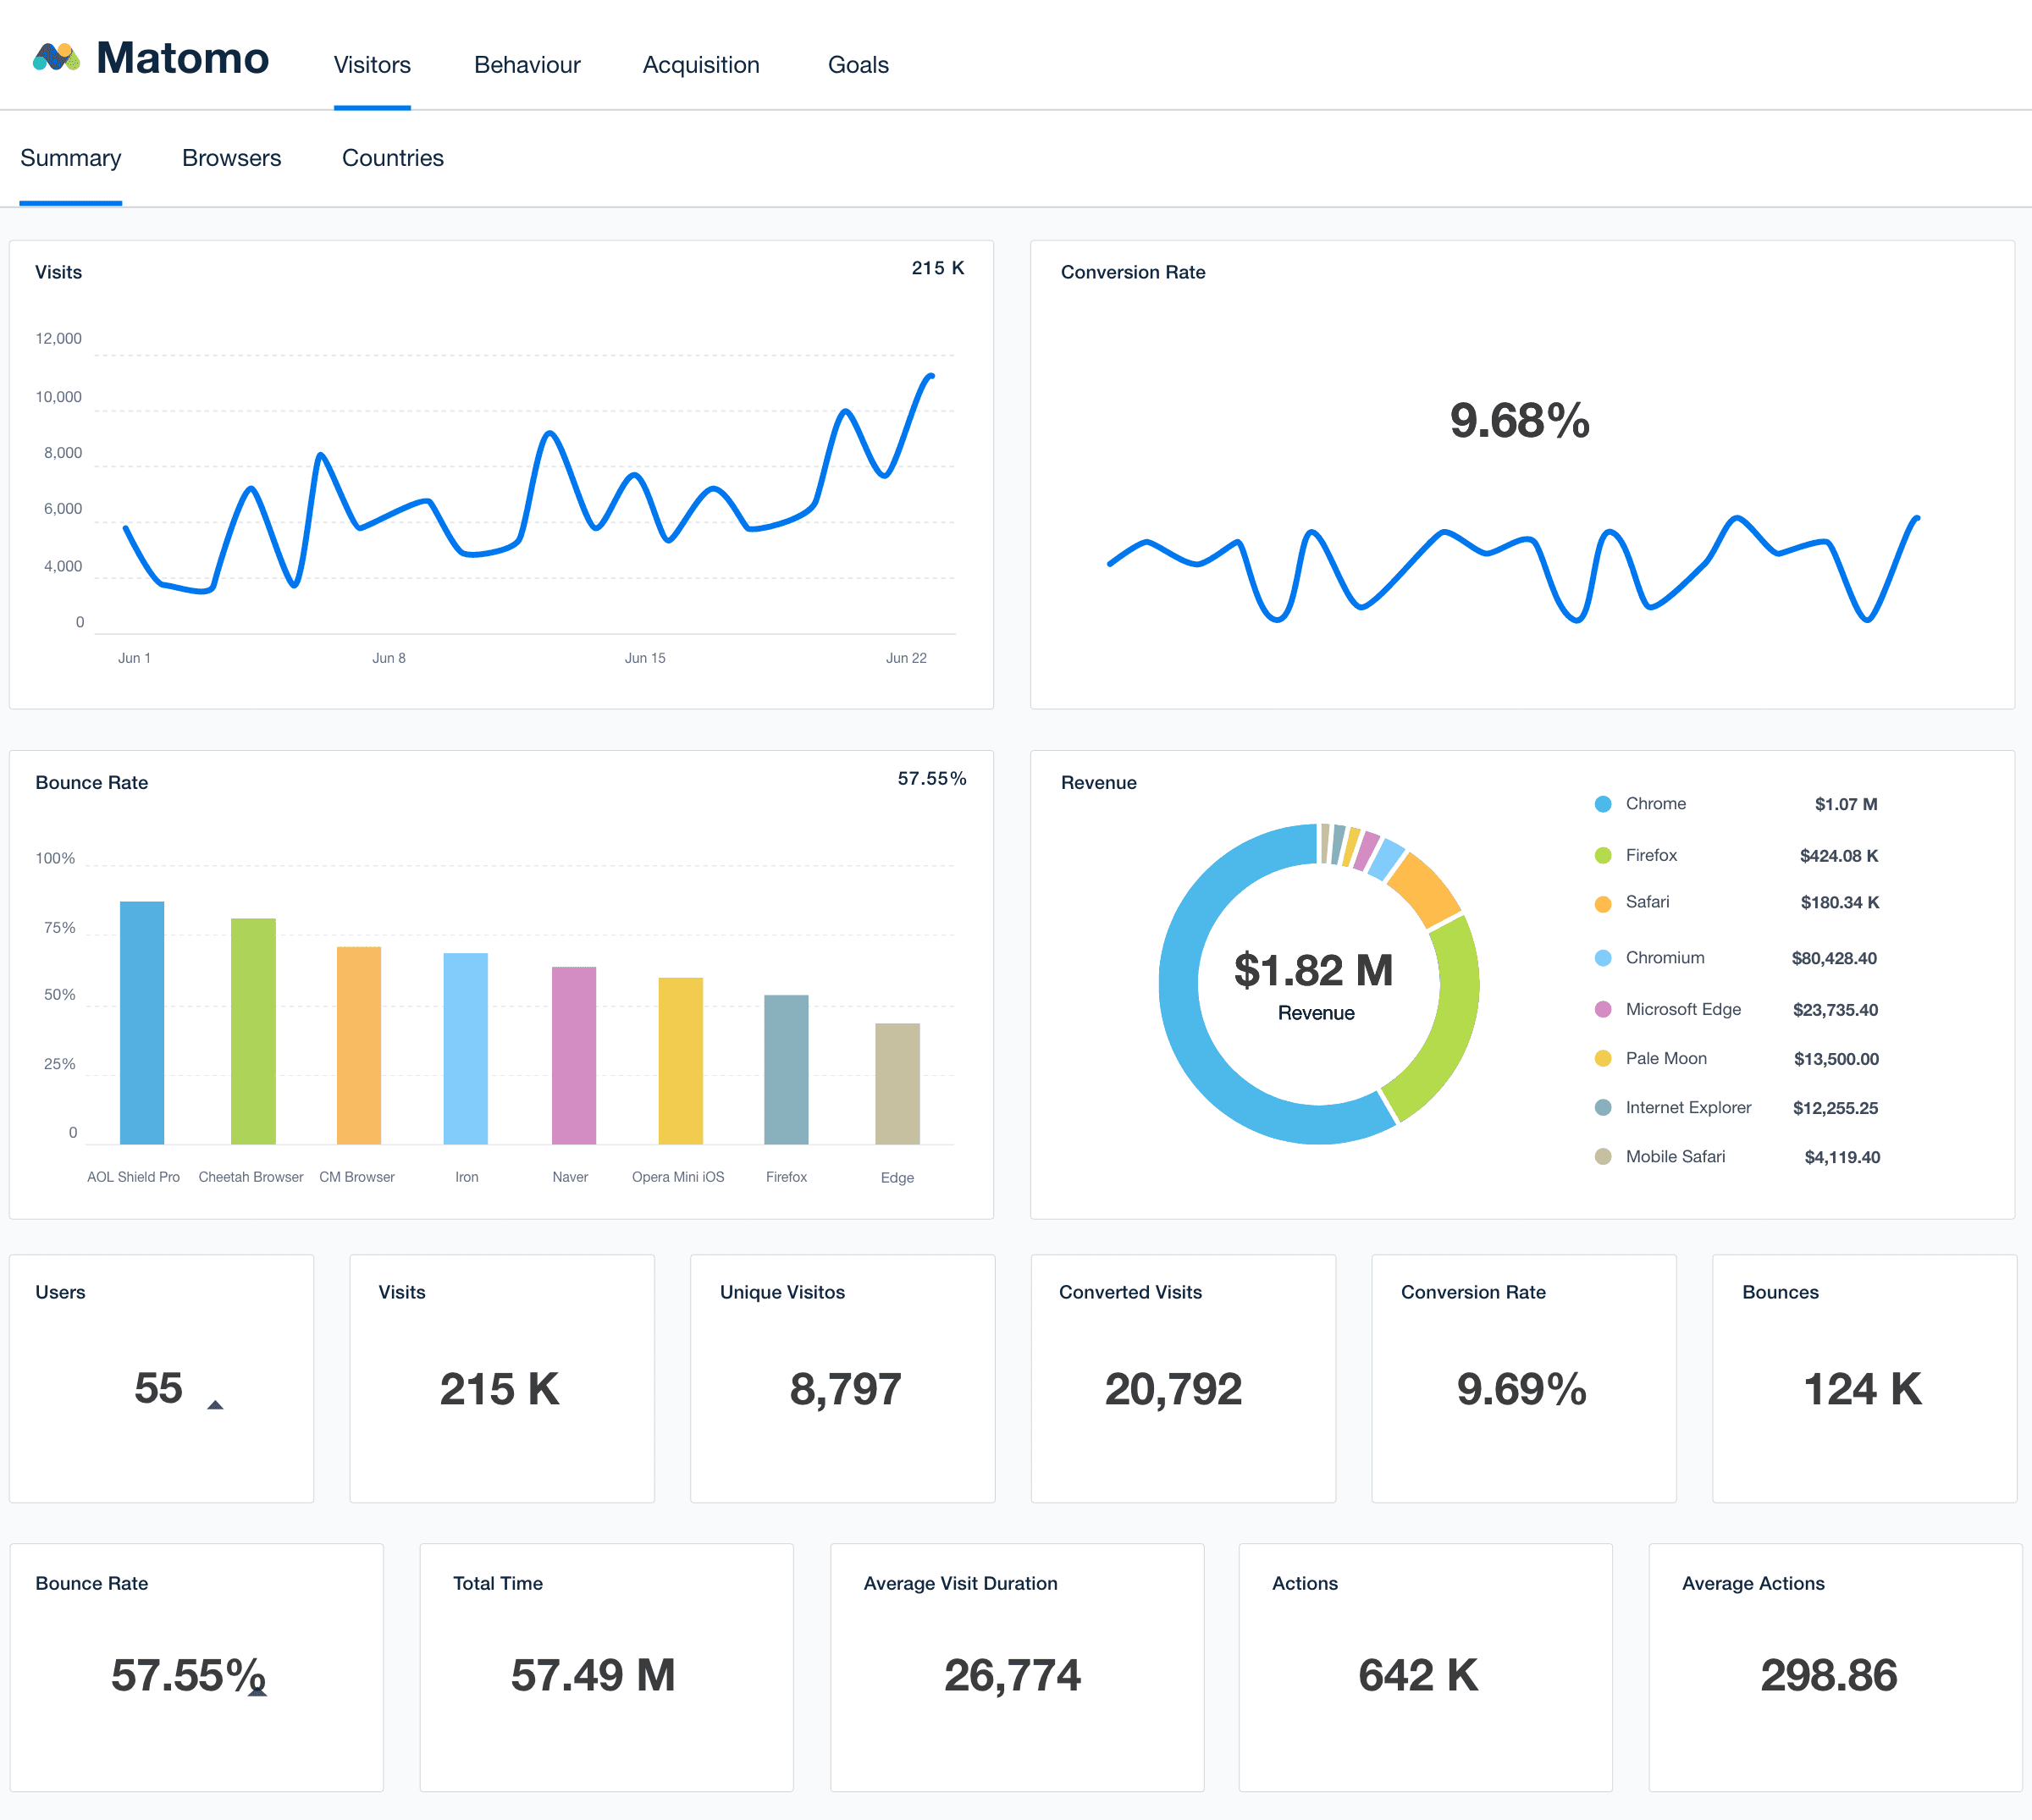
A white-labeled Matomo dashboard consolidates essential website analytics, making it easier to track traffic sources, user behavior, and conversions. Customize widgets, white label dashboards, and highlight the KPIs that matter most to your clients—all in a single, intuitive format.
Provide clients with a live, up-to-date view of their website performance while streamlining internal analysis. With automated reporting and seamless Matomo integration, agencies save time, improve efficiency, and enhance campaign tracking.

Custom Matomo Dashboards as Unique as Your Agency
All Your Client’s Data, One Dashboard
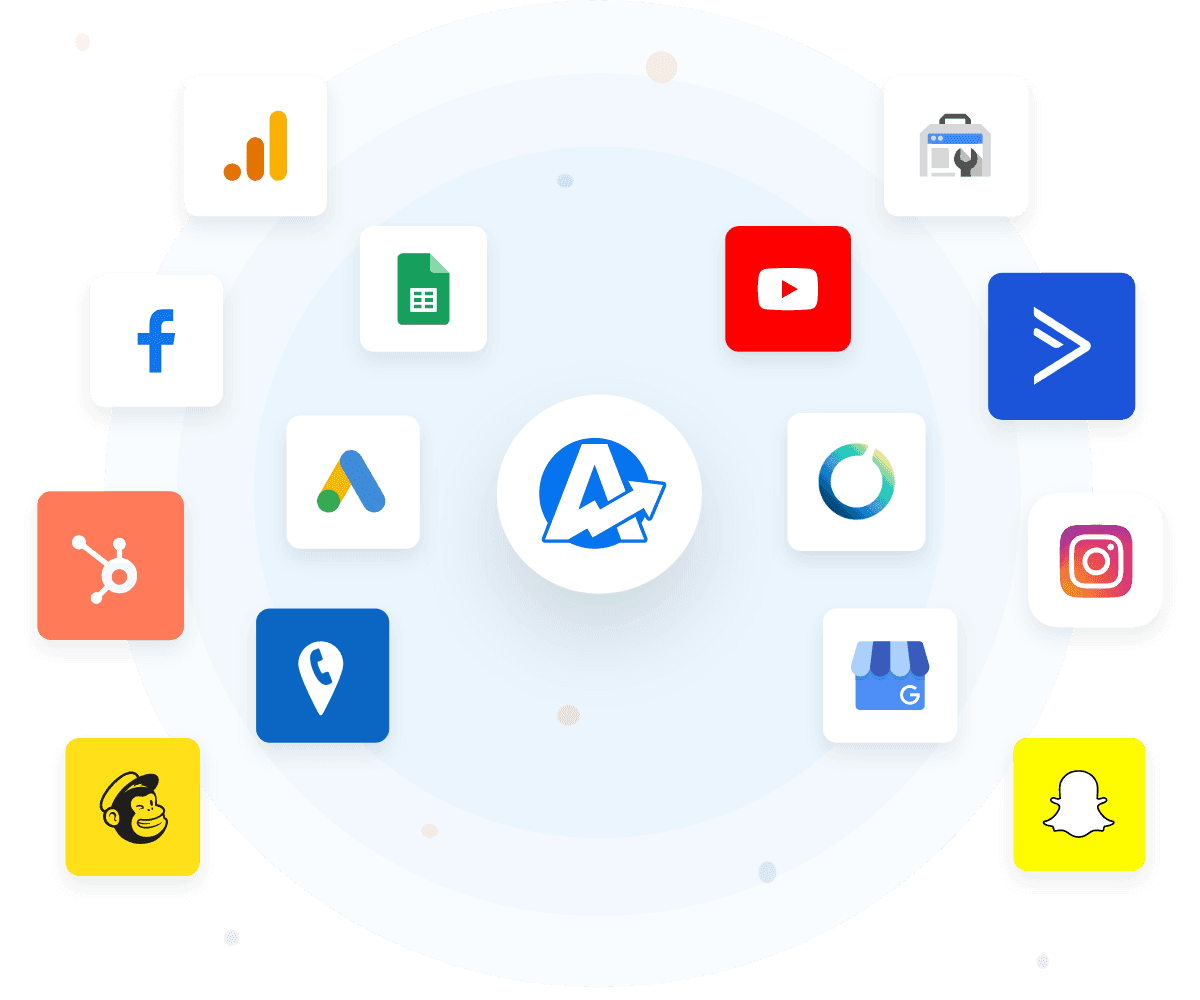
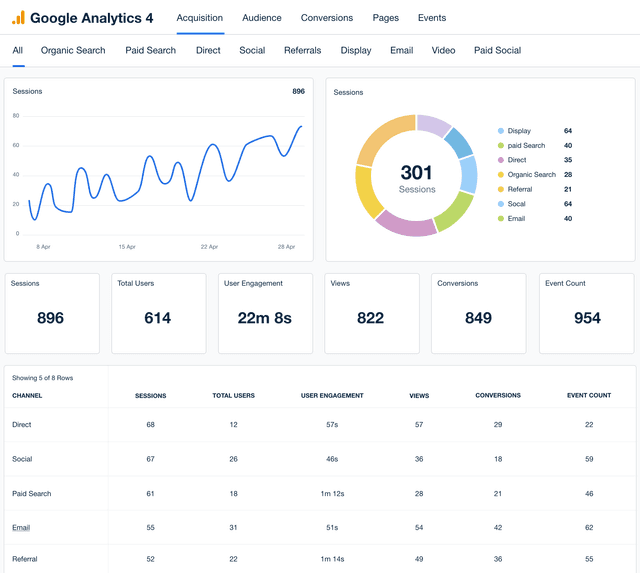
Access 80+ Marketing Platform Integrations
Unify your client reporting toolkit with 80+ platform connections. Centralize data sources for all your client’s campaigns into a complete picture of performance.
Make informed decisions, streamline workflows, and deliver exceptional client results.
Your Reports, Your Brand
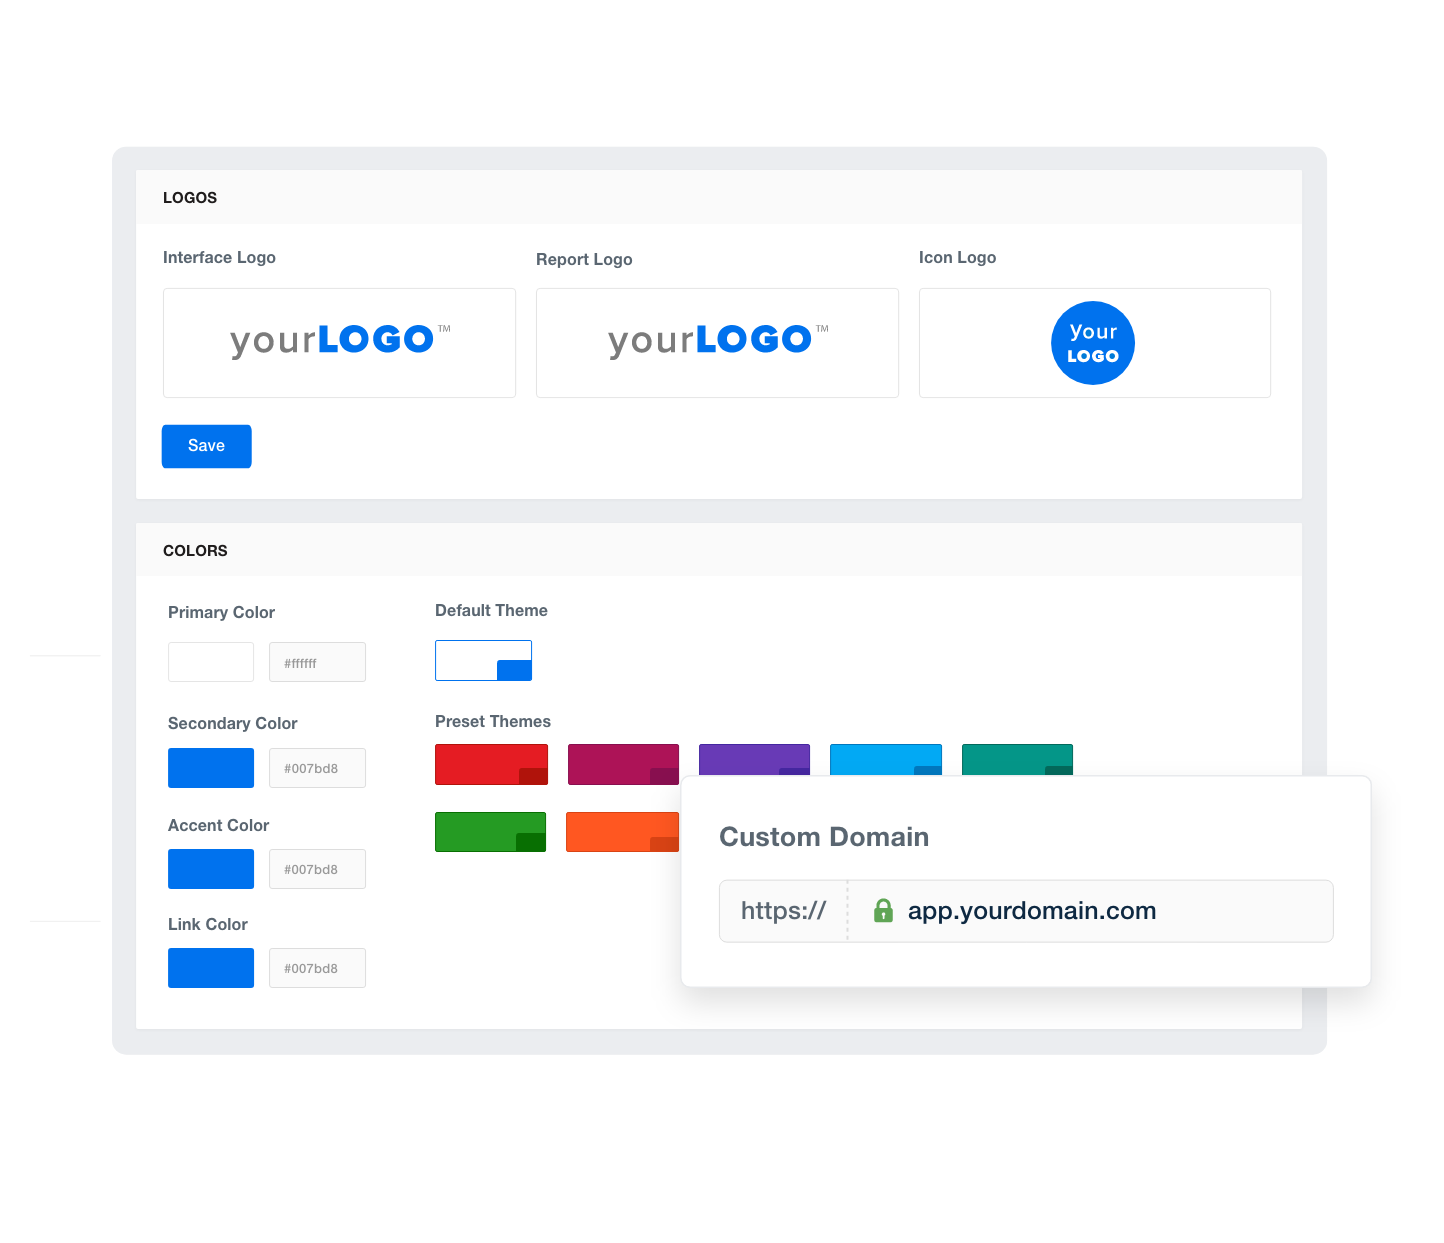
Deliver Branded Dashboards & Reports
White label Matomo reporting transforms generic reports into powerful brand extensions. Customize logos, colors, and more to create client deliverables that reflect your agency's identity perfectly.
Strengthen your brand, build trust, and position your agency as the expert in its field. Your clients see your vision, not a third-party tool.
Support When You Need It
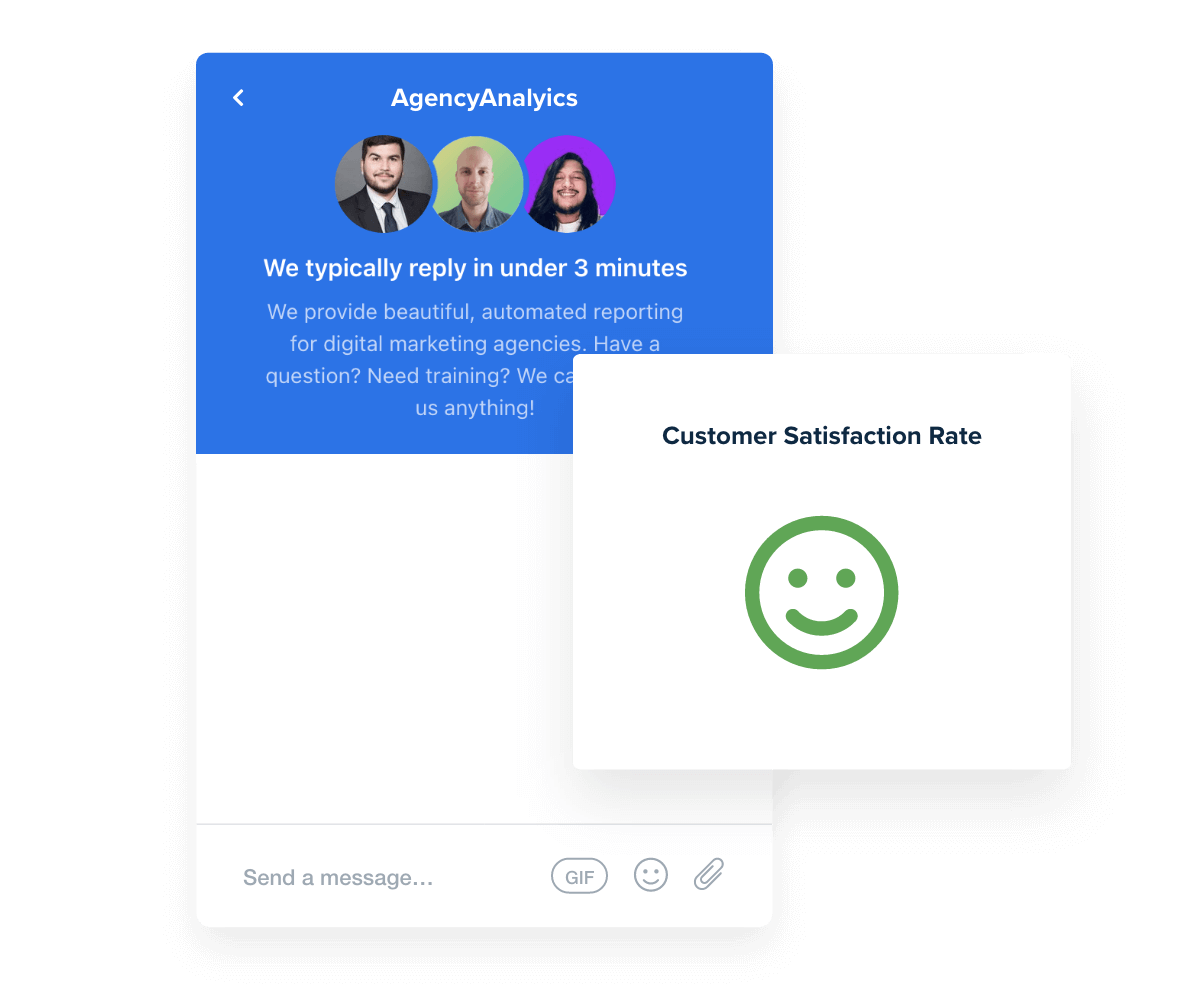
24/5 Live Chat With Under 3-Minute Response Times
Your agency's needs come first with a dedicated and experienced support team. Available 24/5, our live chat ensures your questions are answered swiftly, with an average response time of under 3 minutes.
In-house experts guide you through everything from creating Matomo dashboards to optimizing reports, helping you deliver top-notch service to your clients.
You care about your client’s success. We care about yours.
Give Your Agency Time To Grow
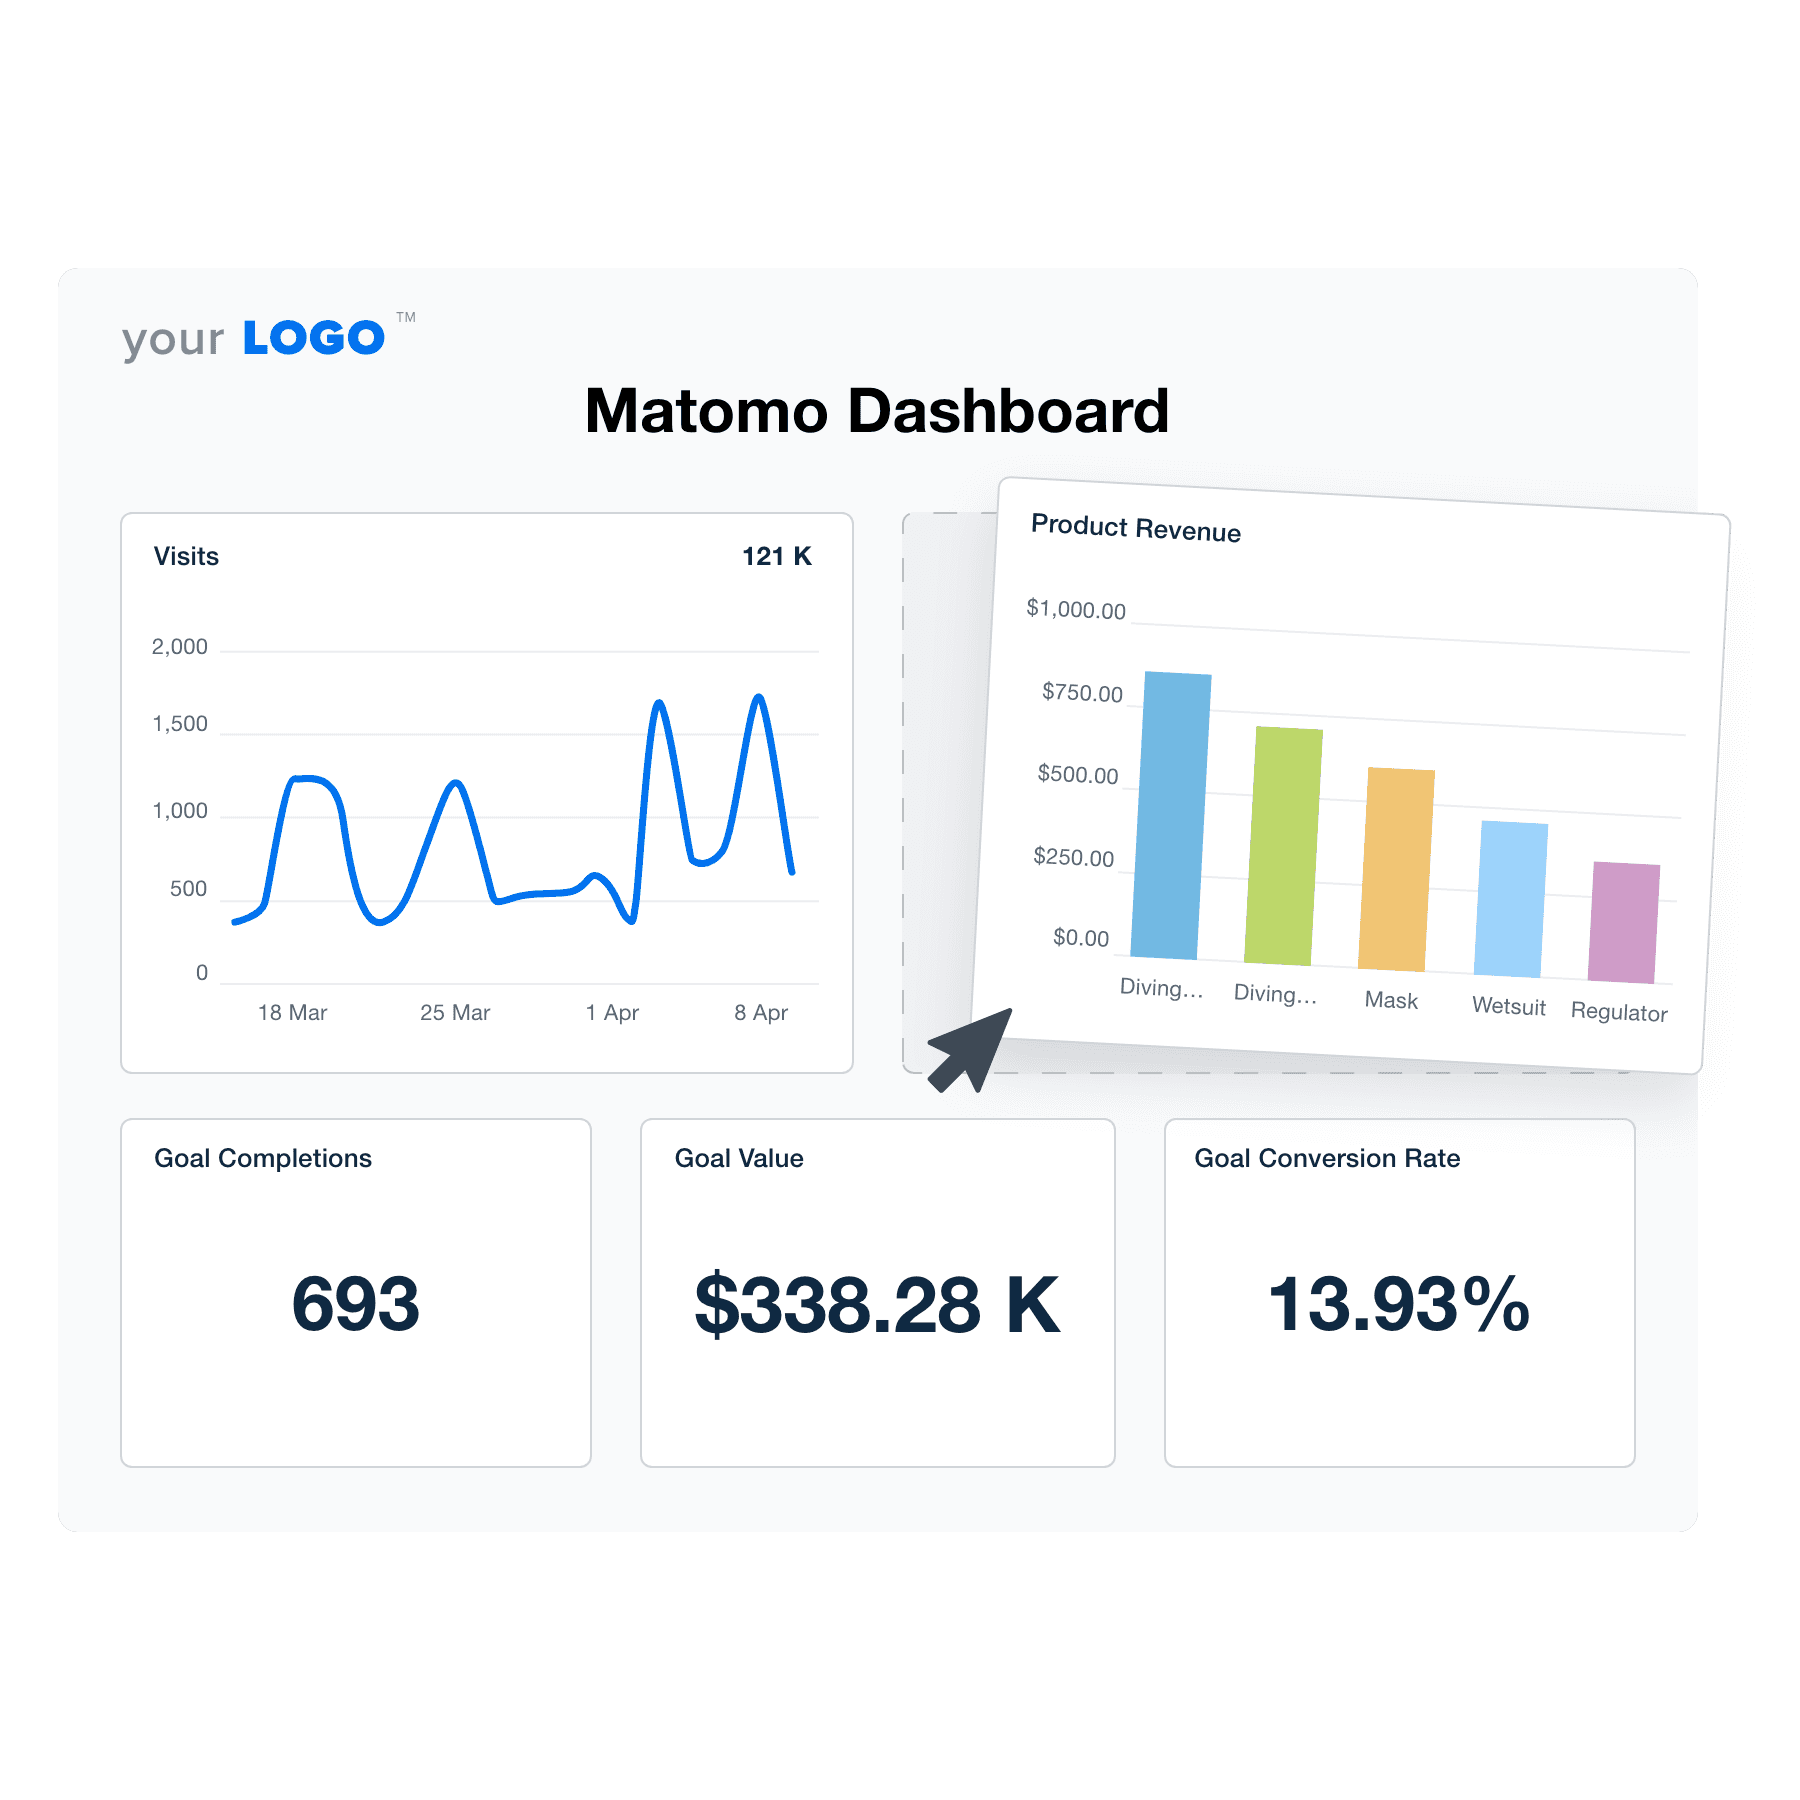
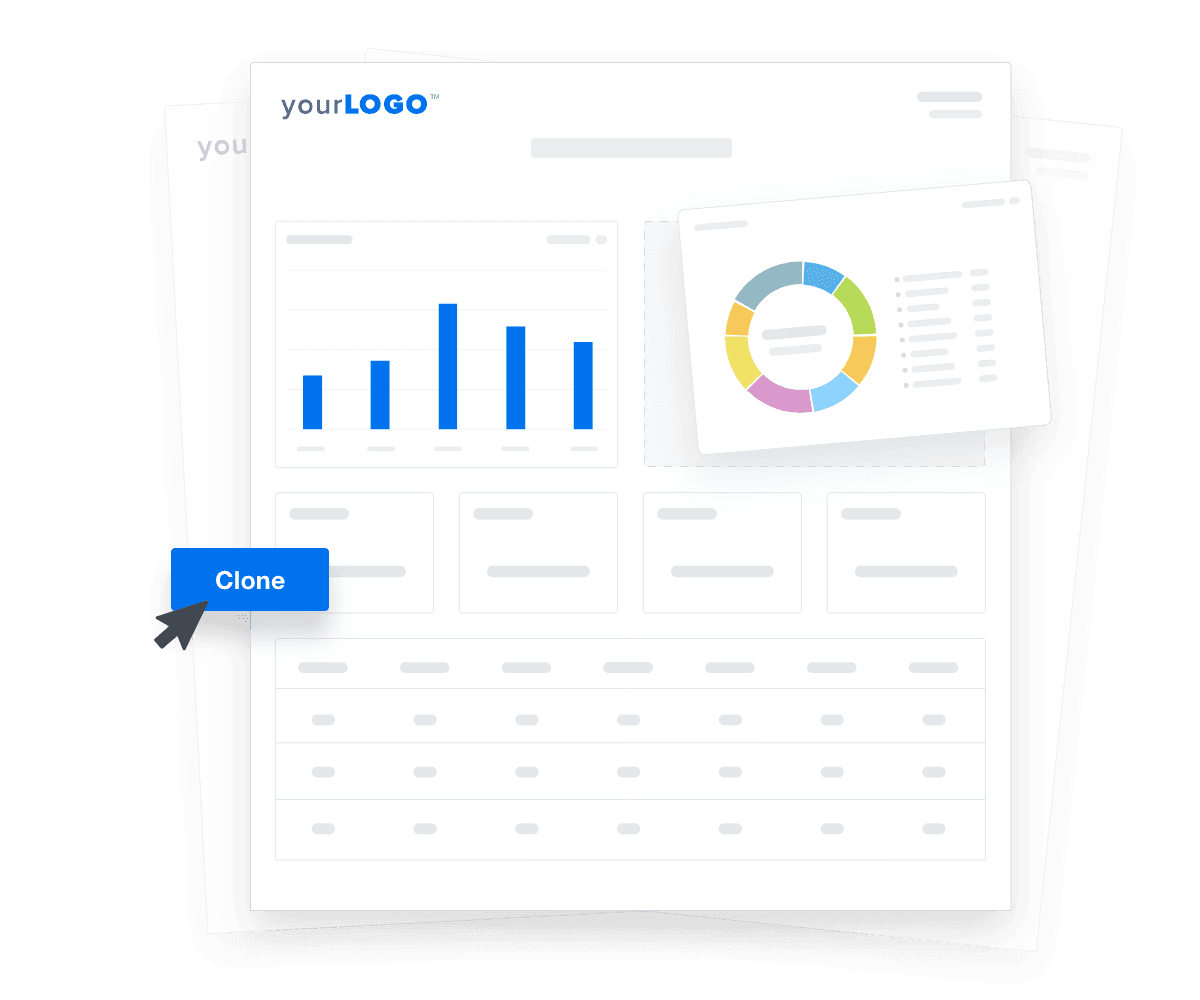
Maximize Efficiency With a Matomo Dashboard Template
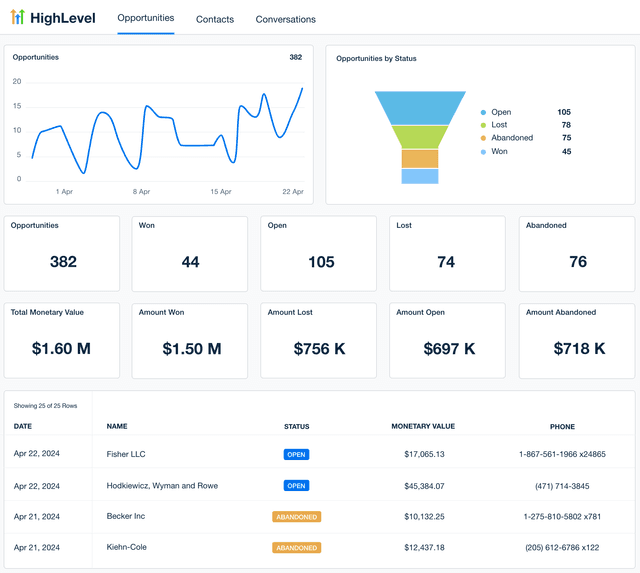
Save time every month by automatically including the most critical Matomo data along with marketing metrics from over 80 other data sources in one platform.
Pull in key metrics from Google Ads, Facebook, Google Search Console, and more to give clients a complete picture of their website performance.
Customize your agency’s bespoke Matomo dashboard and quickly clone it to speed up client onboarding. Use the time saved on client reporting and data visualization to grow your agency.
Report Smarter. Not Harder.
Streamline Reporting and Focus On What Matters
Using Matomo dashboards streamlines client reporting and website analysis, giving agencies time to focus on what truly matters: crafting winning campaigns and earning client trust.
By leveraging Matomo dashboard templates, agencies quickly set up comprehensive reports tailored to each client's needs. This saves time and ensures consistency and accuracy across all reports. As the agency grows, the automated reporting system scales effortlessly, handling increased data loads and more clients with ease.
4 Sections To Include in a Matomo Dashboard
The true power of a customizable Matomo dashboard lies in its ability to offer a comprehensive, bespoke view of a client's website performance. By strategically organizing website analytics data into distinct sections, agencies create dashboards that not only provide valuable insights but also enhance the clarity and impact of their reports.

FAQs About Custom Matomo Dashboards
Still have questions about how to create and use custom Matomo Dashboards? Don’t worry, we’ve got you covered.
A Matomo Dashboard consolidates website analytics from the Matomo platform into a centralized interface. It helps agencies track key performance indicators such as visits, bounce rates, goal completions, and user behavior, supporting data-driven decisions across client campaigns.
To create a white label Matomo Dashboard, integrate your client’s Matomo account within AgencyAnalytics. Apply your agency’s branding—such as custom colors, logos, and domains—so clients experience a professional, fully branded reporting environment.
The dashboard should include key metrics including sessions, unique visitors, page views, bounce rate, and traffic source breakdowns. It should also cover goal completions and eCommerce tracking where configured in the Matomo account.
The dashboard provides detailed insights into user interactions—such as time on site, exit pages, and traffic paths—making it easier to evaluate content effectiveness and user retention across each client’s website.
Unlike Matomo’s native interface, the AgencyAnalytics version is built for cross-client reporting and collaboration. It brings together Matomo data alongside other marketing integrations in a single, streamlined dashboard with automated reporting and white labeling features.
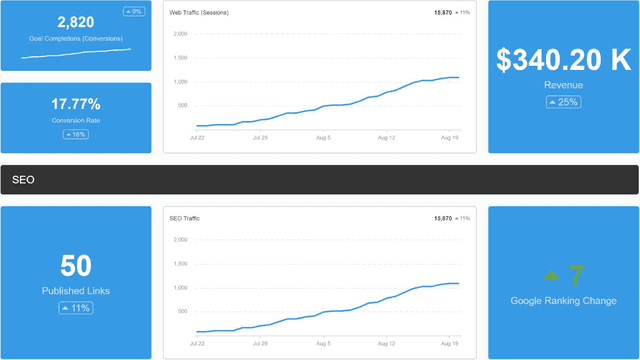
Agencies often rely on the digital marketing dashboard to manage digital marketing data, the SEO reporting dashboard to analyze SEO results, and the social media analytics dashboards to report on social media performance. They also use the PPC reporting dashboards for PPC campaign summaries and the website analytics dashboards to monitor web analytics engagement.
More templates
See how 7,000+ marketing agencies help clients win
Start Your Trial Now
Free 14-day trial. No credit card required.