Google Analytics Dashboard
What Is a Google Analytics Dashboard?
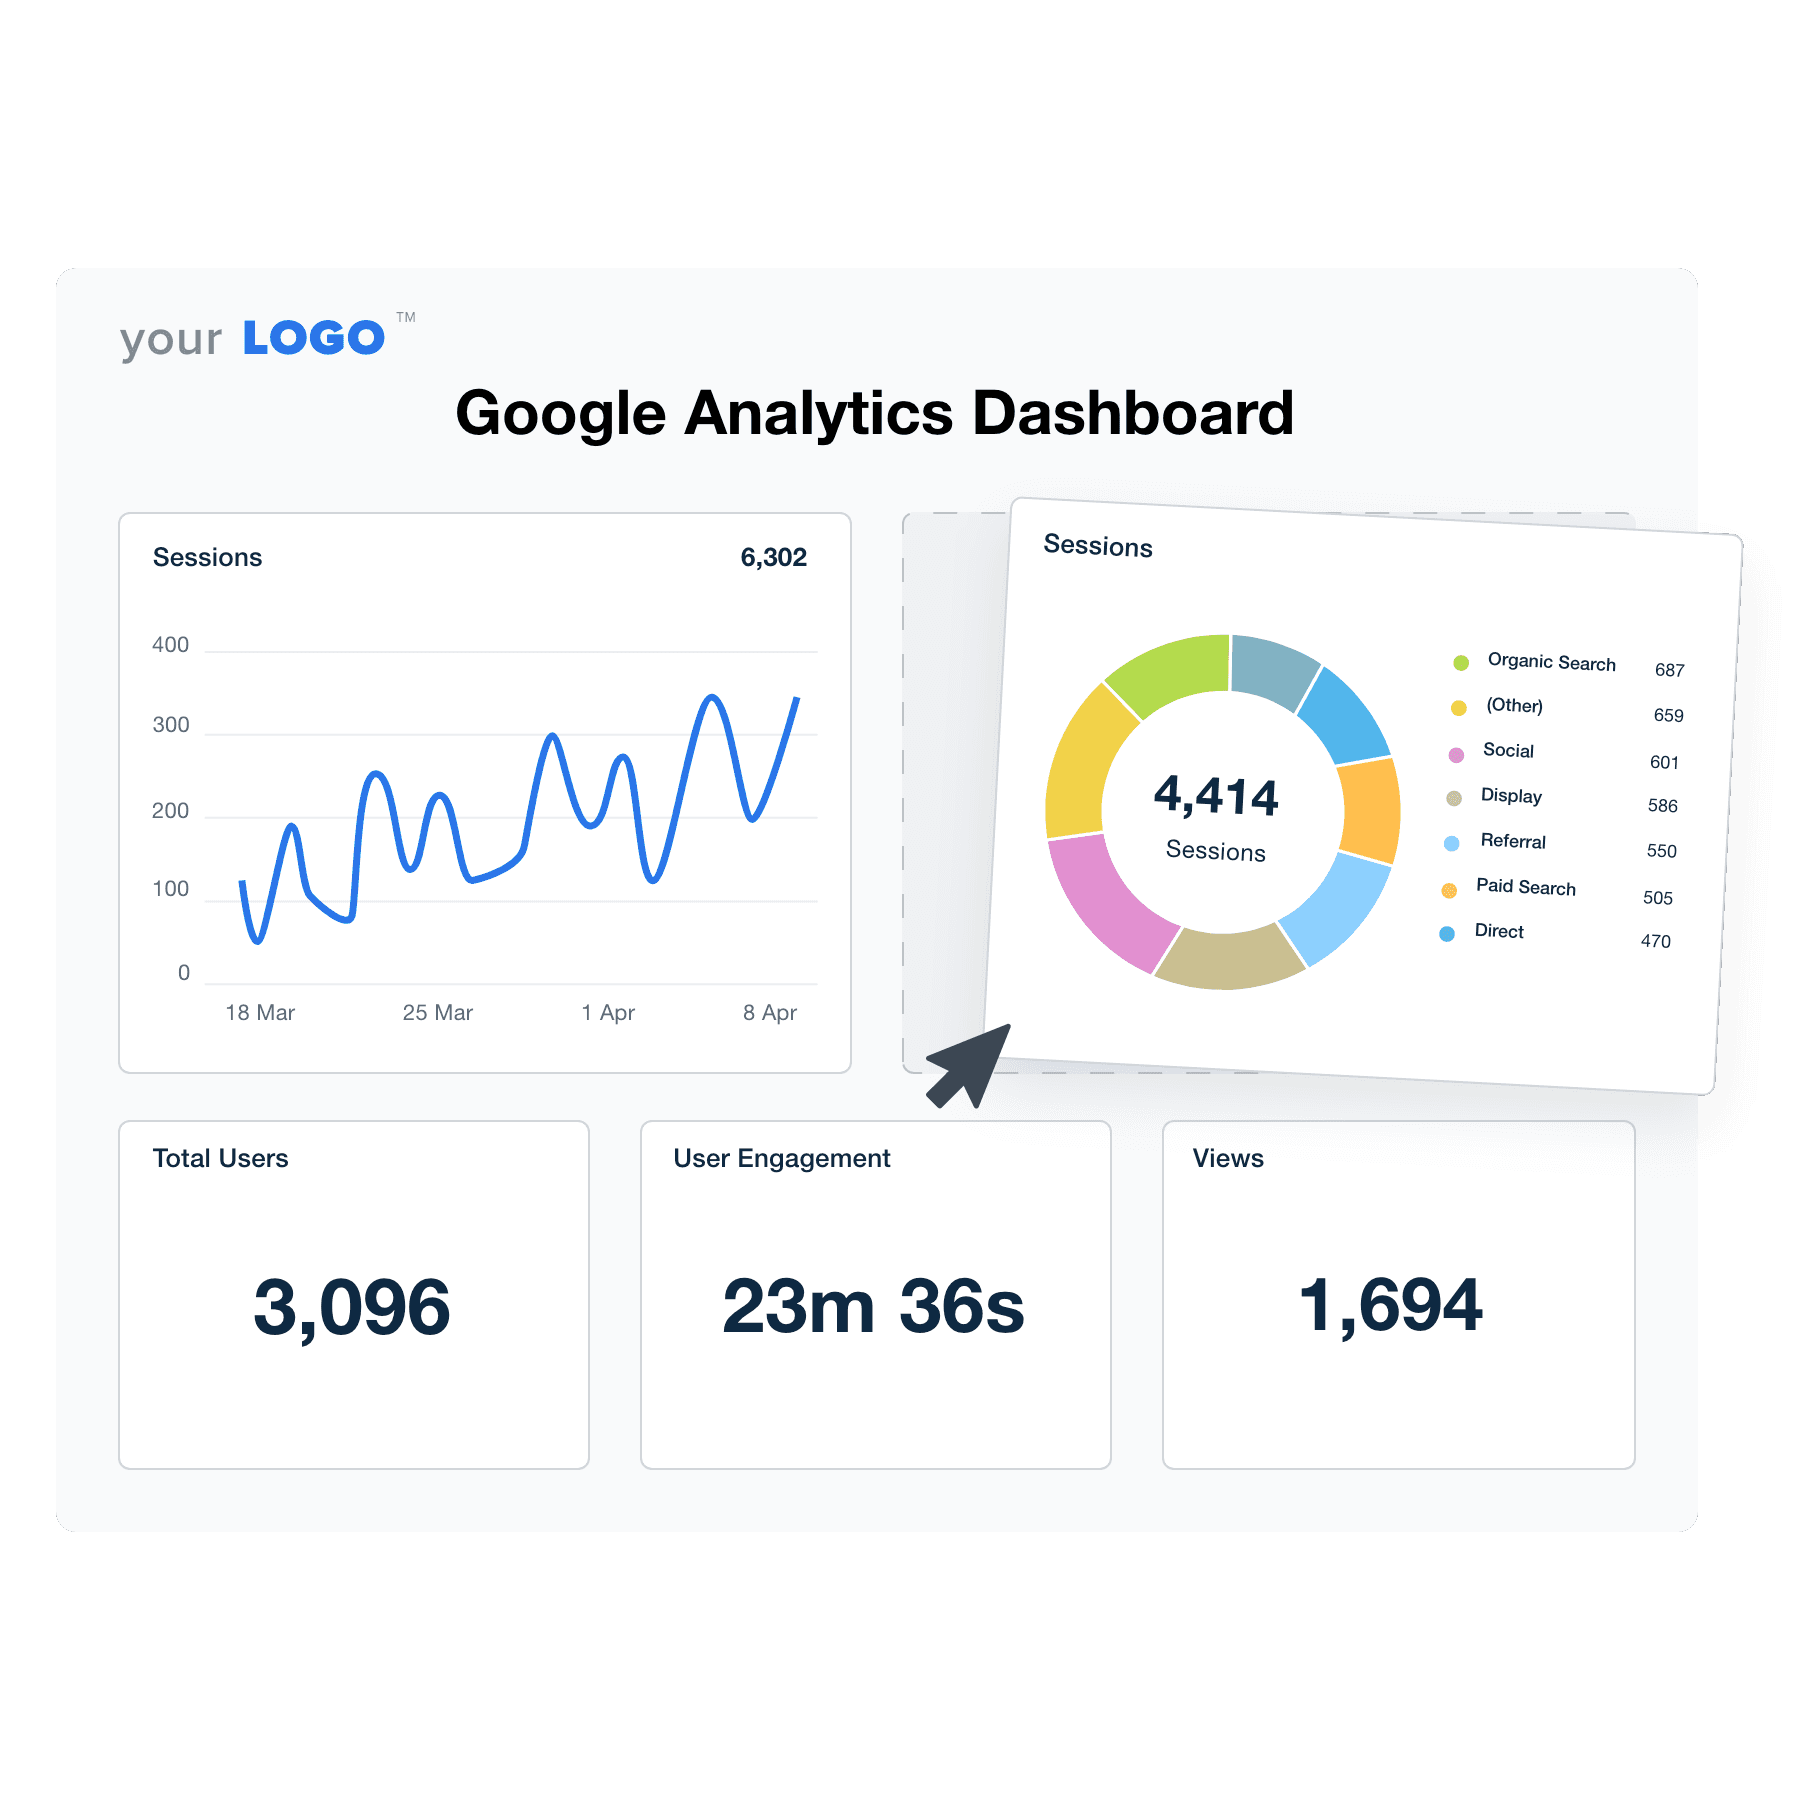
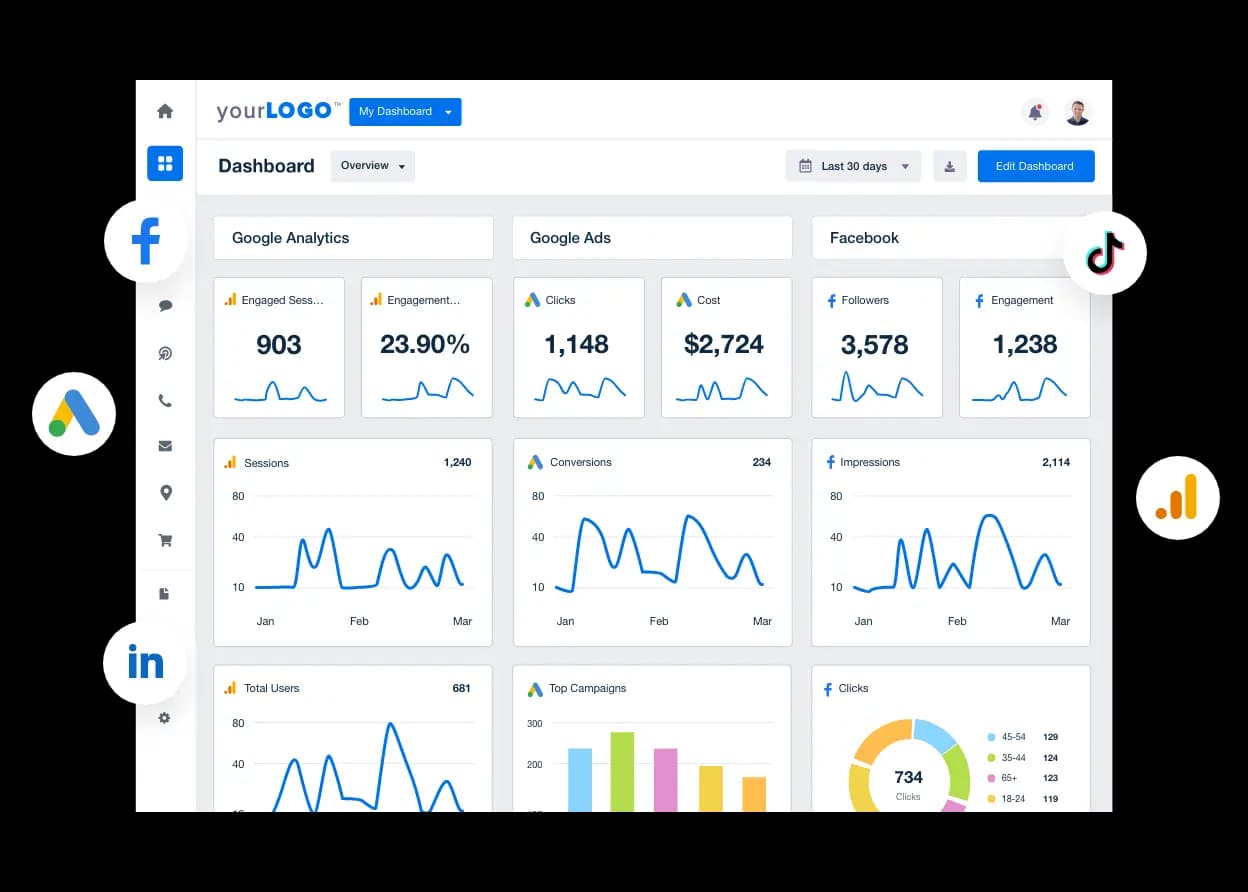
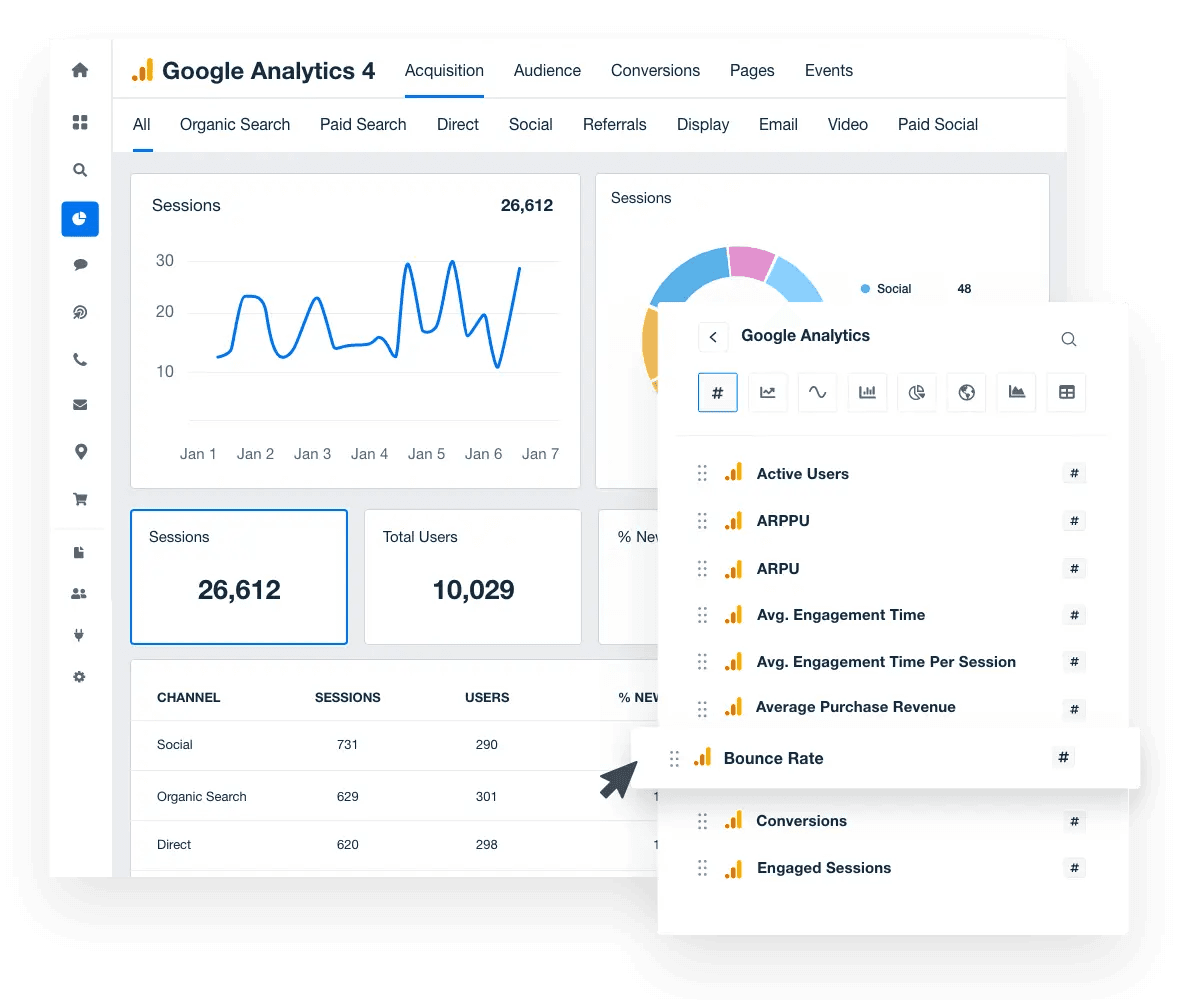
A white-label Google Analytics Dashboard is a customized, agency-branded dashboard that displays essential data insights from the Google Analytics platform. It helps agencies create reports and present data in a personalized, professional manner, reinforcing their brand while providing clients with clear insights into their website performance. This customizable dashboard tracks critical metrics such as user sessions, engagement rate, conversion rate, and revenue, making it easier to analyze and optimize client campaigns.
Why Your Agency Needs a Customizable Google Analytics Dashboard
A customizable Google Analytics dashboard simplifies the complex world of digital marketing metrics. Standard GA4 dashboards often overwhelm users with layers of data that cause more confusion than clarity. Focus your custom dashboards on the website data that matters, helping you prioritize key metrics and KPIs that drive client success.
Consider the time saved when your agency no longer has to dig through layers of confusion or irrelevant filters. Instead, a tailored dashboard presents the key insights for each campaign. This clarity allows for faster, more accurate analysis and decision-making.
Make data-driven insights a seamless part of your everyday workflow, freeing your team to focus on creativity and strategy.
Whether it’s monitoring traffic, optimizing conversion rates, analyzing user behavior, or evaluating the effectiveness of ad spend, the data you need is front and center. Designed for marketing agencies, the AgencyAnalytics white label Google Analytics dashboard provides an intuitive, user-friendly experience.
7 Sections To Include in a Custom Google Analytics Dashboard
1. Performance Overview
Highlighting the most important KPIs on the first page of the dashboard delivers two major benefits for your agency. First, it provides clients with automated marketing reports, offering a clear, concise snapshot of their campaign performance. This transparency fosters trust, satisfaction, and client retention.
Second, it helps your team identify areas that require attention, streamlining the optimization process and driving campaign improvements.
With the key metrics front and center, your agency drives better results and maintains a sharp focus on what matters most.
2. Goal Tracking
Include goal tracking in your dashboard to provide clear visibility into how campaigns are performing relative to the client’s objectives. This helps measure success and quickly pinpoints areas that need adjustment.
With goal tracking, you demonstrate the tangible value your agency delivers, ensuring clients see the direct impact of your efforts on their business goals.
Here are a few best practices to consider when setting relevant KPI goals that align your agency's efforts with your clients' objectives:
Focus on metrics that directly impact your client's business goals, such as revenue or lead generation.
Ensure KPIs are measurable and can be tracked accurately over time.
Regularly review and adjust goals based on performance data and client feedback.
3. Acquisition Overview
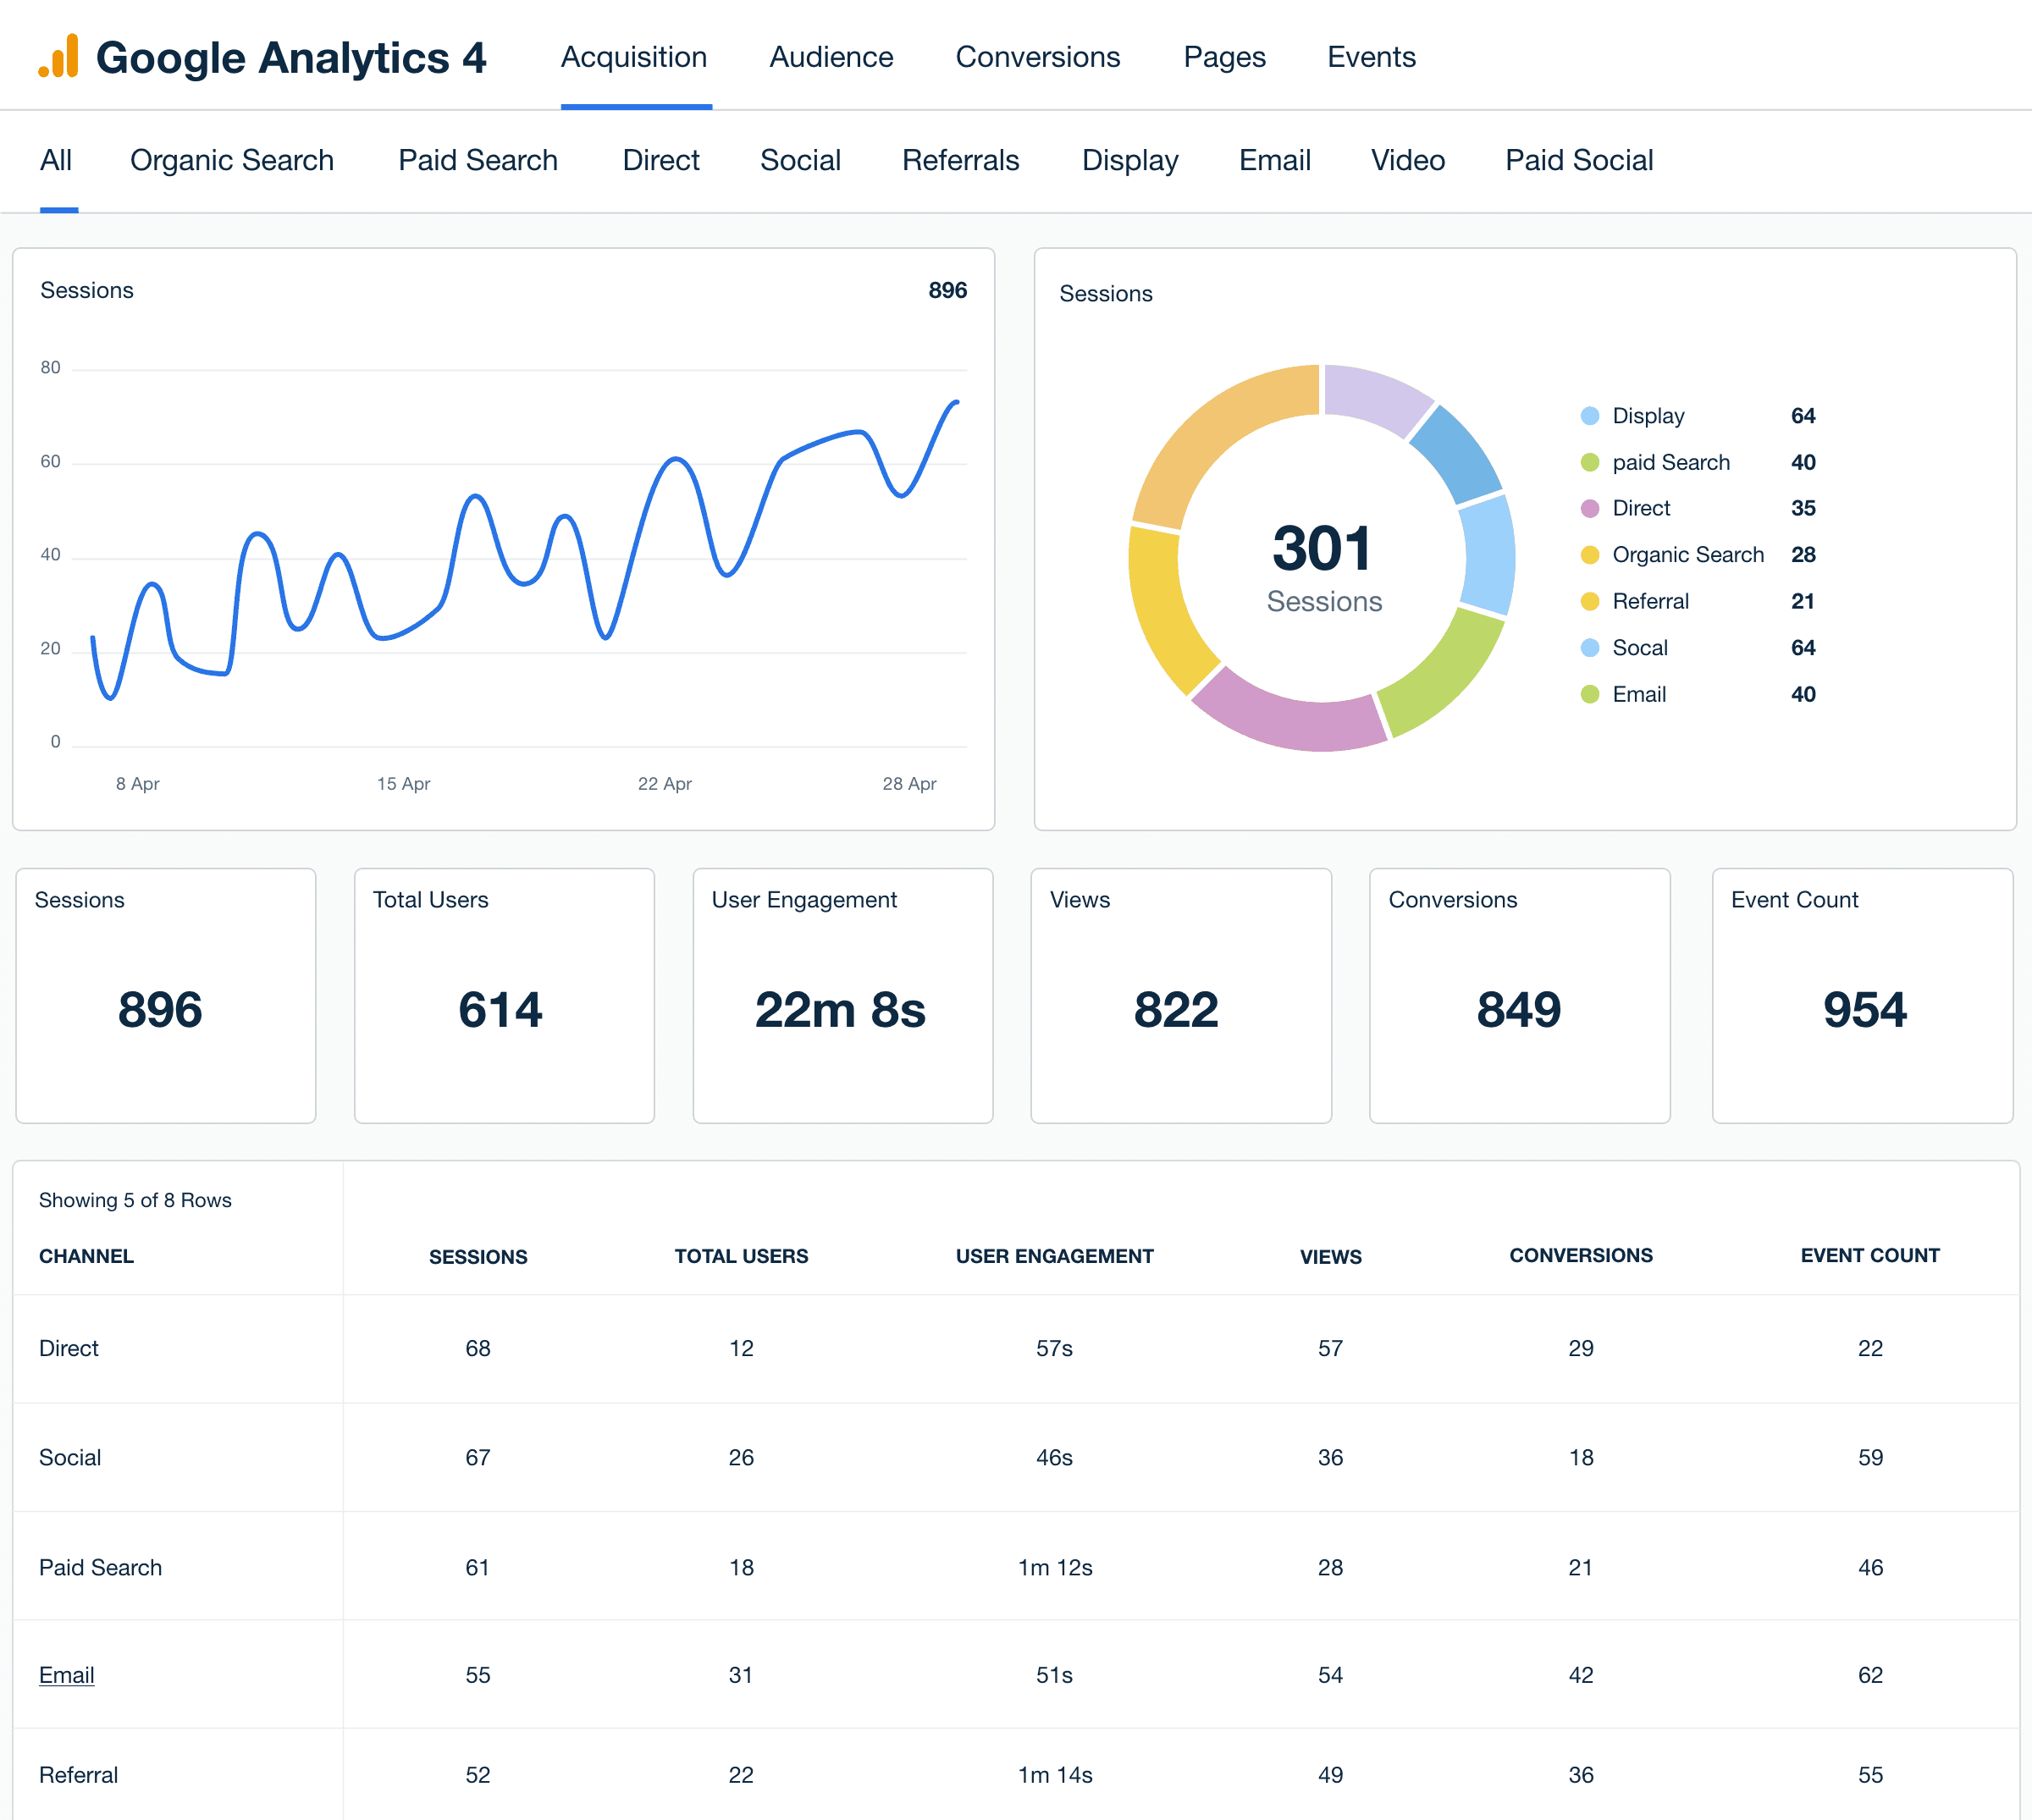
Tracking traffic sources in a client’s Google Analytics account is essential for understanding how users find a client's site. This metric breaks down where visitors come from, whether it's organic search, Google ads, social media, direct visits, and more. Knowing the origin of traffic provides valuable insights for optimizing marketing strategies and improving campaign performance.
Diving deeper, traffic source analysis helps agencies see which channels are driving the most valuable visitors. By dissecting traffic and user behavior by each channel, including organic search, paid search, direct traffic, and social media, agencies pinpoint strengths and areas for improvement.
This detailed view ensures that marketing efforts are targeted and effective, showcasing the value provided to clients and making optimization easier.
Metric | Importance | Use Case Examples |
---|---|---|
Metric Sessions | Importance Critical | Use Case Examples Tracks the total number of visits and helps measure overall traffic growth for each channel. |
Metric Engagement Rate | Importance Important | Use Case Examples Evaluates user interaction with the site to drive data-driven improvements to content and UX. |
Metric Conversion Rate | Importance Critical | Use Case Examples Measures the percentage of visitors who complete desired actions, indicating campaign success. |
Metric Revenue | Importance Critical | Use Case Examples Assesses the monetary value generated from different traffic sources, crucial for ROI analysis. |
Including these metrics in a Google Analytics dashboard helps agencies demonstrate clear value to clients and streamline the optimization of marketing efforts.
Agency Tip: For SEO-focused campaigns, easily include data from keyword rankings, Google Search Console insights, and other key SEO metrics to highlight positions, impressions, and clicks for priority keywords.
4. Audience Overview
Tracking audience key performance indicators in a Google Analytics dashboard provides essential insights into visitors' identities and interactions with a client's site. Understanding these aspects helps tailor marketing strategies to meet the needs of each client’s target audience.
By analyzing audience data inside a dynamic digital marketing dashboard, agencies identify key demographics and preferences. This includes pinpointing where users are located, the devices they use to access the site, and their engagement levels as new or returning visitors.
These detailed insights enable more effective targeting and personalization of campaigns, ensuring that marketing efforts are both relevant and impactful.
Metric | Importance | Use Case Examples |
---|---|---|
Metric Location | Importance Critical | Use Case Examples Identifies geographic areas with high engagement, guiding location-based marketing strategies. |
Metric Devices | Importance Important | Use Case Examples Understands device preferences, optimizing the site for better user experience across platforms. |
Metric New vs Returning Visitors | Importance Useful | Use Case Examples Tracks visitor loyalty and engagement, helping refine strategies for retention and acquisition. |
Including this detailed data in a Google Analytics dashboard or marketing reports helps agencies demonstrate clear value to clients and optimize their marketing efforts effectively.
5. Conversions Overview
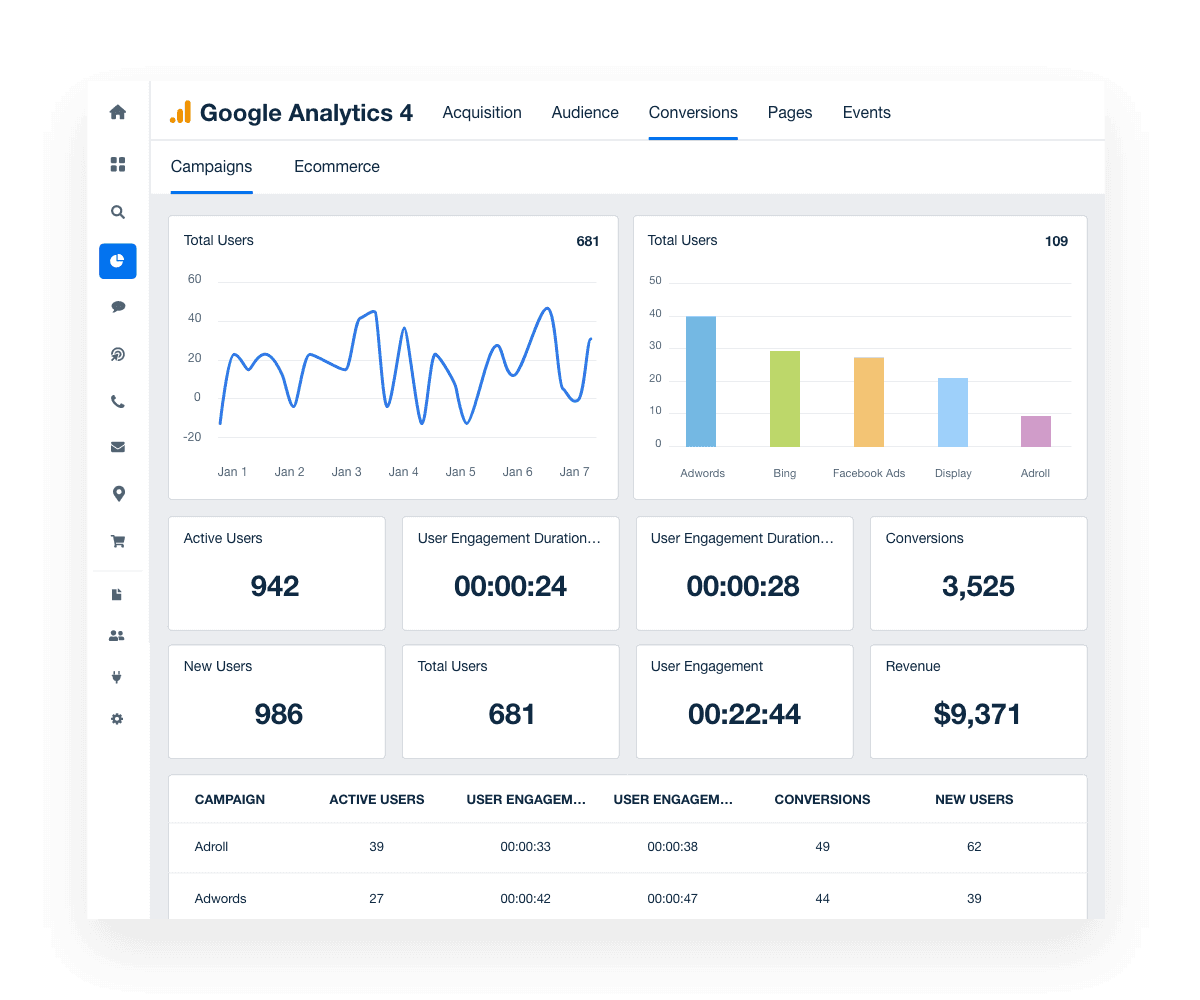
Conversion metrics are the heart of measuring client campaign success. This includes data on campaign conversions and key ecommerce metrics. Understanding how well your agency’s campaigns are turning visitors into customers provides the insight needed to refine strategies and improve results.
Seeing the bigger picture, conversion data shows which campaigns inspire action, whether it's signing up for a newsletter or making a purchase.
Key ecommerce metrics like transaction volume, average order value, and revenue paint a clear picture of financial success.
Metric | Importance | Use Case Examples |
---|---|---|
Metric Campaign Conversions | Importance Critical | Use Case Examples Measures the success of specific marketing campaigns in driving desired actions. |
Metric Transaction Volume | Importance Critical | Use Case Examples Tracks the number of purchases, indicating overall sales performance. |
Metric Average Order Value | Importance Important | Use Case Examples Assesses the average amount spent per transaction, helping to identify opportunities to increase sales. |
Metric Revenue | Importance Critical | Use Case Examples Evaluates the total income generated from sales, crucial for ROI analysis. |
Instead of the painstaking process of trying to extract these metrics from the native Google Analytics platform, creating your own Google Analytics dashboards puts this data at your fingertips. This streamlined access allows for quicker insights and more effective optimization of client campaigns.
6. Pages Overview
Page metrics in your Google Analytics dashboard are essential for understanding how visitors interact with your client's web pages. By analyzing page data, you gain critical insights into which landing pages and web pages capture and retain user attention.
Web analytics, such as page views, average time on page, and bounce rate, help identify high-performing content and areas for improvement.
These insights are valuable for fine-tuning strategies across all marketing channels, ensuring that your efforts in search engine optimization, social media, and paid ads yield the best results.
Metric | Importance | Use Case Examples |
---|---|---|
Metric Page Views | Importance Critical | Use Case Examples Measures the popularity of web pages, guiding content strategy. |
Metric Average Time on Page | Importance Important | Use Case Examples Indicates user engagement, helping improve content quality. |
Metric Bounce Rate | Importance Critical | Use Case Examples Tracks the percentage of visitors who leave after viewing one page, highlighting areas for optimization. |
Metric Exit Rate | Importance Useful | Use Case Examples Shows the last pages users visit before leaving, identifying potential issues or content gaps. |
This data is critical regardless of the campaign type–whether you're focusing on search engine optimization, social media, paid ads, or other marketing channels. Knowing which pages perform best informs your content optimization strategy and enhances overall campaign effectiveness.
7. Events Overview
Tracking website traffic alone provides limited value; it's what happens while users are on the website that truly matters. Events metrics in a custom dashboard reveal detailed user interactions, offering insights beyond mere page visits.
Including event metrics in analytics reports provides a deeper understanding of user behavior, helping to identify which elements drive engagement and conversions.
Metric | Importance | Use Case Examples |
---|---|---|
Metric Event Count | Importance Critical | Use Case Examples Measures the total number of user interactions, guiding engagement strategies. |
Metric Unique Events | Importance Important | Use Case Examples Tracks distinct user actions, helping to identify popular features and content. |
Metric Event Value | Importance Critical | Use Case Examples Assigns a value to specific events, aiding in assessing ROI and prioritizing improvements. |
Metric Event Conversion Rate | Importance Useful | Use Case Examples Shows the percentage of events leading to conversions, highlighting effective engagement tactics. |
Including event metrics in a white label dashboard ensures that every user interaction is accounted for, providing a comprehensive view of website performance. This enables more precise and effective optimization of client campaigns, ensuring that your marketing efforts are both impactful and data-driven.
Customizable Google Analytics Data Dashboards To Meet Client Needs
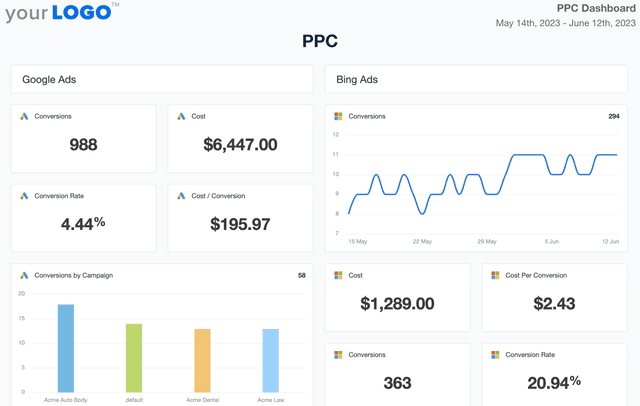
The true power of a customizable Google Analytics dashboard lies in its ability to integrate data from additional marketing platforms to create an all-one-one default dashboard. Adding metrics from other integrations, including Google Ads, Google Search Console, social media platforms, and SEO tools ensures your reporting dashboard covers every critical data point.
Easily create and save custom dashboards using the 11-Second Smart Dashboards feature, which simplifies the dashboard creation process by automatically building tailored dashboards in seconds based on each client’s connected integrations.
Then, simply drag and drop dashboard widgets into place to highlight the most important metrics and KPIs, ensuring that all relevant data is just a glance away.
Streamline Reporting With Google Analytics Dashboards and Focus on What Matters
Using Google Analytics dashboards transforms client reporting and campaign analysis, giving agencies time to focus on what truly matters: crafting winning campaigns and building client trust.
Say goodbye to the hours spent sifting through data and hello to streamlined, impactful reporting. These dashboards provide clear, actionable insights at a glance, saving time and making it easier to demonstrate value to clients.
Customizable starter dashboard templates offer scalability that grows with your agency. Create bespoke templates and reports quickly and efficiently, ensuring consistency and accuracy across all client communications.
With custom reports, we can zoom in on the key performance indicators and metrics that matter most to our clients, making our reporting experience incredibly valuable and directly relevant to their success.
Digital Freak
Custom Google Analytics Dashboards as Unique as Your Agency
Access Data From 80+ Marketing Platforms in One Place
Combine data from Google Analytics 4 with over 80 platform integrations for real-time insights that fuel proactive campaign management.
Respond faster to changes, optimize across channels, and maximize campaign effectiveness with one powerful platform.
Increase Client Trust With White-Label Dashboards
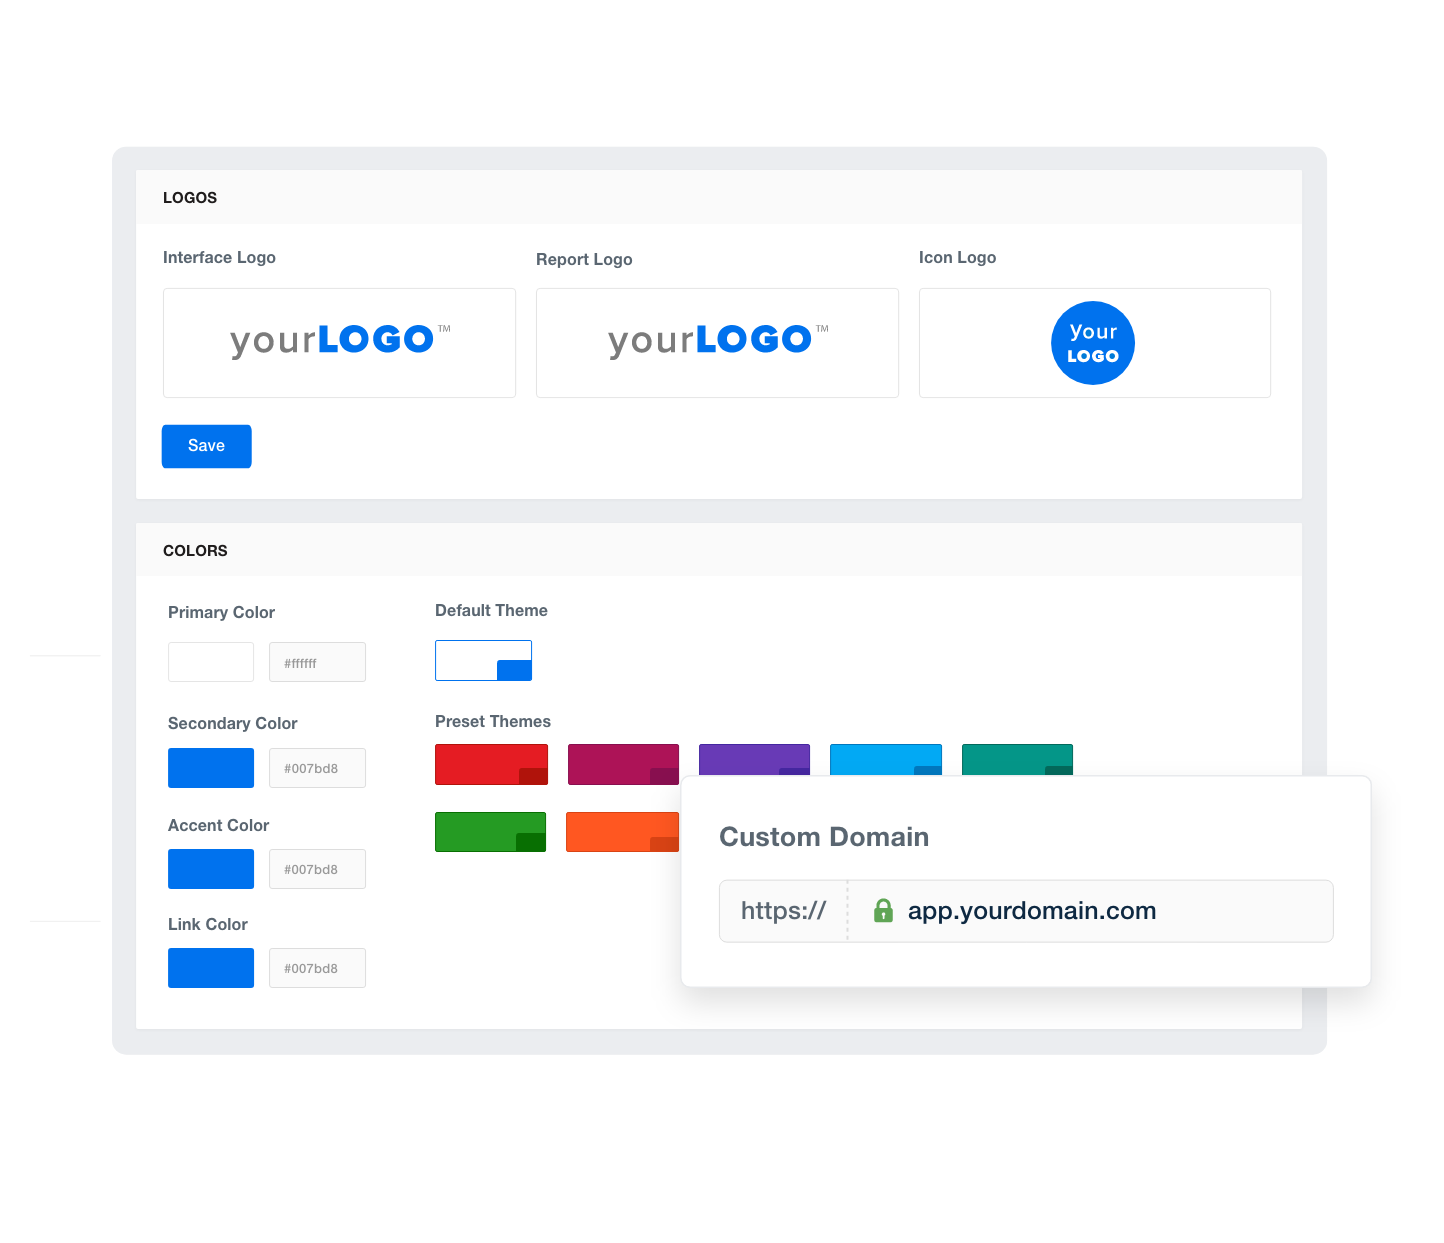
Build client trust with white-labeled reports. Personalized dashboards showcase your expertise and commitment to each client's success.
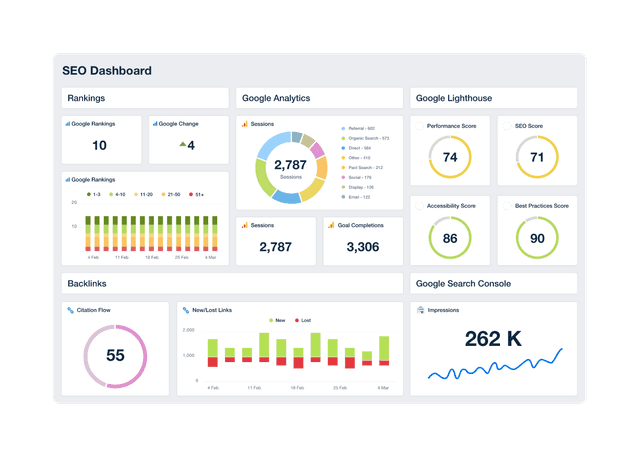
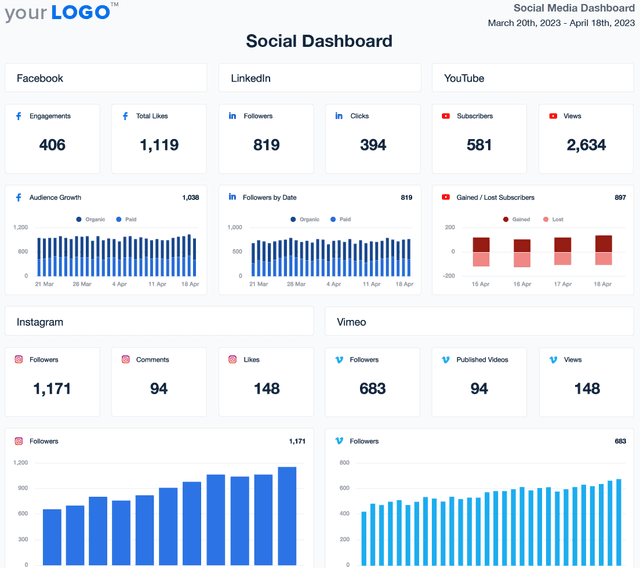
Pull Google Analytics data into a comprehensive reporting suite and create a bespoke SEO Dashboard, Social Media Dashboard, or Digital Marketing Dashboard that meets your client's needs.
Strengthen relationships and win more business.
Create Custom Metrics for Comprehensive Insights
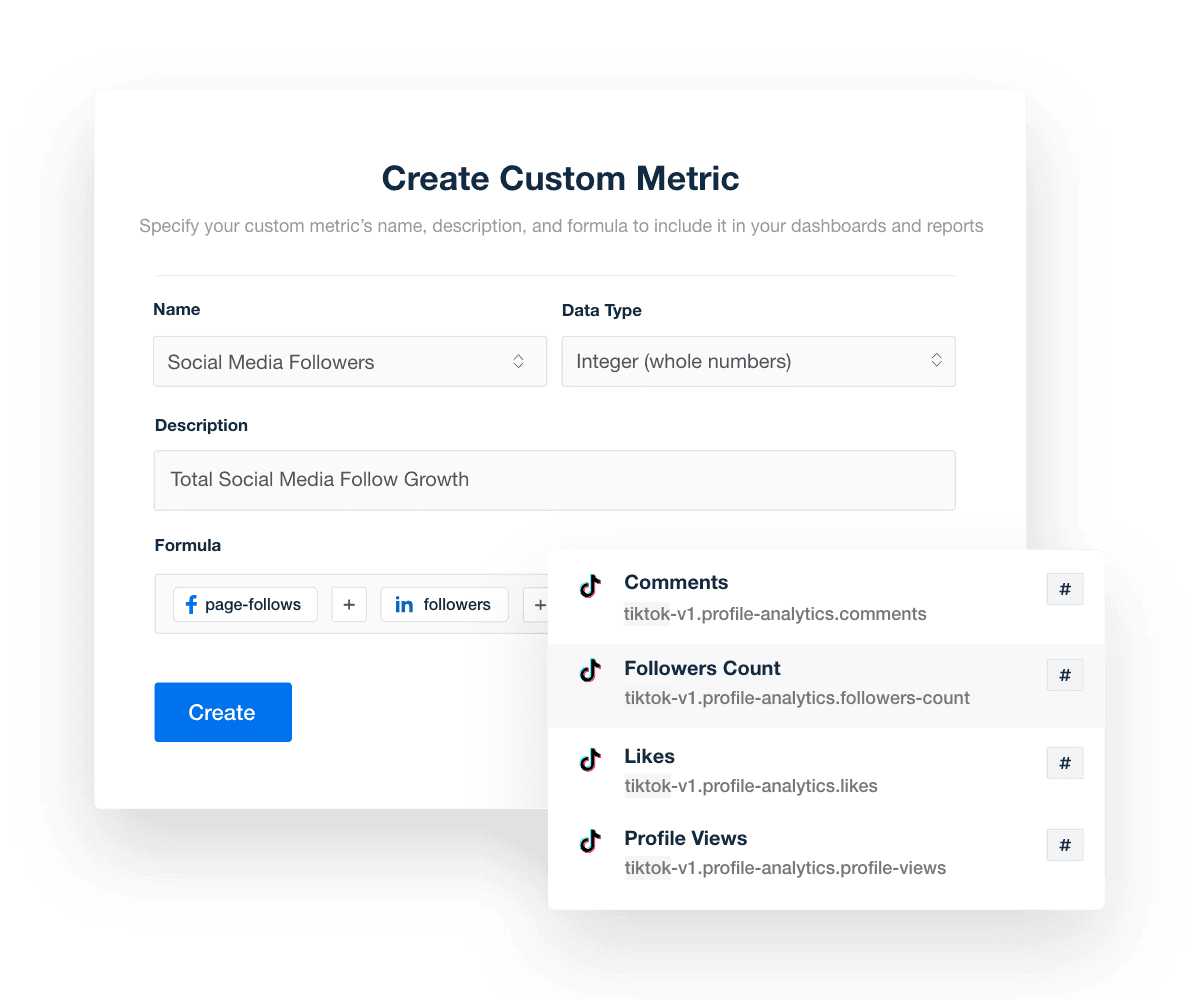
Create custom metrics by combining data points from all of the available integrations to offer the most in-depth client reporting possible.
Custom-blended metrics deliver a clearer picture of campaign performance, helping you make data-driven decisions and demonstrate the full value of your agency's expertise and efforts.
Monitor All of Your Clients at a Glance
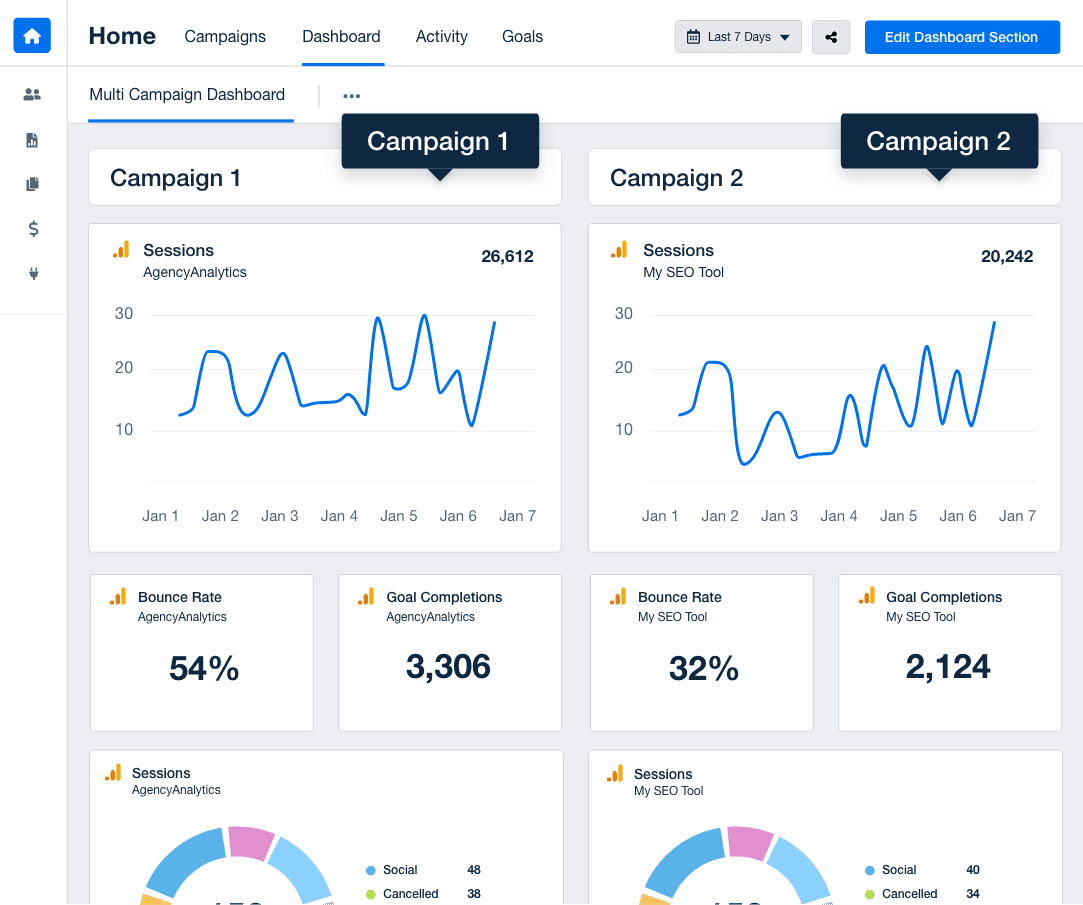
Custom dashboards at the agency level bring together crucial metrics and data for multiple clients in one place.
This centralized approach streamlines monitoring and reporting, saving time and reducing complexity.
Customer Support is Our Top Priority
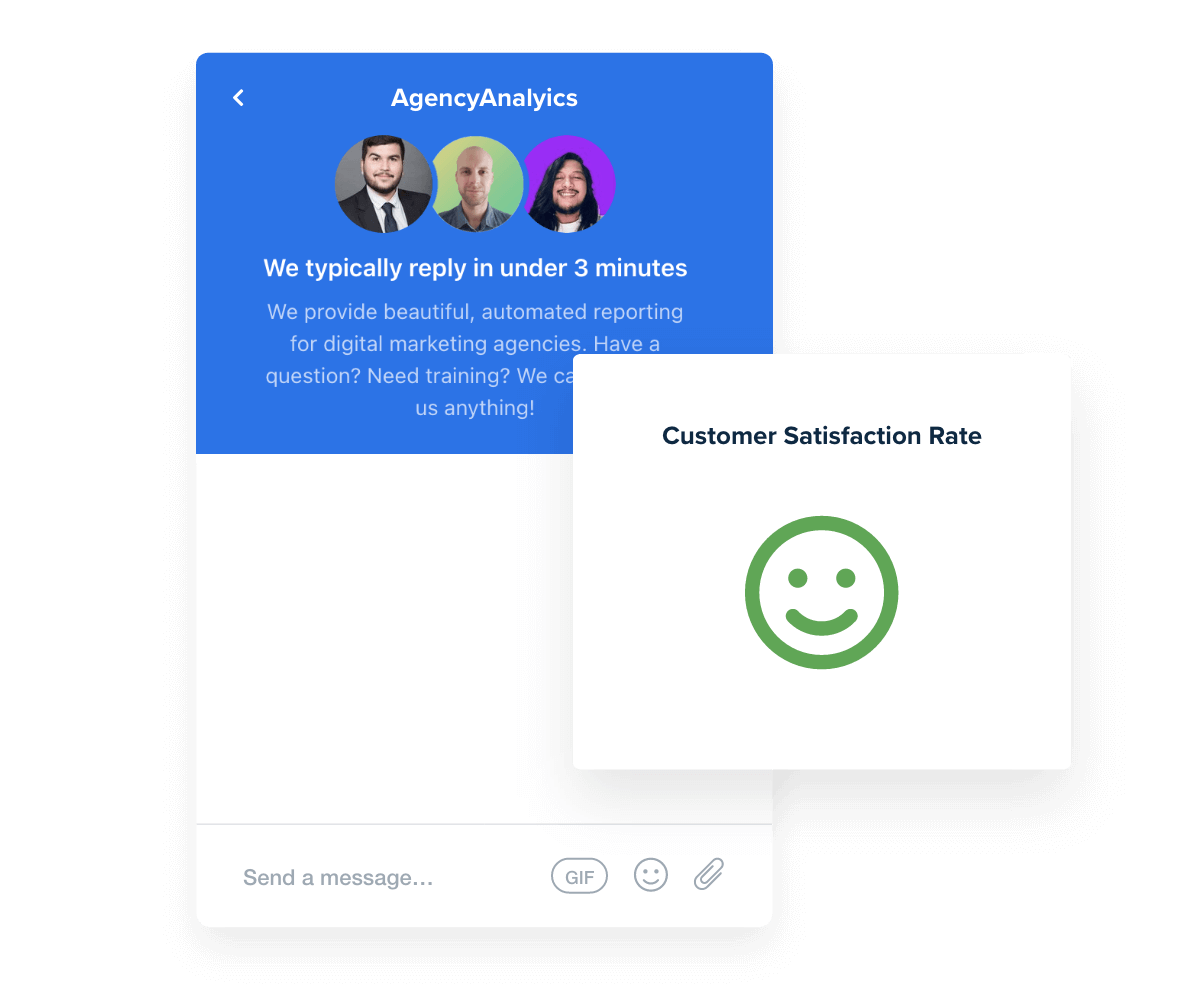
Your agency's needs come first with round-the-clock support. Our live chat is available 24/5, with response times under 3 minutes.
With a satisfaction rate over 95%, our team is here to help you create the perfect Google Analytics dashboards that reflect your agency’s top-notch services.
You care about your client’s success. We care about yours.
Report Smarter. Not Harder.
Save time each month by automatically including essential Google Analytics data alongside metrics from over 80 other sources in one platform.
Integrate key metrics from Google Analytics, Facebook, keyword rankings, Google Ads, and more to provide clients with a comprehensive view of their marketing success.
Customize each Google Analytics dashboard or quickly clone an existing dashboard to streamline client onboarding.