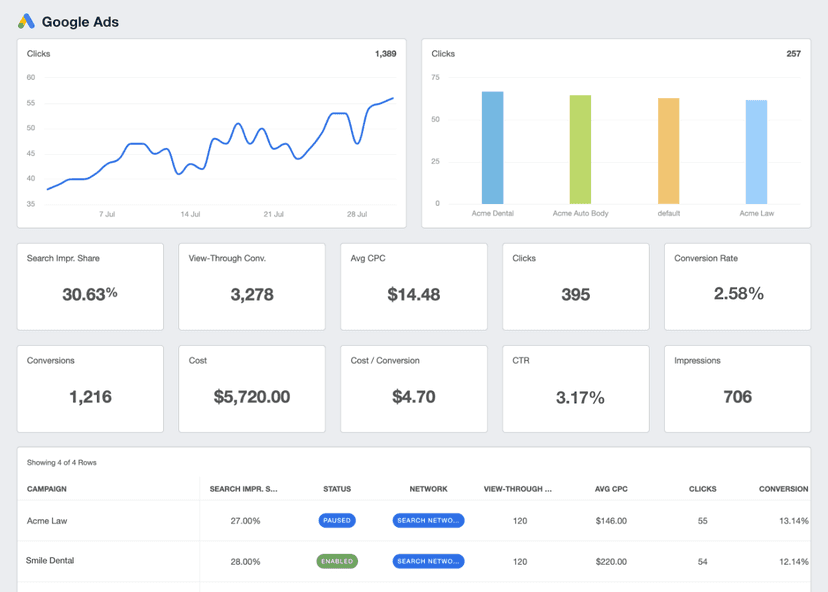
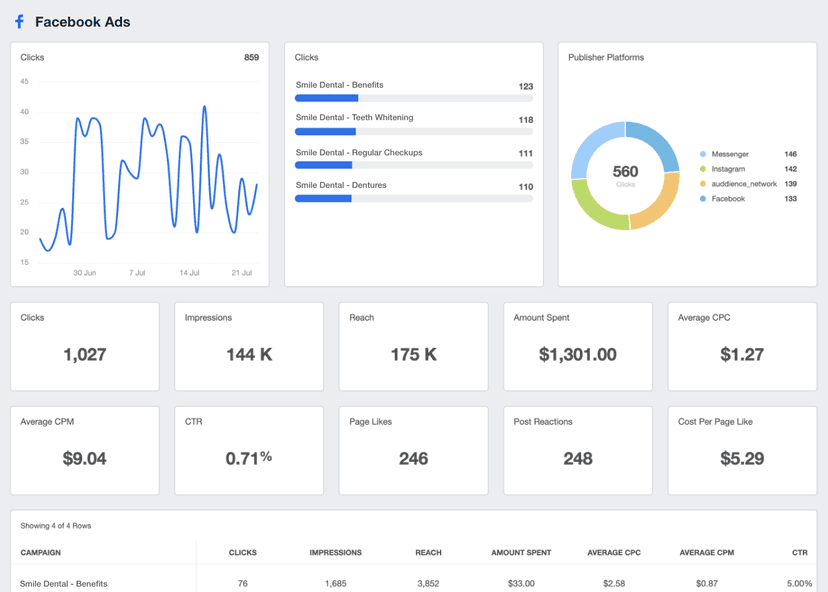
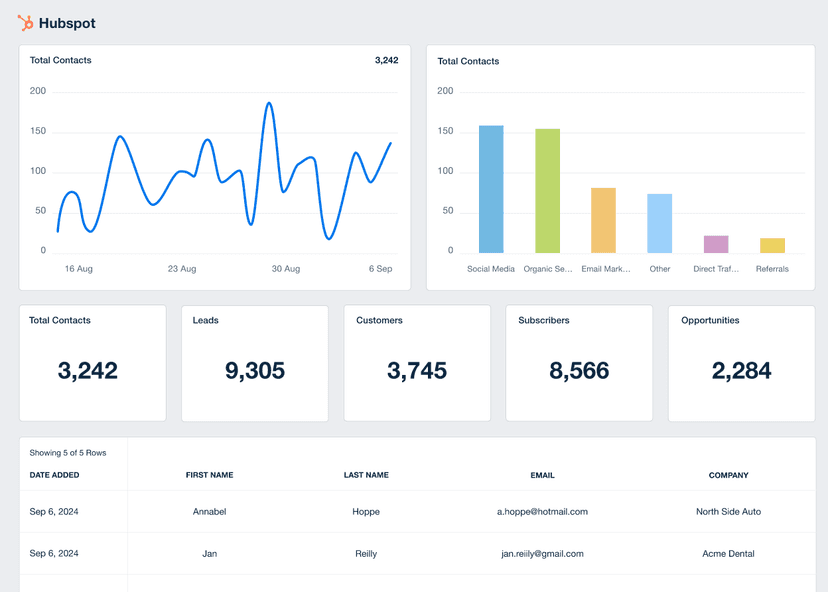
Conversion Rate
Channel Evaluation
Compare across different platforms to pinpoint the most effective ones for achieving marketing goals.
Budget Utilization
A higher Conversion Rate generally means more effective use of the marketing budget, boosting ROI.
Real-Time Monitoring
Monitor in real-time to get immediate feedback and make rapid strategy changes.
Testing and Optimization
A/B testing helps fine-tune different campaign elements, incrementally improving Conversion Rates through conversion optimization.
Why Conversion Rate Is a Non-Negotiable KPI
Conversion Rate serves as a direct indicator of success because it answers a fundamental question: are marketing tactics effectively converting leads or persuading website visitors to take a specific action? Attracting the right customers leads to improved sales efficiency and better ROI. Agencies effortlessly measure Conversion Rate against targets and use this data to evaluate campaign performance against past historical performance, understand user behavior, and allocate resources more efficiently.
When pitching to clients or evaluating existing campaigns, focusing on Conversion Rate provides a straightforward way to showcase value. A high Conversion Rate often correlates with a strong sales funnel, satisfied clients, streamlined user experience, and ultimately, a healthier bottom line.
Stop Wasting Time on Manual Reports... Get Insights Faster With AgencyAnalytics
How Conversion Rate Interacts With Other KPIs
In the context of a marketing campaign, conversion tracking is important, but it’s not the whole story. For instance, high website traffic is fantastic, but if the Conversion Rate is low, it suggests that quantity isn't translating into quality. The same applies to lead generation, a significant influx of qualified leads is great, but it means very little if they don't convert into new customers.
Agencies use metrics like Click-Through Rate (CTR), Win Rate, and Customer Lifetime Value (CLV) to shed additional light on the Conversion Rate. While CTR reveals how effective a campaign is at steering potential customers to a landing page, CLV shows the long-term value those converted customers bring, and Win Rate highlights how well the sales team converts leads into sales. Essentially, Conversion Rate provides a holistic view of campaign effectiveness.
Sales Conversion Rate vs. Website Conversion Rate
Sales Conversion Rate and Website Conversion Rate, though similar in concept, cater to different aspects of business performance. Sales Conversion Rate primarily concerns brick-and-mortar stores or direct sales environments. It’s a measure used by sales managers to gauge the effectiveness of sales strategies and interactions. Conversion rate is measured by taking the number of conversions divided by the total size of the audience.
In contrast, Website Conversion Rate applies to online transactions, and are not always limited to sales. Although ecommerce conversions typically focus on sales, the broader category of website conversions includes purchases, leads, shopping cart additions, downloads, or various other actions. This data is essential for assessing the success of marketing campaigns and website user experiences and is a vital metric for understanding how effectively a website is converting browsers into buyers, one step at a time.
After defining the goals and objectives with our client, we identify the key metrics for the campaign. We typically look at CTR, conversion rate, cost per conversion, and ROAS after a match-back process. We also take a look at the lifetime value of a customer to show the efficacy of long-term ROI. We compare these stats over time and chart out the progress using graphs. This also highlights our efforts in the continued optimization of the campaigns.
How To Calculate Conversion Rate
Knowing how to accurately calculate Conversion Rate is essential. Improving conversion rates can lead to more sales without increasing advertising spend. It’s the hard number that gives insights into soft skills like persuasion and influence. For website or ecommerce conversion rates, simply divide the number of completed desired actions (like purchases or form submissions) by the total number of visitors, then multiply by 100 to get a percentage.
Think of it this way: if a website gets 1,000 visits and 20 people make a purchase, then the Conversion Rate would be (20/1000) * 100, or 2%. This number guides adjustments to digital marketing strategies, aiming to improve results over time.
Taking a similar approach to calculate sales conversion rate, compare the number of successful sales against the total number of sales interactions or leads.
Website Conversion Rate Formula Example
What Is a Good Conversion Rate?
A good average Conversion Rate typically hovers between 2% to 5%. In this range, marketing strategies are often effective, and the user experience is probably aligned with the target audience's expectations. Agencies seeing numbers like these feel confident in their tactics and easily communicate this success to clients.
What Is a Bad Conversion Rate?
Anything below a 1% Conversion Rate is generally considered poor and calls for immediate attention. This could signify issues like poor website design, ineffective call-to-actions, or simply targeting the wrong audience. It's a wake-up call for agencies to scrutinize their strategies.
How To Set Conversion Rate Benchmarks
If industry benchmarks seem elusive, agencies typically establish their own benchmarks based on historical data or competitor analysis. Track Conversion Rate over time, paying attention to any changes correlated with adjustments to marketing strategies or website features. These internal metrics become valuable indicators, serving as tailored benchmarks for evaluating future campaigns.
To go beyond the surface, consider segmenting Conversion Rate by variables such as traffic sources, devices, content type, or demographic factors. This segmentation offers granular insights and highlights specific areas that may need optimization. By slicing and dicing the data, it’s easier to spot trends or anomalies that a simple average might overlook. For example, the Conversion Rate on a product details page should typically be much higher than a blog post. Additionally, measuring organic search conversion rates can be done using blog articles read divided by search traffic.
Average Conversion Rate by Platform
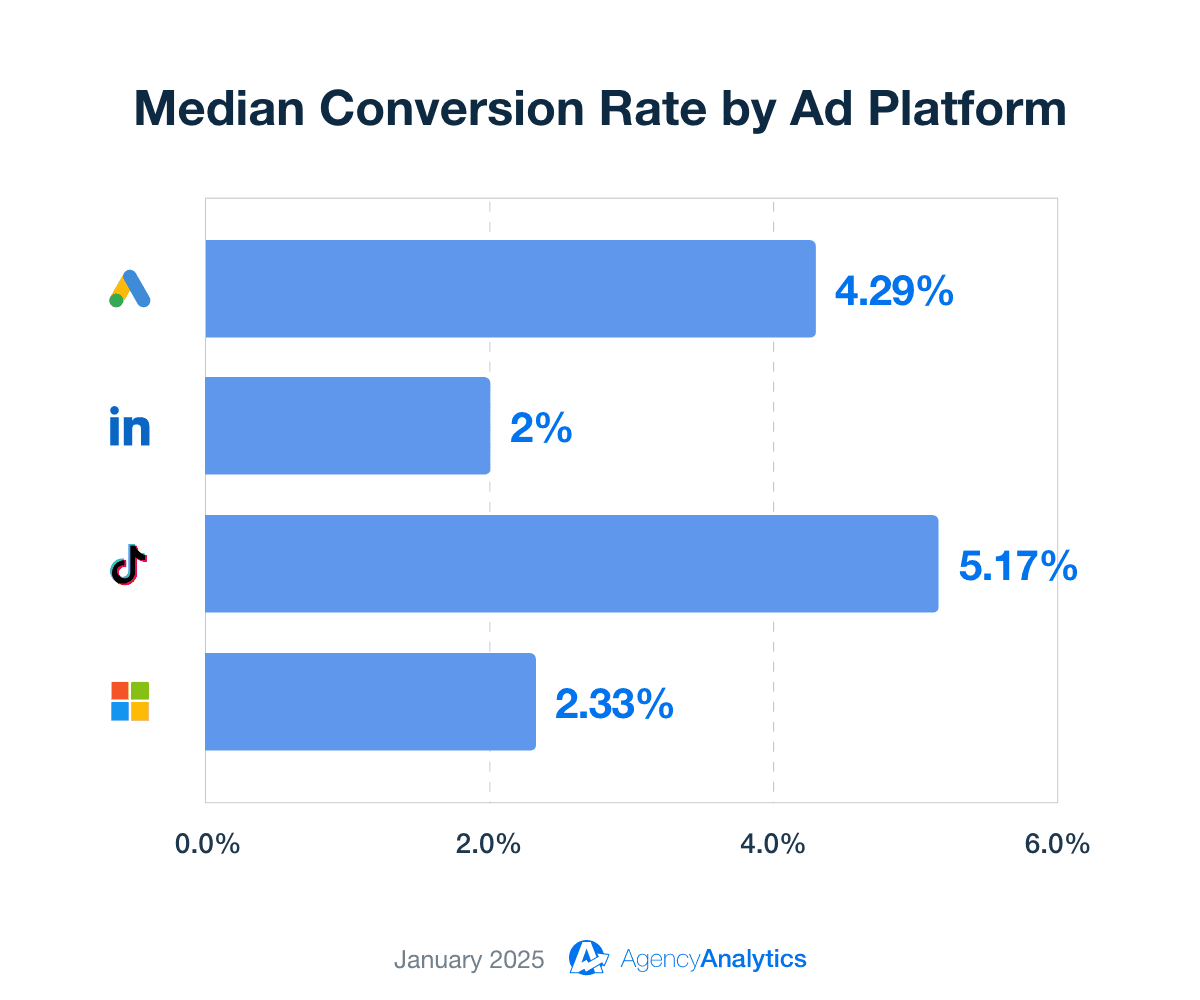
Curious about how your client’s ad campaigns compare to others? Based on data across {{campaign-count}}+ on the AgencyAnalytics platform, we’ve found that the median conversion rate ranges from 2% for LinkedIn Ads, all the way to 5.17% for TikTok Ads. This reflects conversion rates across all client industries, meaning there may be variations across campaigns or niches.
Take Google Ads, for example. The Apparel & Fashion industry has a median conversion rate of 1.91%. On the other hand, Storage & Moving services have a noticeably higher conversion rate of 7.89%.
Want to explore these insights further? Check out the Marketing Performance Insights suite in AgencyAnalytics by signing up for a free 14-day trial today.
Why Conversion Rate Matters to Clients
From a client's vantage point, Conversion Rate is the direct path to revenue. It measures the ability of the marketing strategies to do what they're supposed to—convert interested visitors into paying customers. A high Conversion Rate often translates into a robust ROI, making it a metric that directly affects the bottom line.

Why Conversion Rate Matters to Agencies
Agencies use this KPI to prove their worth, demonstrating they're not just bringing eyeballs to a website but also persuading those visitors to take action. A consistently high Conversion Rate indicates that an agency knows its craft. It's a talking point in client meetings, and even a slight uptick is a strong selling point for securing more contracts.

Best Practices for Analyzing & Reporting on Conversion Rate to Clients
A deep dive into Conversion Rate analytics sets the groundwork for more impactful advertising endeavors. It helps refine tactics, directing efforts and budget towards what genuinely works.
Analyze Conversion Rate Over Time
Monitoring Conversion Rate longitudinally offers valuable insights into the effectiveness of ongoing adjustments. A steady rise indicates success, while a sudden drop might signify an underlying issue needing immediate attention.
Review Conversion Rate Across Platforms
Looking at Conversion Rate by channel to pinpoint where the marketing strategy shines or stumbles. Knowing whether a social network or email campaign excels allows for budget allocation that maximizes ROI.
Focus on Conversion Rate Across Campaigns
By breaking down the Conversion Rate across different campaigns, it's easier to see which messages resonate most with the target audience. This granular analysis informs future campaign planning.
Put Conversion Rate in Context
Pair Conversion Rate with other KPIs like Cost Per Acquisition, Lifetime Value, and Click-Through Rate. This practice ensures that the client grasps the full picture, helping them understand how these variables work in tandem to affect their bottom line.
Visualize Conversion Rate
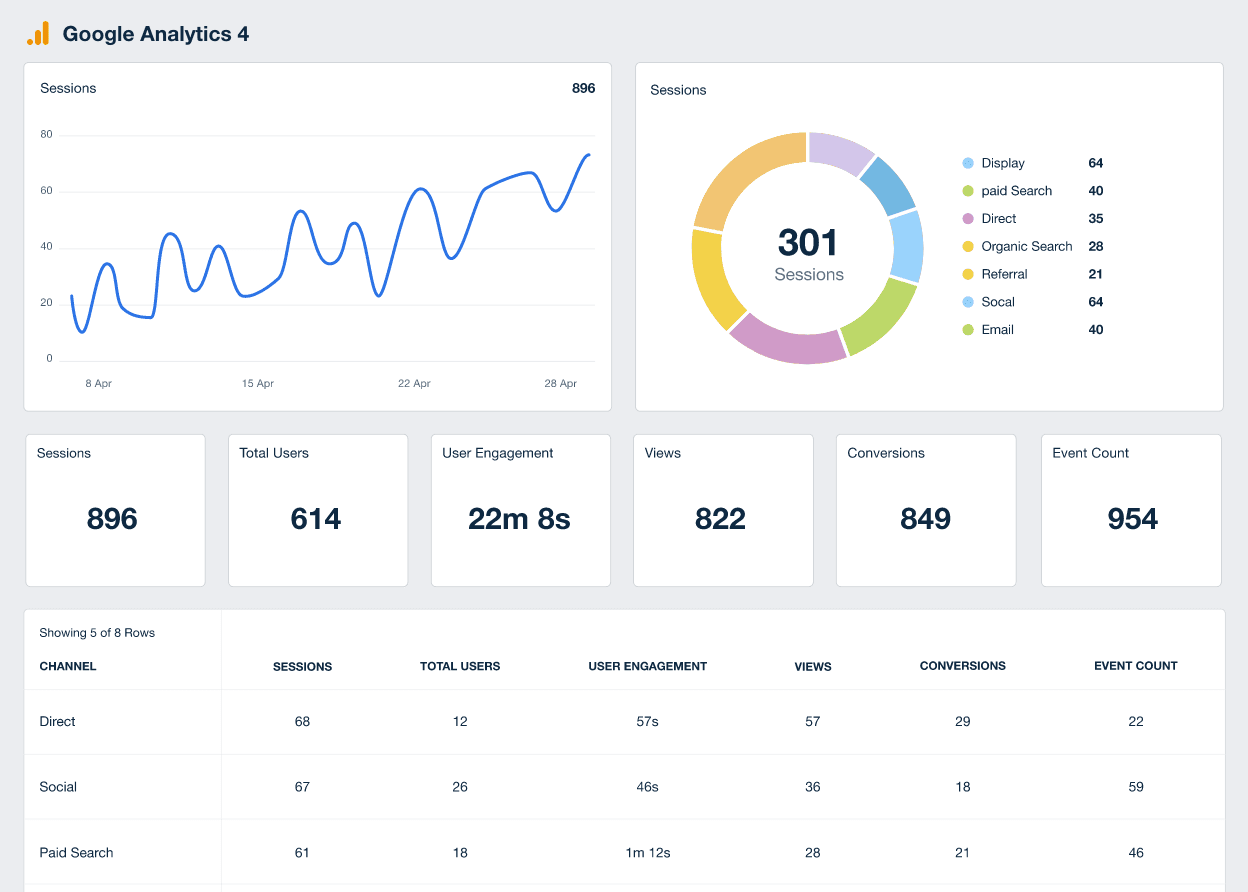
A well-designed dashboard that includes visual elements makes Conversion Rate insights accessible even to clients who aren't data savvy and allows agencies to make smarter, data-backed decisions.
Link Conversion Rate to Client Goals
A tailored report should correlate Conversion Rate with specific client goals, using real data to forecast future performance. This sort of correlation offers the client a more comprehensive view, aiding in resource allocation and future planning.
Google Analytics 4 Dashboard Example
Related Integrations
How To Drive Conversion Rate Optimization
Ready to boost conversions and ramp up leads and sales? Here are some Conversion Rate optimization tips to drive more conversions and better outcomes.
Customize Content
Personalized content doesn’t just engage; it converts. Segment audiences and adjust your CTAs accordingly.
Optimize Landing Pages
Use A/B tests to refine landing pages on desktop and mobile devices. Each element should guide visitors toward the conversion goal, be it signing up or making a purchase.
Refine Audience Targeting
Use data to identify key demographics and behaviors, then adjust the campaign to target these specific groups.
Related Blog Posts
See how 7,000+ marketing agencies help clients win
Free 14-day trial. No credit card required.


