Average Order Value (AOV)
Target High-Spenders
Identify high-value customer segments to improve campaign ROI.
Client Reports
An increase in AOV indicates successful strategies and higher-quality sales.
Bundle Strategy
Promote product bundles that encourage higher spending.
Price Adjustments
Review AOV to decide if pricing strategies need modification.
Why Average Order Value Matters
Think of AOV as an eCommerce store's pulse. When it's robust, an eCommerce store is healthy, and the marketing efforts are paying off. The beauty of AOV is its simplicity: a single figure reveals not only the effectiveness of sales strategies but also consumers' preferences.
Having a high AOV is like hitting two birds with one stone. It shows you're driving quality sales, which leads to better revenue. Plus, it achieves this without requiring more traffic or an improved conversion rate. Essentially, it amplifies revenue potential for online businesses by simply making the average value of existing transactions more profitable.
A rising AOV isn't just good news in client-agency relationships—it's an indisputable win. When this metric goes up, it serves as definitive evidence that the marketing strategy is effective. This boosts confidence in current tactics and strengthens the agency's position when negotiating contracts and budget allocations.

Stop Wasting Time on Manual Reports... Get Ecommerce Insights Faster With AgencyAnalytics
Average Order Value and Its Relationship With Other Metrics
Average Order Value, traffic, and conversion rate form the Marketing Metrics Power Triangle. These three metrics provide a comprehensive view of campaign performance. High traffic but low AOV? Time to promote higher-value items. High AOV but low traffic? Focus on attracting more visitors.
The link between Average Order Value and conversion rate is also critical. Incentives to boost average spending often lead to higher conversion rates. Monitoring these three metrics simultaneously ensures cohesive and effective marketing strategies.
A balanced focus on Average Order Value, traffic, and conversion rate drives optimal results.

KPIs are important to clients because they want to understand how much they are spending, what they are spending it on and most importantly, what is the return on their spend. They also want to be able to measure the progress of the marketing campaigns month over month.
How To Calculate AOV
Calculating Average Order Value is straightforward but crucial for business insights. To calculate Average Order Value, divide the total revenue generated during a specific period by the total number of orders in that period. This calculation provides a snapshot of how much customers are spending per transaction.
AOV Formula Example
What is a Good AOV?
A good Average Order Value is one that exceeds the median figure for the industry or niche. If the AOV shows consistent growth or stays above the industry standard, it's usually a sign that marketing efforts are paying off in driving more profitable sales.
What is a Bad AOV?
A bad Average Order Value lags behind industry standards or shows a downward trend over time. This could indicate missed opportunities in upselling or cross-selling and might necessitate a review of pricing strategies and promotional offers.
Setting AOV Benchmarks and Goals
If standard benchmarks are elusive, agencies often compare AOV to historical data or peer performance. This method helps to identify what an achievable and healthy Average Order Value looks like for that specific business context. Using historical trends and competitive analysis, agencies set realistic and tailored AOV goals.
Why Average Order Value Matters to Clients
Average Order Value is a robust metric that directly impacts revenue. For clients, Average Order Value is a direct measure of customer spending, pointing to the success of upselling and cross-selling efforts. A rising AOV signals a growing revenue stream without increased acquisition costs, maximizing their ROI.
Encouraging existing customers to spend more is a straightforward way to increase sales and the company's average order amount.

Why Average Order Value Matters to Agencies
For agencies, Average Order Value is a starting point for optimizing other metrics. A growing AOV gives agencies the latitude to set more aggressive cost-per-acquisition targets.
This, in turn, opens the door to a broader range of marketing and pricing strategies, including scaling up paid advertising or doubling down on conversion rate optimization.
A high AOV affirms the agency's ability to create strategies that not only drive sales but also increase the value of those sales.

Better, Faster & Easier Client Reports Are Just a Few Clicks Away
How To Analyze & Optimize Average Order Value
Analyzing Average Order Value from multiple angles helps to understand customer behavior and refine advertising strategies, making them more effective and cost-efficient. When reporting Average Order Value, clarity and context are paramount. Agencies need to communicate this KPI in a manner that's insightful yet easy to grasp.
Analyze Average Order Value Over Time
Look at how AOV fluctuates over weeks, months, or seasons. This data helps inform when to run promotions, create a customer loyalty program, or introduce higher-value products to maintain revenue stability.
Compare Average Order Value Across Channels
Review AOV by channels, such as email, social media, or PPC. This pinpoints which channels generate higher-value sales and deserve more of the marketing budget.
Measure Average Order Value Across Campaigns
Compare AOV among different marketing campaigns. Is AOV higher in a holiday promotion than in a clearance sale? Such insights guide future campaign planning.
Put Average Order Value in Context
Highlighting AOV alone doesn't paint the full picture. Always include it alongside other key metrics like conversion rate and traffic to show how it contributes to the overall marketing strategy.
Visualize Average Order Value Performance
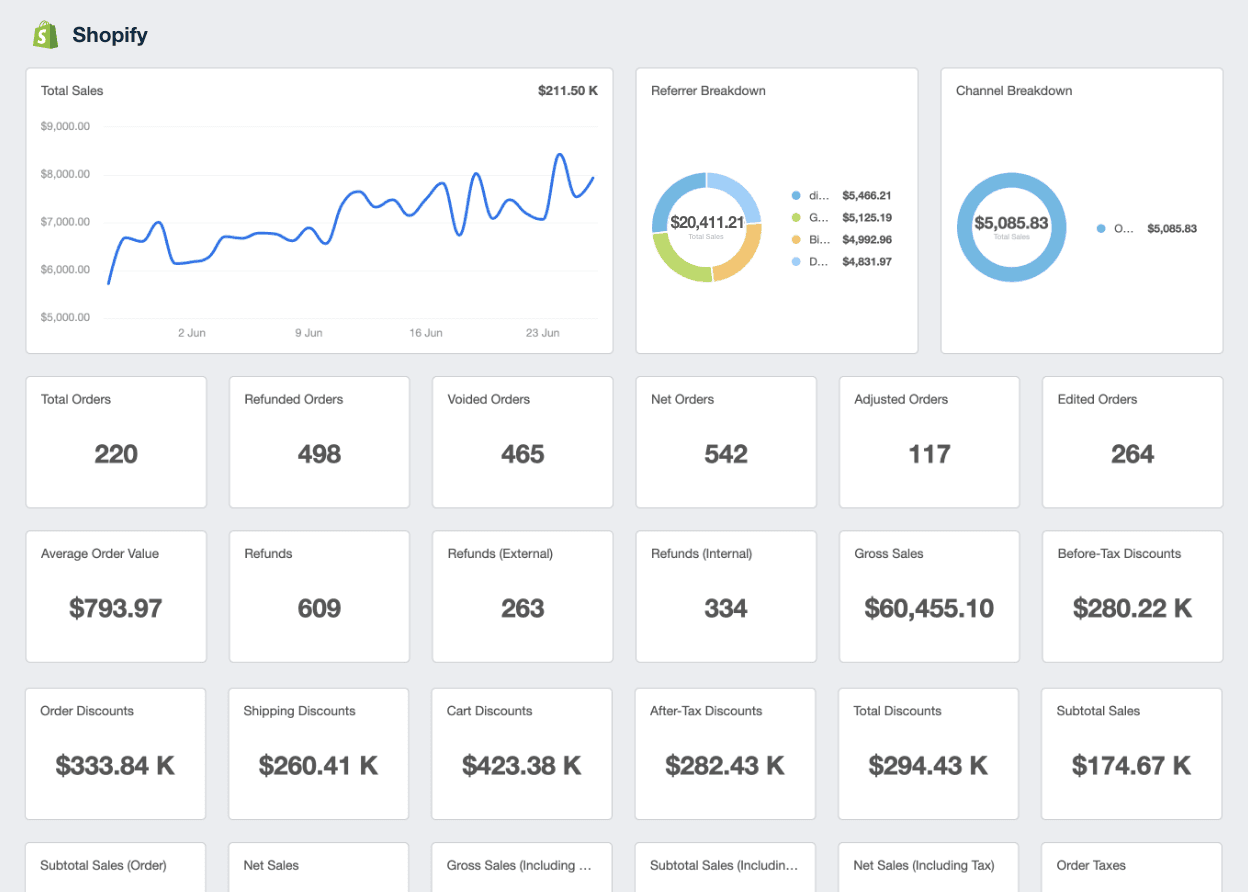
Graphs and charts make the data digestible at a glance. Visual aids help to instantly convey trends, facilitating quick decisions and strategy adjustments.
Align Average Order Value to Client Goals
Map out how AOV aligns with the client's broader business goals, whether it's increasing profitability or boosting customer loyalty. This makes the metric more relatable and actionable for the client.
Shopify Dashboard Example
Related Integrations
How To Improve AOV
Improving Average Order Value doesn't just happen; it requires a thoughtful planning and pricing strategy. Whether an agency is working to increase client profits or a brand is aiming for higher revenue, these actionable tips help impact Average Order Value.
Strategic Cross-Selling
Utilize customer data to present related products that make sense. Cross-selling is more than just a sales tactic; it's a way to add genuine value to the customer experience, hence encouraging a larger order.
Free Shipping Threshold
Introduce a free shipping threshold slightly above the current AOV. This nudges customers to add more to their cart. It's the classic minimum purchase to offset the shipping costs tactic, and it works like a charm.
Bundle Products
Offering product bundles or volume discounts increases the perceived value for the customer. Bundles encourage customers to buy more at once, effectively driving a higher average order value.
Related Blog Posts
See how 7,000+ marketing agencies help clients win
Free 14-day trial. No credit card required.


