Table of Contents
Table of Contents
- Why eCommerce KPIs Are Important
- Understanding the Basics: Ecommerce KPIs 101
- Going Deeper: Advanced Ecommerce KPIs
- Drilling Down: Segmenting Ecommerce KPIs by Acquisition Channel
- Acquisition Key Performance Indicators: The Engines of eCommerce Growth
- Interpreting eCommerce KPIs: Decoding the eCommerce Enigma
- Reporting and Communicating eCommerce KPIs
- Summary & Key Takeaways
7,000+ agencies have ditched manual reports. You can too.
Free 14-Day TrialQUICK SUMMARY:
eCommerce KPIs are crucial metrics for evaluating the performance of online businesses. They offer insights into the effectiveness of different aspects, like conversion rates, which indicate how efficiently a site converts visitors into customers. Monitoring these KPIs helps identify areas needing improvement, such as checkout processes or website design. This guide illuminates how eCommerce KPIs inform client campaign success, enabling growth and client satisfaction.
Welcome to the complex yet rewarding landscape of eCommerce KPIs. For digital marketers, mastering these key performance indicators provides the backbone to a compelling narrative of growth and success for your clients.
Think of your client's eCommerce businesses as a puzzle. Each piece represents a unique component of their strategy. Key performance indicators, or KPIs, help put these pieces together and visualize the bigger picture.
But remember, not all eCommerce metrics are created equal. Ecommerce key performance indicators are the critical pieces that genuinely shape the overall image of success. These eCommerce metrics don't just scratch the surface; they dig deep, providing valuable insights into user behavior, customer retention, and conversion rates.
Understanding and leveraging key performance indicators transform your approach to eCommerce store optimization and propel your clients toward sustained success.
Welcome to your journey through eCommerce KPIs. Let's get started.
Why eCommerce KPIs Are Important
Before we dive into eCommerce-specific KPIs, let's start with a clear definition of a KPI. A Key Performance Indicator (KPI) is a measurable value that indicates how effectively an organization is achieving key business objectives.
eCommerce KPIs are the heartbeat of a successful online business. They're the data-driven insights that tell us if an eCommerce business is thriving or needs a tune-up.
Let's take conversion rate, for instance. It's an essential metric that reveals how well an eCommerce site turns browsers into buyers. If the conversion rate starts to drop, it's a clear signal something needs adjusting. It could be the checkout process, product descriptions, or the site's design.
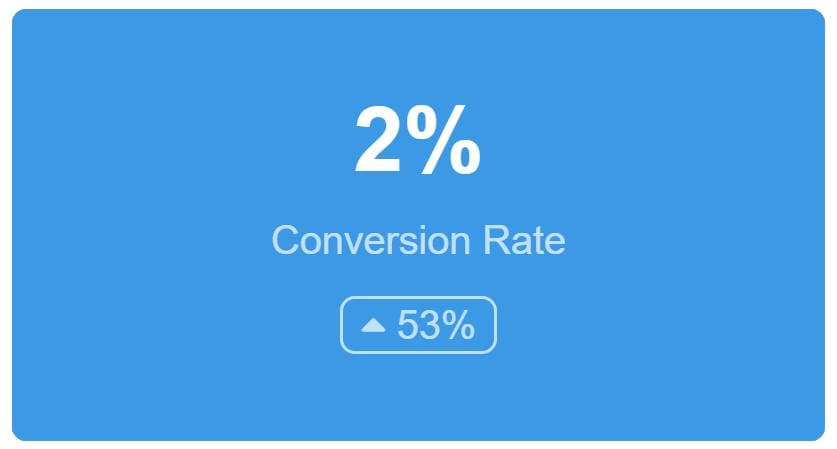
Monitoring this KPI lets us spot problems early and adapt quickly.
Consider another scenario: a website sees lots of traffic, but sales are flat. The disconnect here could be a symptom of a high bounce rate. Or, the homepage might attract visitors, but once they reach the product pages, they exit the site. Tracking the bounce rate and exit pages helps identify this problem and make necessary changes.
In general, KPIs provide the data needed to drive success for clients' eCommerce businesses, becoming a guiding light as we move forward in our eCommerce journey.
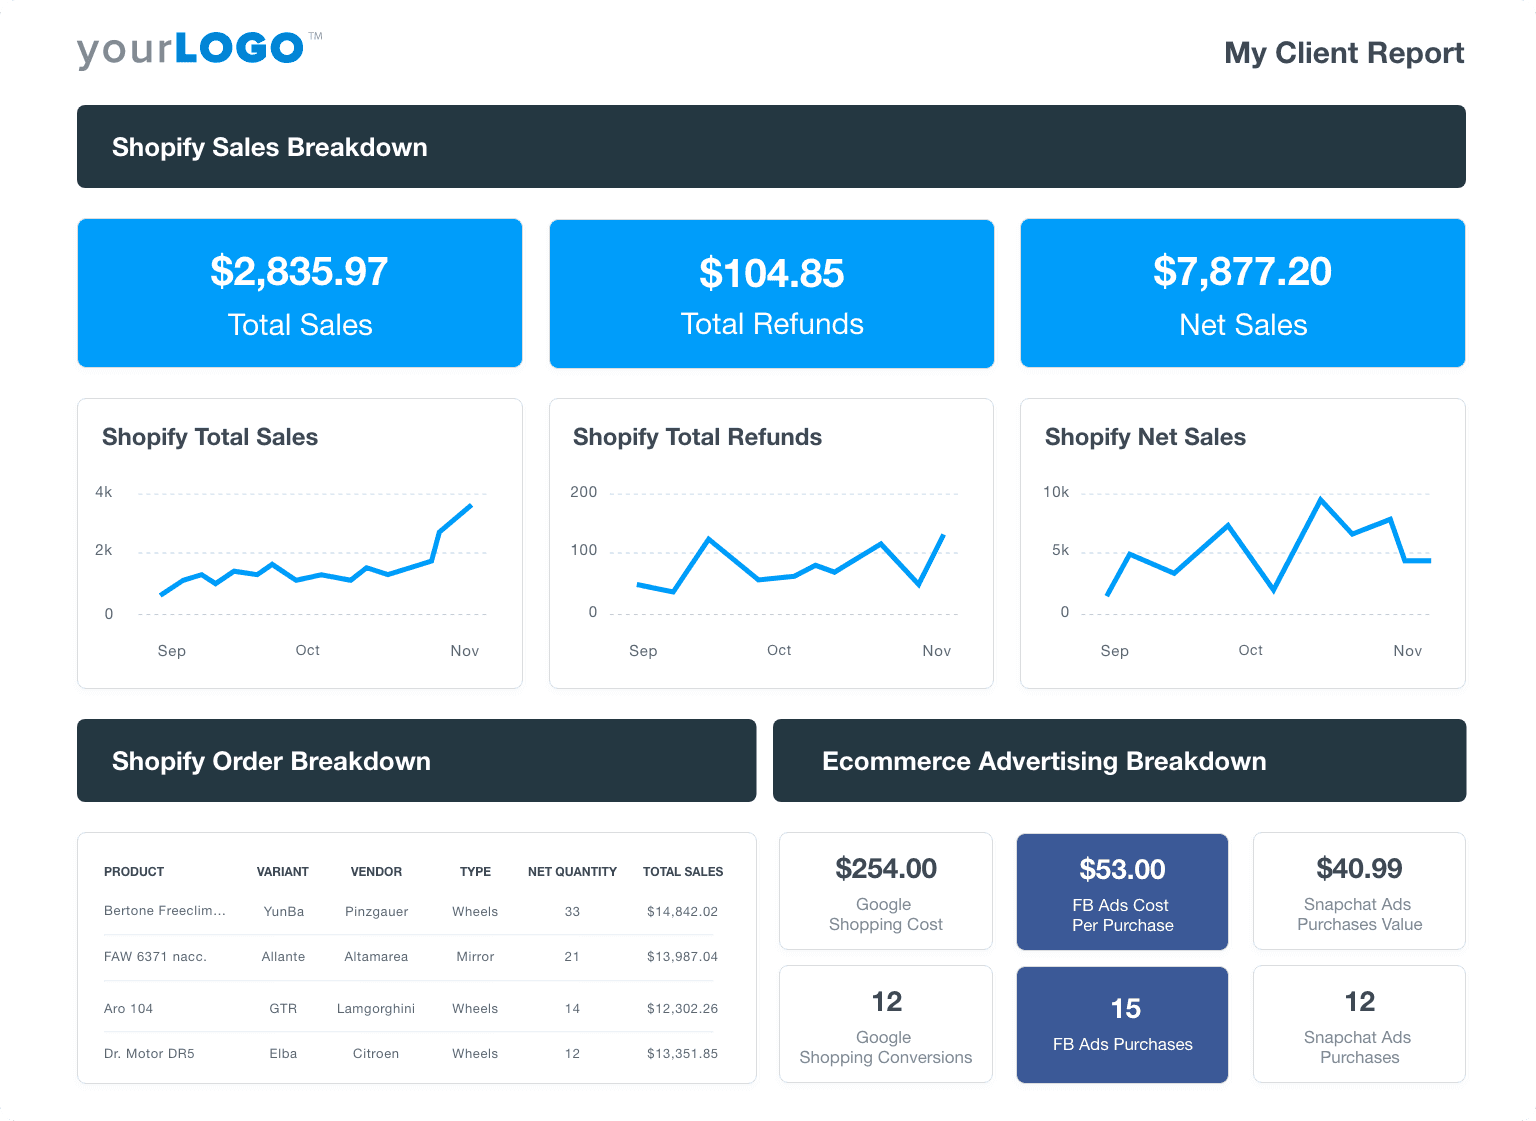
Streamline client reporting with a customizable and cloneable eCommerce dashboard or a professional eCommerce report template built for marketing agencies.
Understanding the Basics: Ecommerce KPIs 101
If digital marketing were a language, then eCommerce KPIs would be its alphabet. These metrics form the building blocks of understanding and improving any eCommerce business. Whether dipping your toes into the ocean of eCommerce metrics or brushing up on the fundamentals, getting a firm grasp on the basics is crucial. Here's the lowdown on the essential eCommerce KPIs to track that every digital marketer should be fluent in.
Website Traffic
Website traffic for online retailers is akin to foot traffic for a brick-and-mortar store. It counts the number of visitors landing on an eCommerce site. This metric can be broken down further into total visits, unique visits, and traffic sources, helping to gauge the effectiveness of SEO efforts and paid campaigns.
Engagement vs. Bounce Rate
Engagement metrics such as session duration and page views per visit tell you how well the content resonates with visitors. On the flip side, the bounce rate in Google Analytics 4 indicates the percentage of visitors who leave your site without engaging with the content provided. A high bounce rate might signal issues with a site's user experience or relevancy to the visitor.
Session Duration
Session Duration is a goldmine of user engagement insights. Average session duration measures the user's time on the site during a single visit. High session durations indicate engaging content and a user-friendly interface, while low durations signal that it's time for a website revamp. When monitored alongside other KPIs, session duration can provide valuable context, helping to paint a fuller picture of user behavior.
Add to Cart Rate
This is the percentage of site visitors who add at least one product to their shopping cart during their visit. It's an essential indicator of initial buying intent, helping to assess the attractiveness of product offerings and the effectiveness of product listings.
Cart Abandonment Rate
Cart Abandonment Rate measures the percentage of shoppers who add items to their cart but leave without completing a purchase. It's like finding abandoned shopping carts in the aisles of a physical store. A high rate could indicate issues with the checkout process, shipping costs, or pricing transparency.
Conversion Rate
The conversion rate reflects the percentage of visitors who make a purchase. This quintessential eCommerce KPI offers direct insight into the effectiveness of eCommerce websites and marketing strategies in turning visitors into paying customers.
Average Order Value
Average Order Value (AOV) is the average dollar amount spent each time a customer places an order. It's a key metric in understanding buying behavior and can inform pricing, upselling, and cross-selling strategies.
Customer Lifetime Value
Customer Lifetime Value (CLV) is the projected revenue a single customer will generate over the lifespan of their relationship with your business. CLV helps shape retention strategies and inform budget allocation by identifying high-value new customers.
Revenue
The most straightforward KPI, revenue, is an eCommerce store's total income before deducting any costs. How much revenue an eCommerce store generates is a high-level indicator of business performance and an essential barometer of growth.
Customer Acquisition Cost
Customer Acquisition Cost (CAC) is the total cost incurred to acquire a new customer, including marketing, advertising, and other related expenses. It's a critical profitability metric that is crucial in budgeting and marketing strategy.
Return on Ad Spend
Return on Ad Spend (ROAS) measures the revenue generated for every dollar spent on advertising. It's one of the key SEM performance metrics, a potent gauge of ad campaign effectiveness and can steer decisions about ad spend allocation.
Return on Investment
Lastly, Return on Investment (ROI) is a universal measure of profitability. In the eCommerce context, it considers the return on all investments made in the business, including technology, marketing, and the cost of goods sold. A positive ROI means that investments are paying off, while a negative ROI suggests a need for strategy reassessment.

Going Deeper: Advanced Ecommerce KPIs
For those who've mastered the basics and are ready to dive deeper into eCommerce KPIs, you're in for a treat. These advanced metrics are the secret weapons of seasoned digital marketers, offering nuanced insights that help refine strategies and optimize eCommerce growth. Here are some more advanced KPIs that take you deeper into the art and science of eCommerce marketing.
Customer Retention Rate
Customer Retention Rate (CRR) measures the ability to keep customers coming back. It's the percentage of customers making more than one purchase over a specified period. A high CRR is a sign of customer loyalty and often results from excellent customer service and high-quality products.
Repurchase Rate
Repurchase rate is another eCommerce metric that indicates the percentage of customers who have made more than one purchase. It's similar to CRR but focuses on customers making repeat purchases of the same product. This KPI reveals insights into product satisfaction and loyalty.
Churn Rate
The churn rate is the flip side of the customer retention rate, showing the percentage of customers who stop doing business with the eCommerce store over a given period. A high churn rate could signal issues with unsatisfied customers, a clunky online shopping experience, or a poor product/market fit.
Revenue per Visitor
Revenue per Visitor (RPV) offers insights into how much value, on average, each site visitor brings in. It's calculated by dividing the total revenue by the total number of site visitors. This KPI helps assess the effectiveness of marketing efforts and site design.
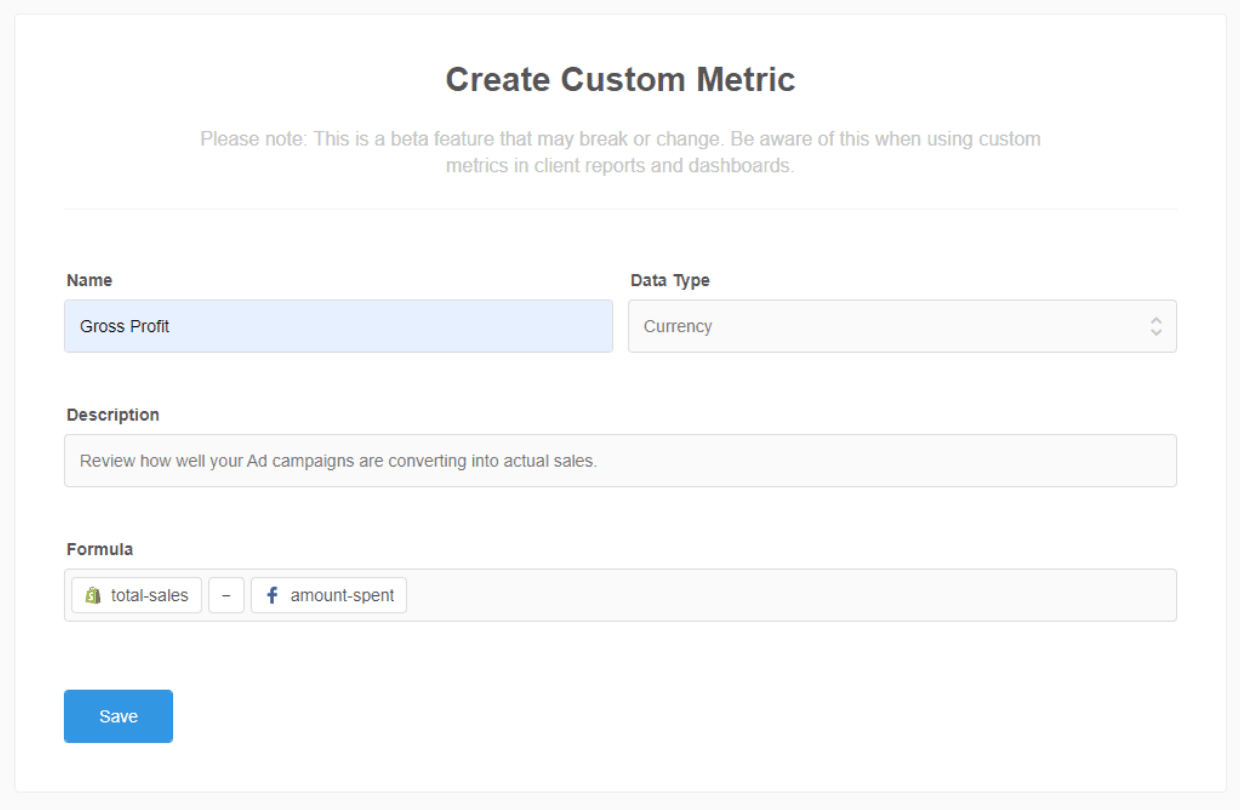
Gross Profit Margin
Gross Profit Margin is an essential profitability indicator. It shows what percentage of revenue exceeds the cost of acquisition, providing a clear snapshot of your eCommerce business's financial health. After all, if it costs $2 to sell a $1 widget, that isn't a model that can be sustained long-term.
Net Profit Margin
The net profit margin is a step further, measuring the percentage of revenue left after all expenses (including operational and overhead costs as well as the cost of goods sold) have been deducted. It's a telltale sign of the overall profitability of your eCommerce business.
Customer Profitability Score
This KPI measures the profitability of each customer by comparing the revenue they generate to the costs associated with serving them. It's a powerful tool for identifying the most valuable customers, especially in a high-touch sales funnel, and informs customer service and retention strategies.
Product Affinity
Product Affinity reveals which products are often purchased together. This knowledge helps devise effective cross-selling and upselling strategies, improving AOV and overall revenue.
Product Relationship
Product Relationship uncovers the sequence in which products are typically bought. It's like discovering a treasure map of your customer's buying journey, helping to inform marketing messages and product suggestions.
Micro-Conversions
Micro-Conversions are the small victories on the path to a final sale. These could include signing up for newsletters that contribute to the subscriber growth rate, adding a product to the wishlist, or sharing a product on social media. Tracking the conversion rate for each of these offers key insights into customer engagement and intent.
Refund and Return Rate
This KPI measures the percentage of sold items that customers return. A high refund and return rate could indicate dissatisfaction with the products once they've been received and prompt a review of product quality or descriptions.
Time to Purchase
Time to Purchase tracks the average time from a user's first interaction with your site until they purchase. This KPI sheds light on the effectiveness of marketing funnels and helps optimize the customer journey.
Net Promoter Score (NPS)
Your client's Net Promoter Score (NPS) is the compass guiding the customer satisfaction journey. It measures how likely customers are to recommend a business to others, scaling from detractors to promoters. A high NPS is a testament to customer happiness, while a low score may indicate potential problems.
Regularly checking the NPS and acting on its findings is a proactive way to keep customers satisfied and should be at the heart of any eCommerce strategy.
Customer Satisfaction Scores
Finally, customer satisfaction scores help gauge customers' satisfaction with their overall experience (like the Net Promoter Score). This metric acts as an early warning system for potential issues with the product or customer support team and provides opportunities for improvement.
A quick look a the customer service email count and customer service chat count can also provide insights into how complex the product or service is to use, which can impact customer satisfaction.
Impress clients and save hours with custom, automated reporting.
Join 7,000+ agencies that create reports in under 30 minutes per client using AgencyAnalytics. Get started for free. No credit card required.
Drilling Down: Segmenting Ecommerce KPIs by Acquisition Channel
Segmenting key performance indicators by acquisition channel allows online businesses to gain a granular understanding of their digital marketing strengths and areas for improvement.
Conversion Rate by Channel
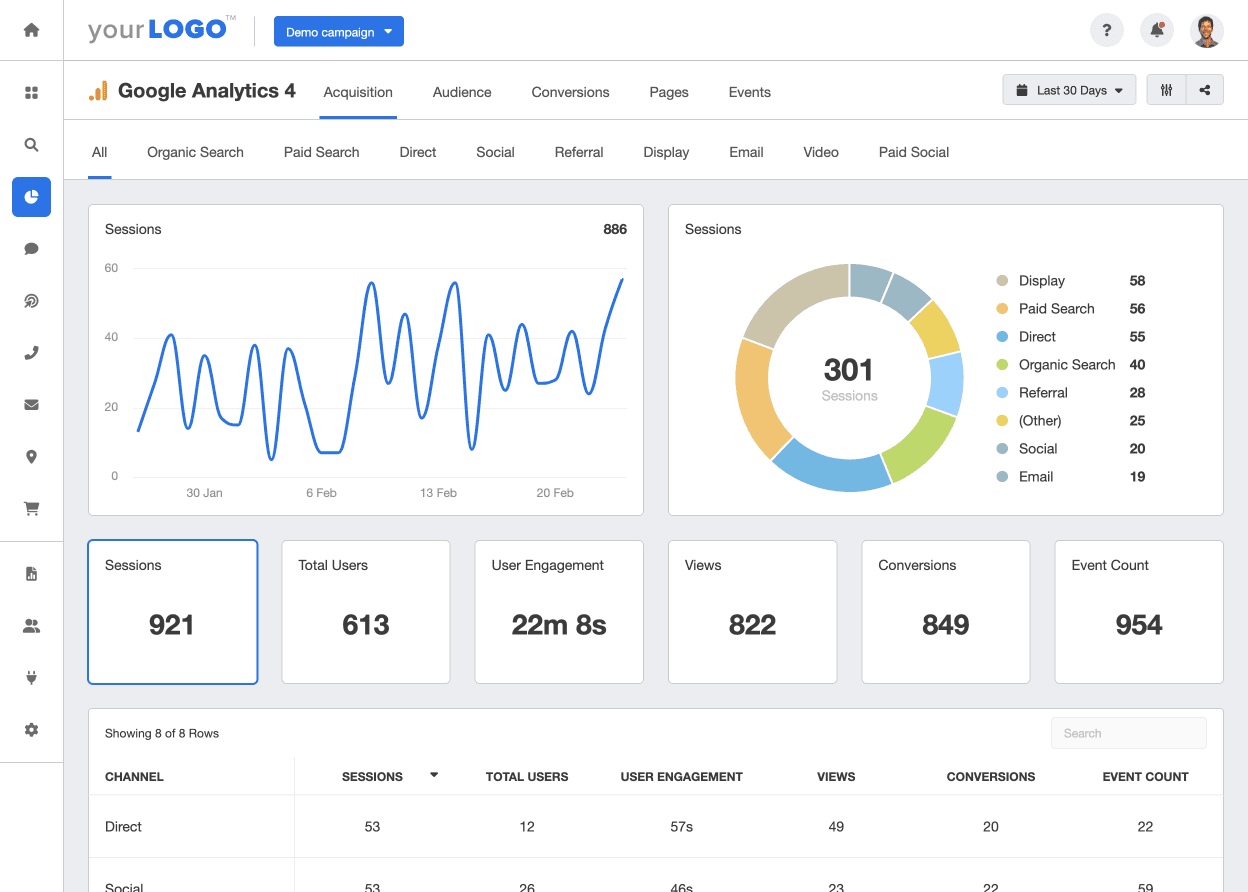
A one-size-fits-all approach to conversion rate tracking can leave you adrift in the world of eCommerce. Segmenting conversion rates by channel offers insights into which sources successfully steer visitors into new customers. This could include PPC, social media, email campaigns, or organic searches.
Revenue by Channel
Revenue is critical for any online business, guiding strategic decisions and measuring success. By segmenting revenue by channel, it's possible to uncover which channels contribute most significantly to the overall cash flow. This average revenue per channel allows for focused investment in high-performing channels and reevaluating underperforming ones.
Customer Acquisition Cost by Channel
Understanding the cost performance index by channel is essential in charting a profitable course. The customer acquisition cost (CAC) by channel determines how much is spent to acquire a customer from each channel.
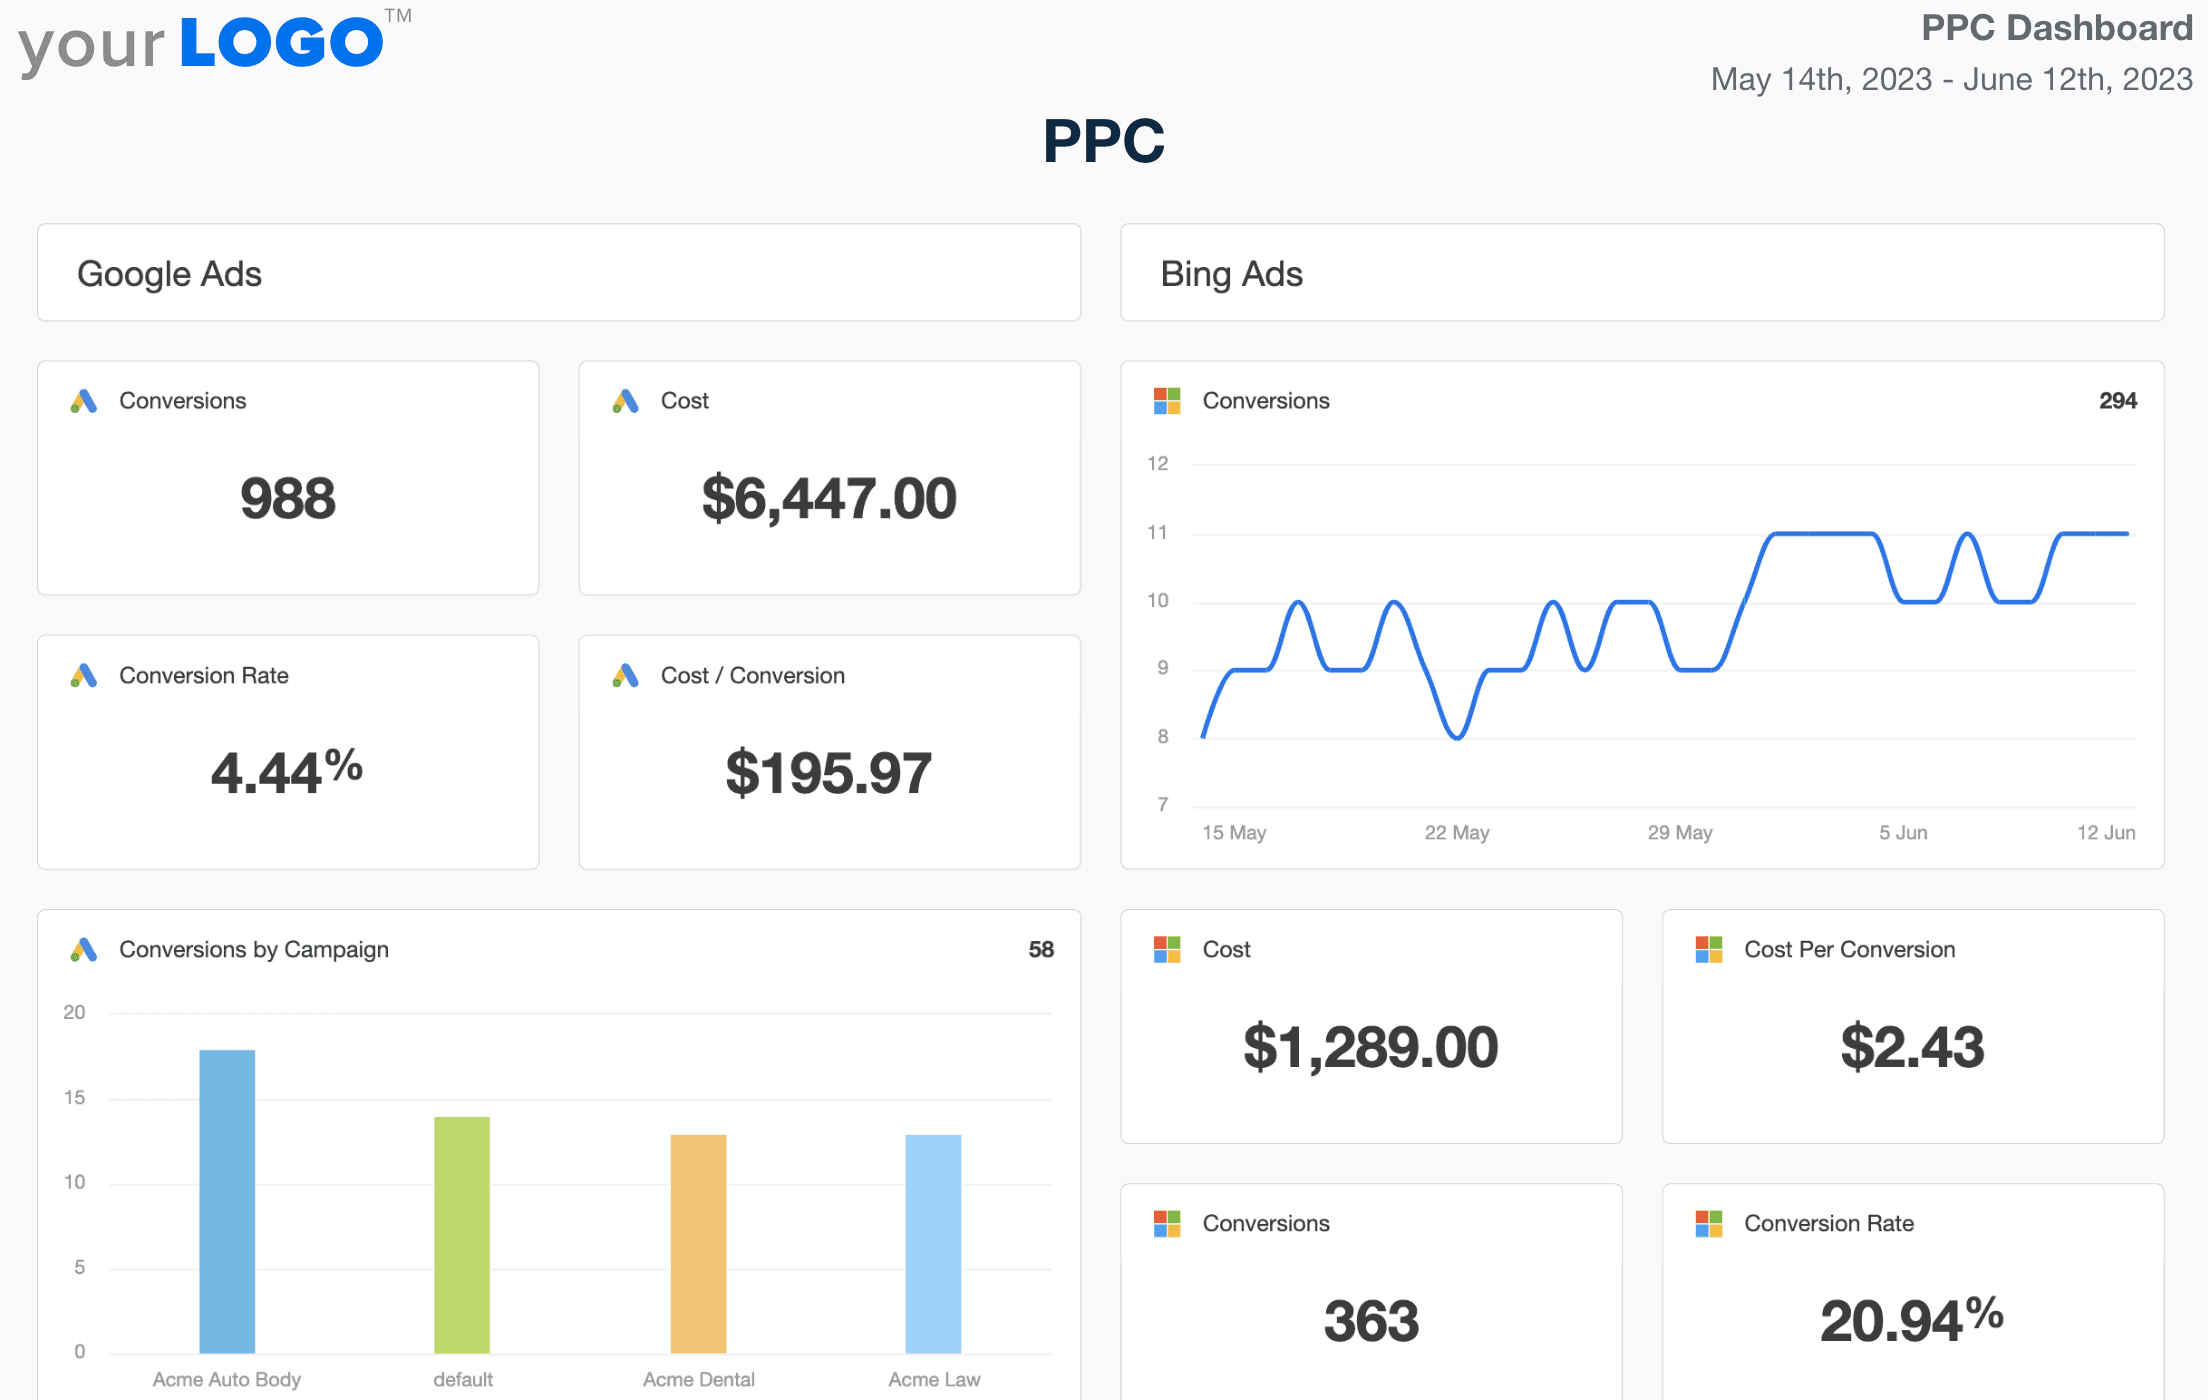
With this data in hand, you can choose which channels bring in customers at the lowest cost, offering invaluable insights for budget allocation.
Return on Ad Spend by Channel
Taking acquisition costs one step further, Return on Ad Spend (ROAS) by channel clearly shows how well your advertising dollars are performing based on the revenue they generate.
It's not just about how much you spend; it's about where you spend it and how much it drives the client's bottom line. By comparing the revenue generated from each ad channel with the cost of that channel, you prioritize the most effective ones and reassess or negotiate those that aren't delivering.
Shopping Cart Abandonment Rate by Channel
While shopping cart abandonment is typically seen as a site-wide issue, segmenting this rate by channel often provides unexpected insights. Different acquisition channels may lead to different user behaviors, and understanding this helps inform both the customer journey and the marketing strategy.
Google Analytics is an invaluable tool for tracking these segmented KPIs. It allows for a deep dive into mobile site traffic, average session duration, and many other metrics that inform these crucial KPIs. By understanding the nuances of each channel, digital marketers can set a clear course toward more profitable customer acquisition.
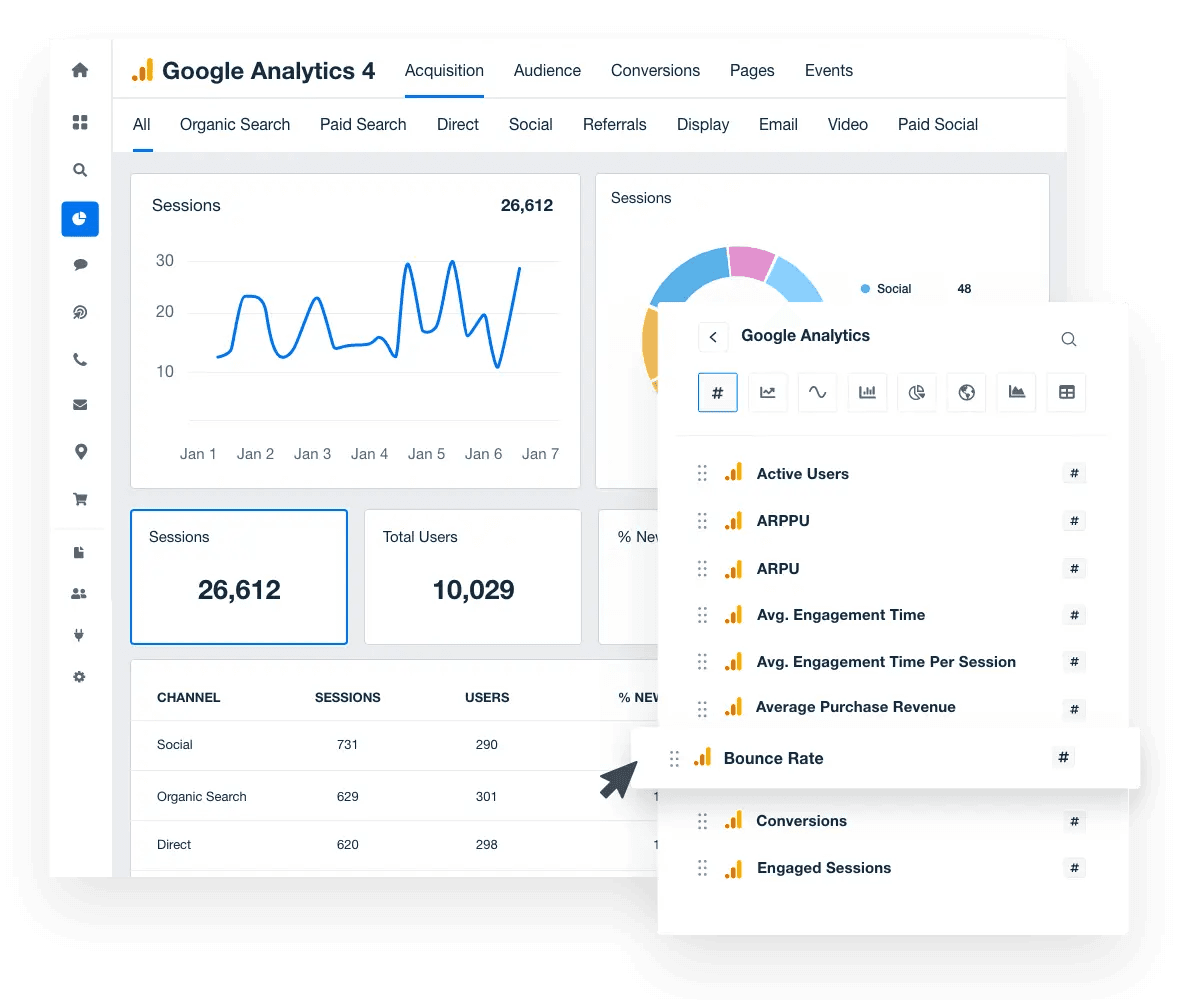
Use the drag-and-drop client report builder to create custom KPI dashboards that highlight the eCommerce KPIs your clients care about.
Acquisition Key Performance Indicators: The Engines of eCommerce Growth
Tracking the proper acquisition key performance indicators (KPIs) is a powerful compass toward business growth. This type of eCommerce KPI helps decode the mysteries of traffic generation, customer acquisition, and, ultimately, the business success of an online store.
Traffic by Channels and Sources
The starting point of any eCommerce journey is understanding how much traffic flows through various channels. This KPI provides a comprehensive picture of where visitors come from social media, organic search, email marketing, or referral links.
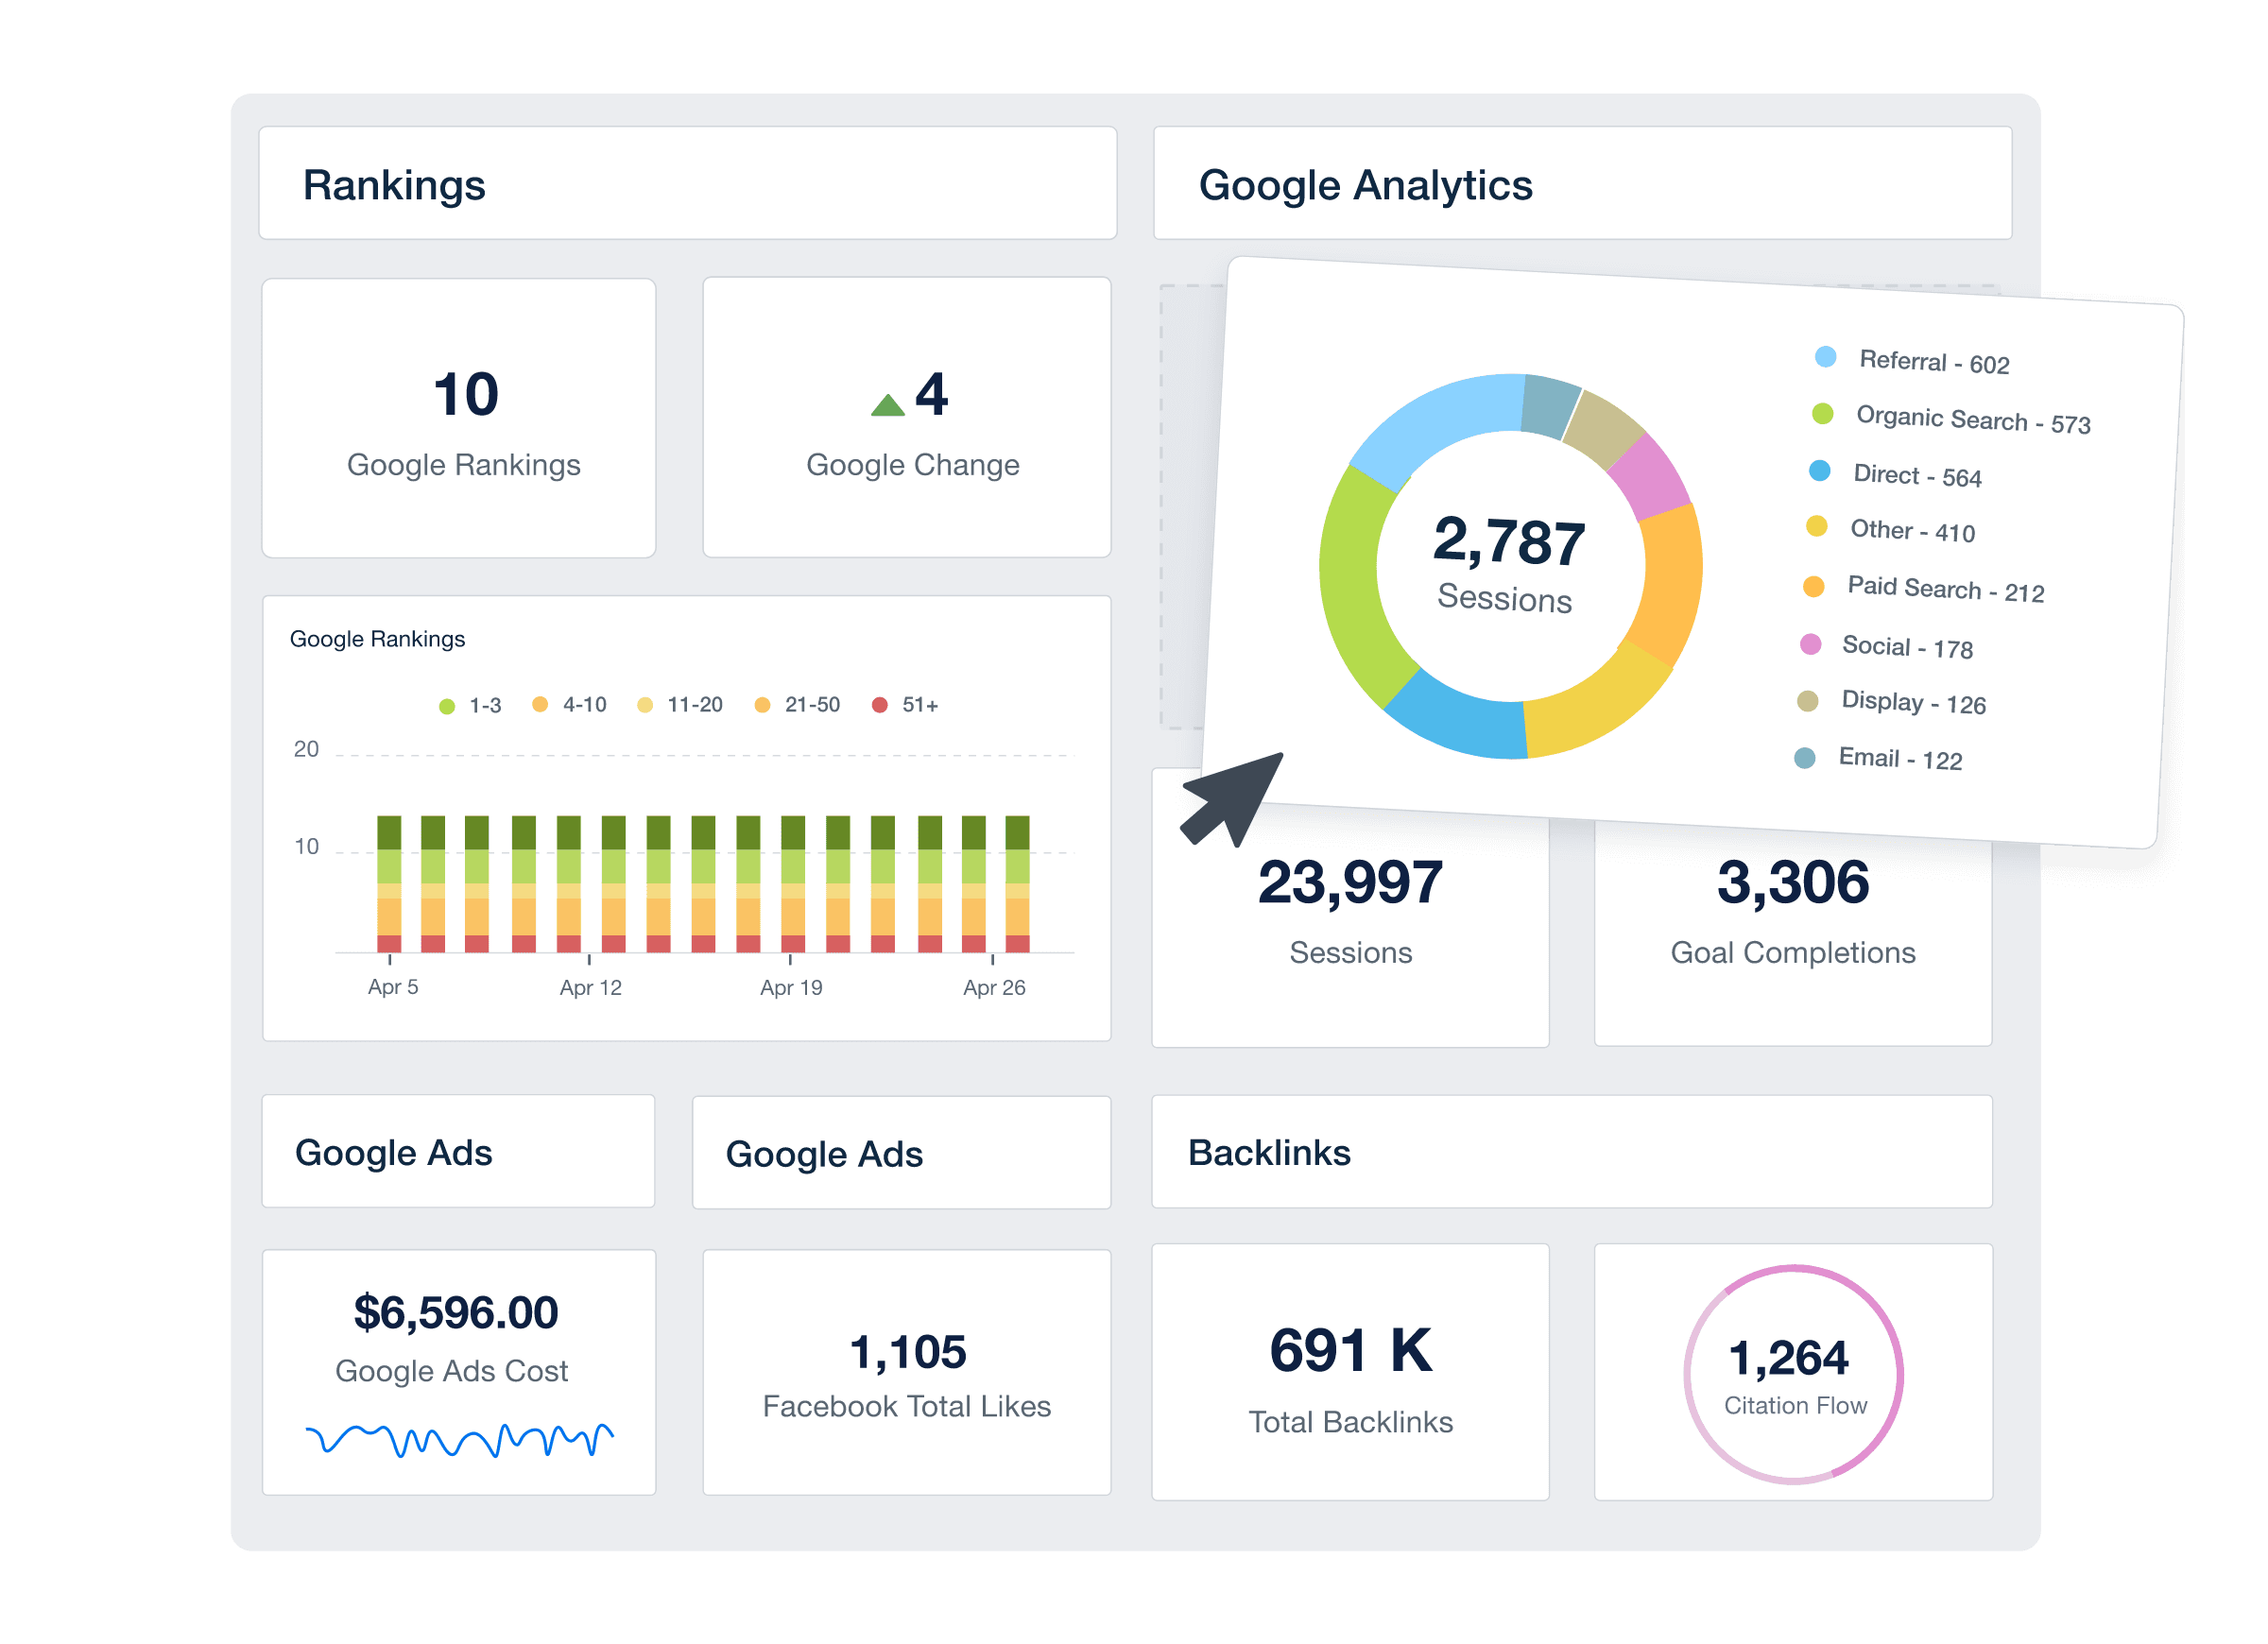
Tracking traffic by channel using GA-4 helps optimize marketing spend and paves the way for targeted, effective strategies.
Keyword Rankings
The universe of search engine optimization (SEO) revolves around keyword rank tracking. This KPI provides crucial insights into how your website fares on search engine results pages (SERPs) for targeted keywords.
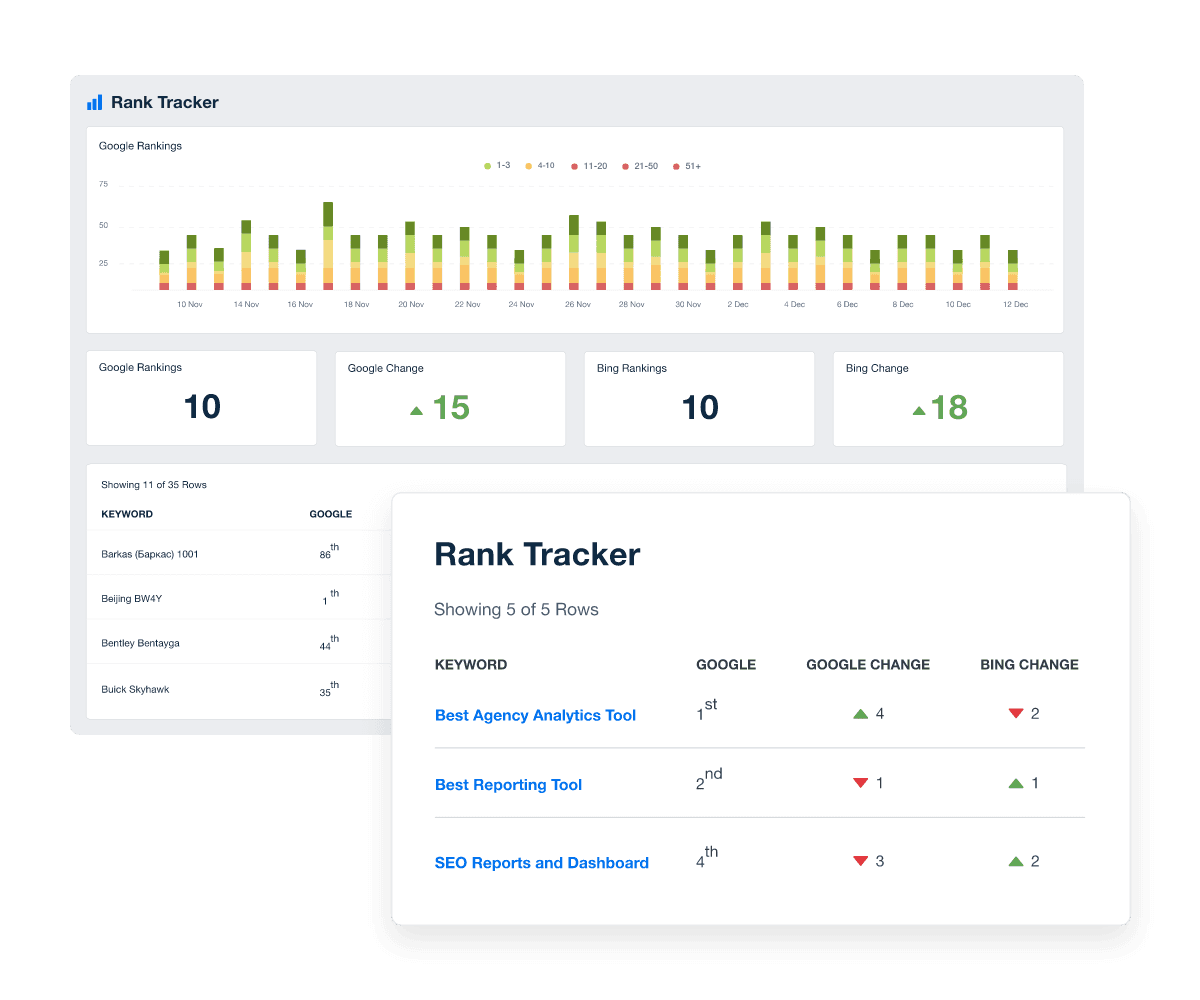
Monitoring keyword rankings assists in assessing the effectiveness of SEO strategies and helps navigate the competitive landscape.
SEO Health Score
Maintaining a healthy website is important for any online business. Running SEO site audits provides a comprehensive measure of a website's SEO health, encompassing website speed, mobile optimization, and content quality.
A higher SEO Health Score typically translates to better visibility and higher rankings on SERPs, and typically digs into on-page factors, off-page optimization, and technical SEO and UX issues.
Email Engagement Rates
In eCommerce, email isn't just about communication—it's a vessel for business growth. Tracking subscriber growth rate and engagement metrics like open rate, click-through rate, and unsubscribe rate puts a spotlight on the effectiveness of email marketing campaigns and the quality of content being delivered.
Social Media Engagement Rates
Social media KPIs aren't just about tracking likes and shares—they should be looked at as key drivers of customer acquisition. Gauge the resonance of content and campaigns with the target audience by tracking engagement rates and other critical social media analytics across various social media platforms. A high engagement rate can indicate strong brand loyalty and audience interest.
PPC Ad Cost Per Click (CPC)
Regarding paid advertising, Cost Per Click (CPC) is a leading indicator of the return on investment. By tracking CPC, you measure how much you pay for each click on your client's ads. Lower CPC often leads to a higher ROI, making this a valuable metric to monitor in optimizing your PPC ad spend.
PPC Ad Click-Through Rate (CTR)
The PPC Click-Through Rate (CTR) is a litmus test of their effectiveness. CTR measures the ratio of users who click on your ad to the number who see it.
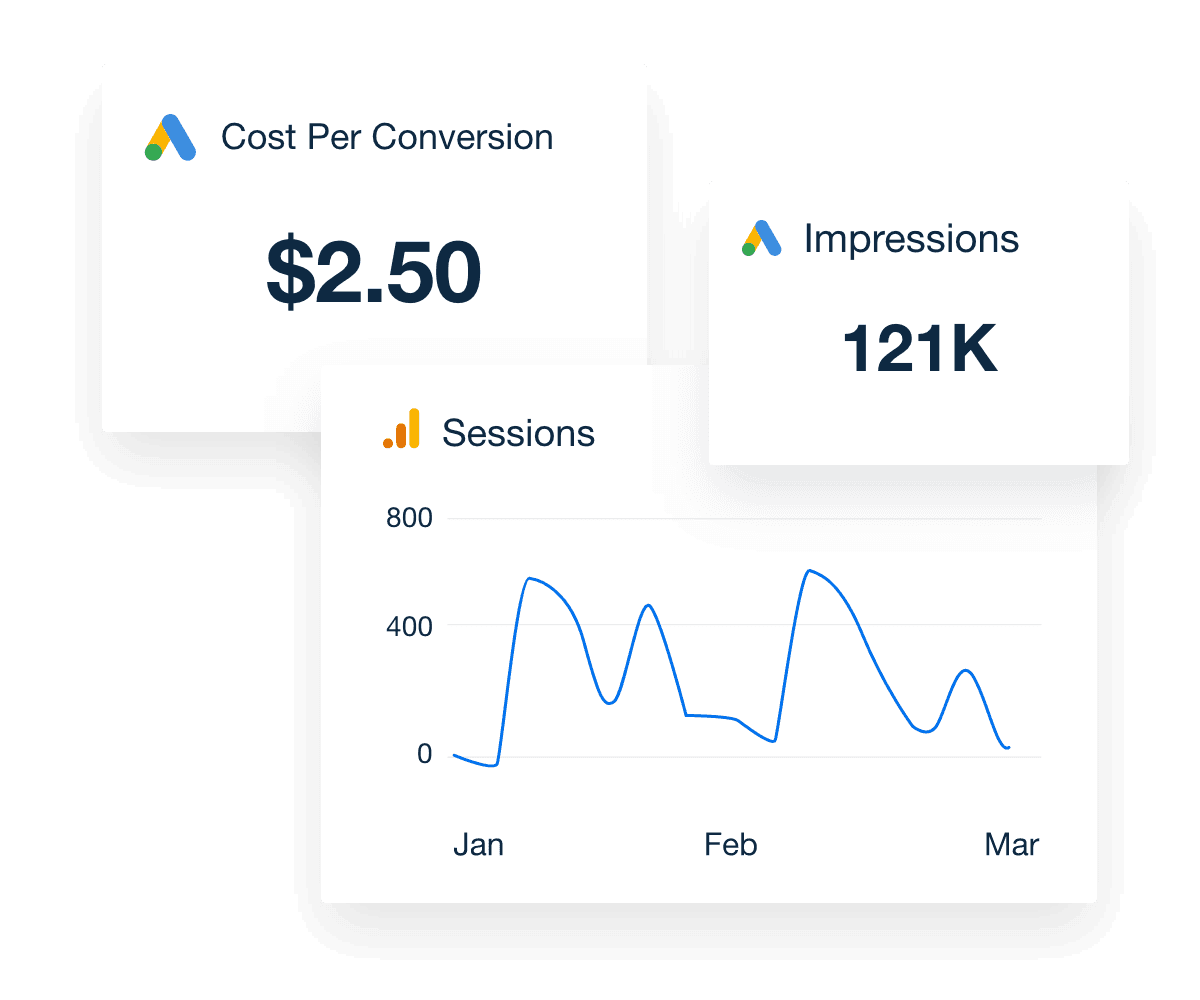
A high CTR suggests that the ads resonate with the target audience, increasing website traffic and potential conversions.
Customer Service Response Time
Never underestimate the power of prompt customer service. The response time of the customer support team can significantly impact customer loyalty. A lower response time generally correlates with higher satisfaction, making this an important eCommerce KPI to track for the overall health of your eCommerce business.
Interpreting eCommerce KPIs: Decoding the eCommerce Enigma
Measuring customer lifetime value, average order value, conversion rate, and shopping cart abandonment rate is one thing. The real magic happens when we dive into the data and surface the treasure chest of insights.
Making Sense of the Data
The beauty of eCommerce is that every click, every scroll, every add-to-cart action translates into data. But it's not just about collecting these numbers; it's about making sense of them.
Picking apart the data and looking at individual elements, like Google Analytics reports, add-to-cart rate or shopping cart abandonment rates, provides the first layer of understanding. The key is not to get overwhelmed. Step back, breathe in, and take it one data point at a time.
Understanding the Interconnectedness of Various KPIs
The ecosystem of eCommerce KPIs is a vibrant, bustling, interconnected web. You'll find that the average order value is holding hands with the conversion rate, while customer lifetime value is dancing the waltz with customer loyalty. Traffic, Conversion, and Customer Value combine to create the Marketing Metrics Power Triangle.
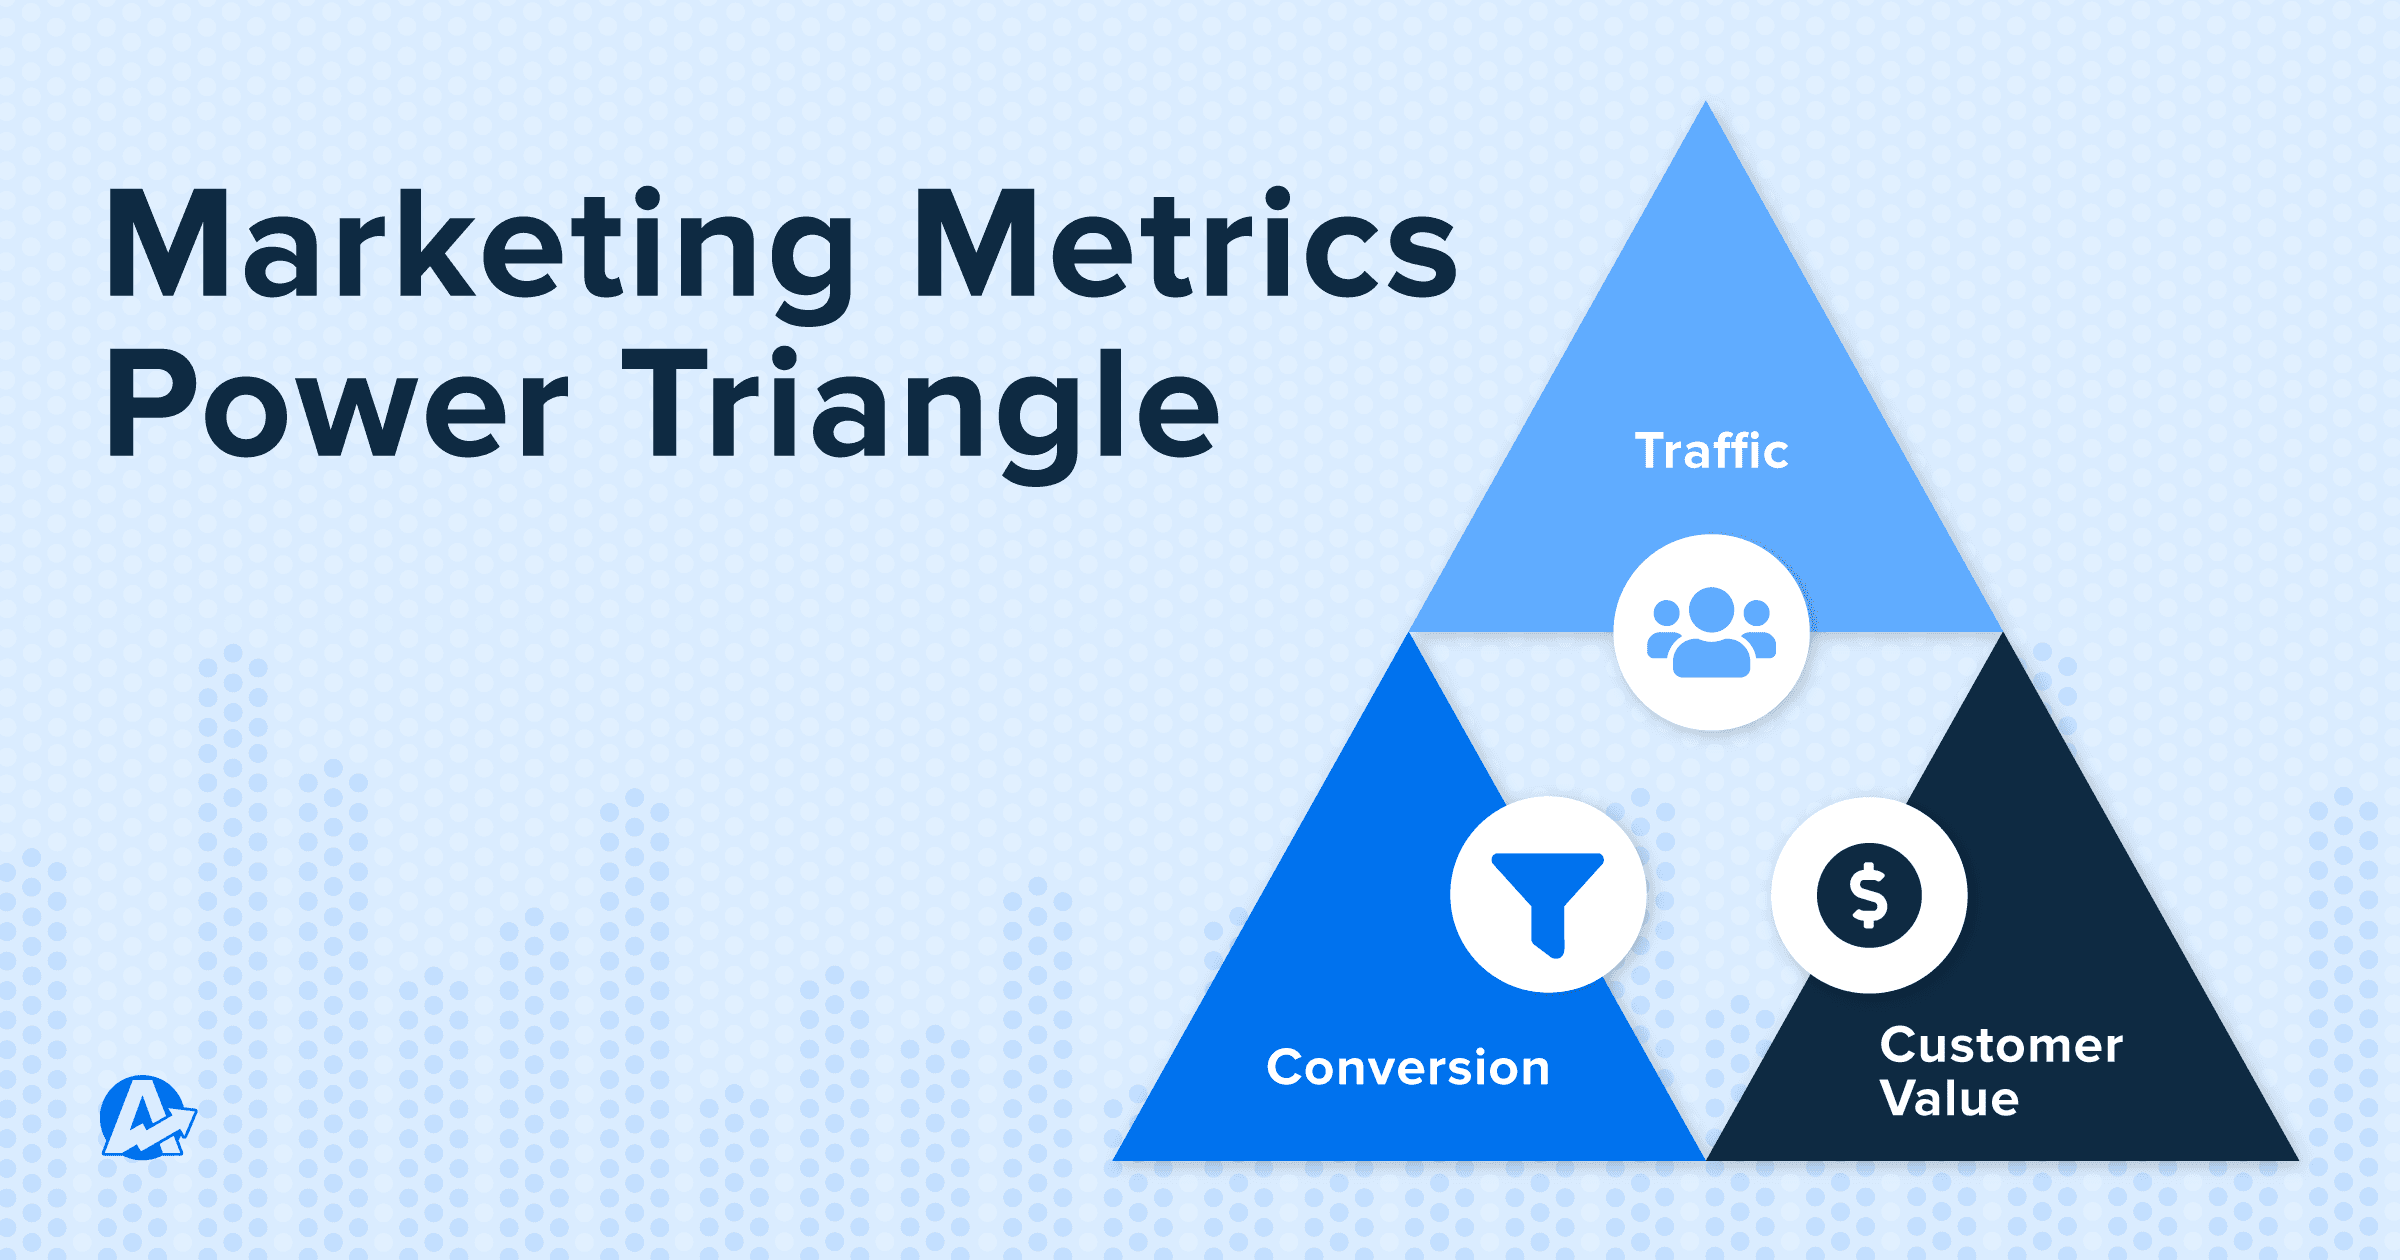
When a customer exits an eCommerce store without making a purchase, it's not an isolated event but a ripple effect of various factors. Understanding these relationships helps paint a fuller, richer picture of your business performance.
Reporting and Communicating eCommerce KPIs
Imagine being the bearer of the most deliciously insightful news about an eCommerce business and being able to deliver it in a way that's clear, engaging, and impactful.
That's what reporting and communicating eCommerce KPIs is all about. Let's explore the best practices for sharing the magic of these key performance indicators with clients.
Compiling and Presenting eCommerce KPI Reports to Clients
Assembling and presenting eCommerce KPI reports to clients is like curating a gourmet meal—it should be digestible, pleasing, and leave the clients craving more. Start by focusing on the most relevant KPIs, like conversion rate, customer retention, bounce rate, and the average number of customers.
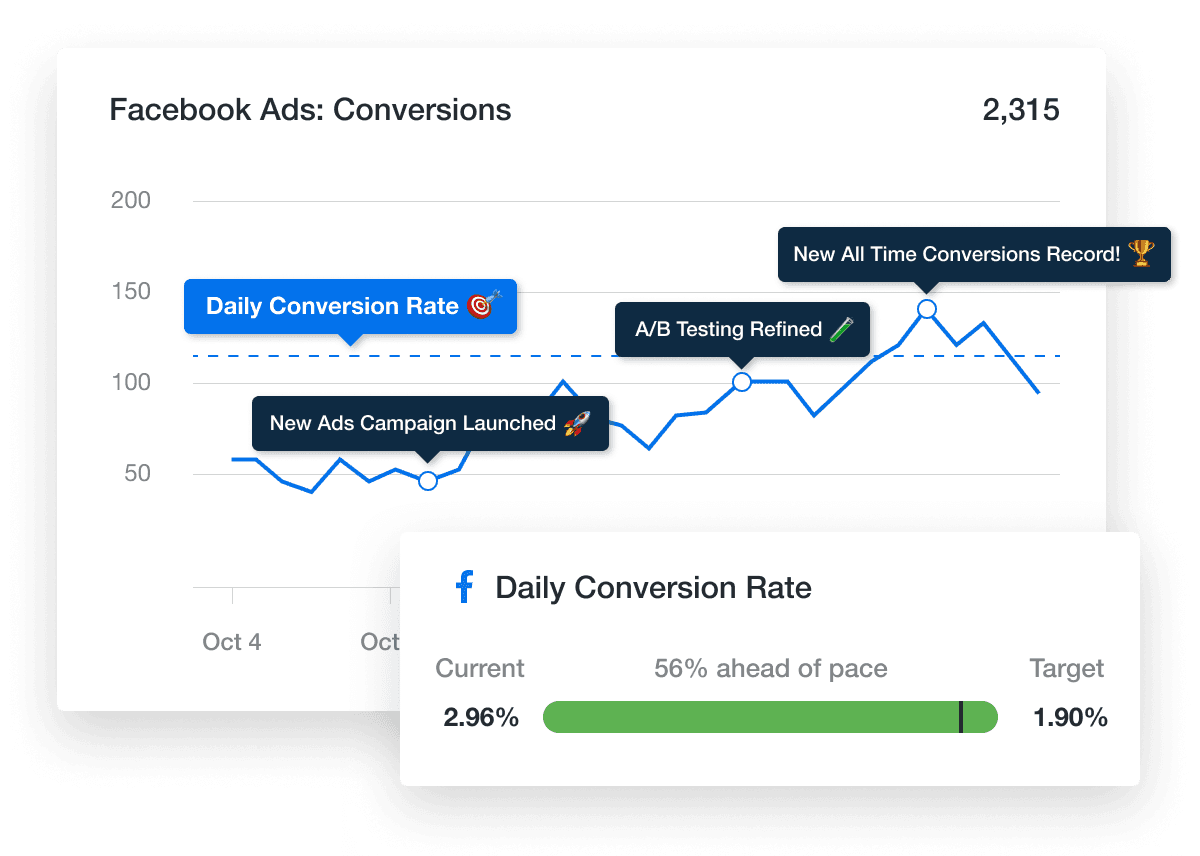
Add a dash of context for each key performance indicator, explaining why it matters and how it affects the eCommerce site's performance.
Finally, ensure the presentation is clean and visual, turning raw data into compelling graphs or charts that narrate a compelling story.

How to Articulate the Significance of KPIs to Stakeholders
As they say, "the proof of the pudding is in the eating," or in this case, the significance of KPIs is in the explaining. Articulating the importance of key performance indicators is about making stakeholders understand their impact on the overall eCommerce business.
From gross profit to customer satisfaction score, each KPI is crucial to the business success puzzle. It highlights the interplay between different metrics and how each contributes to business growth.
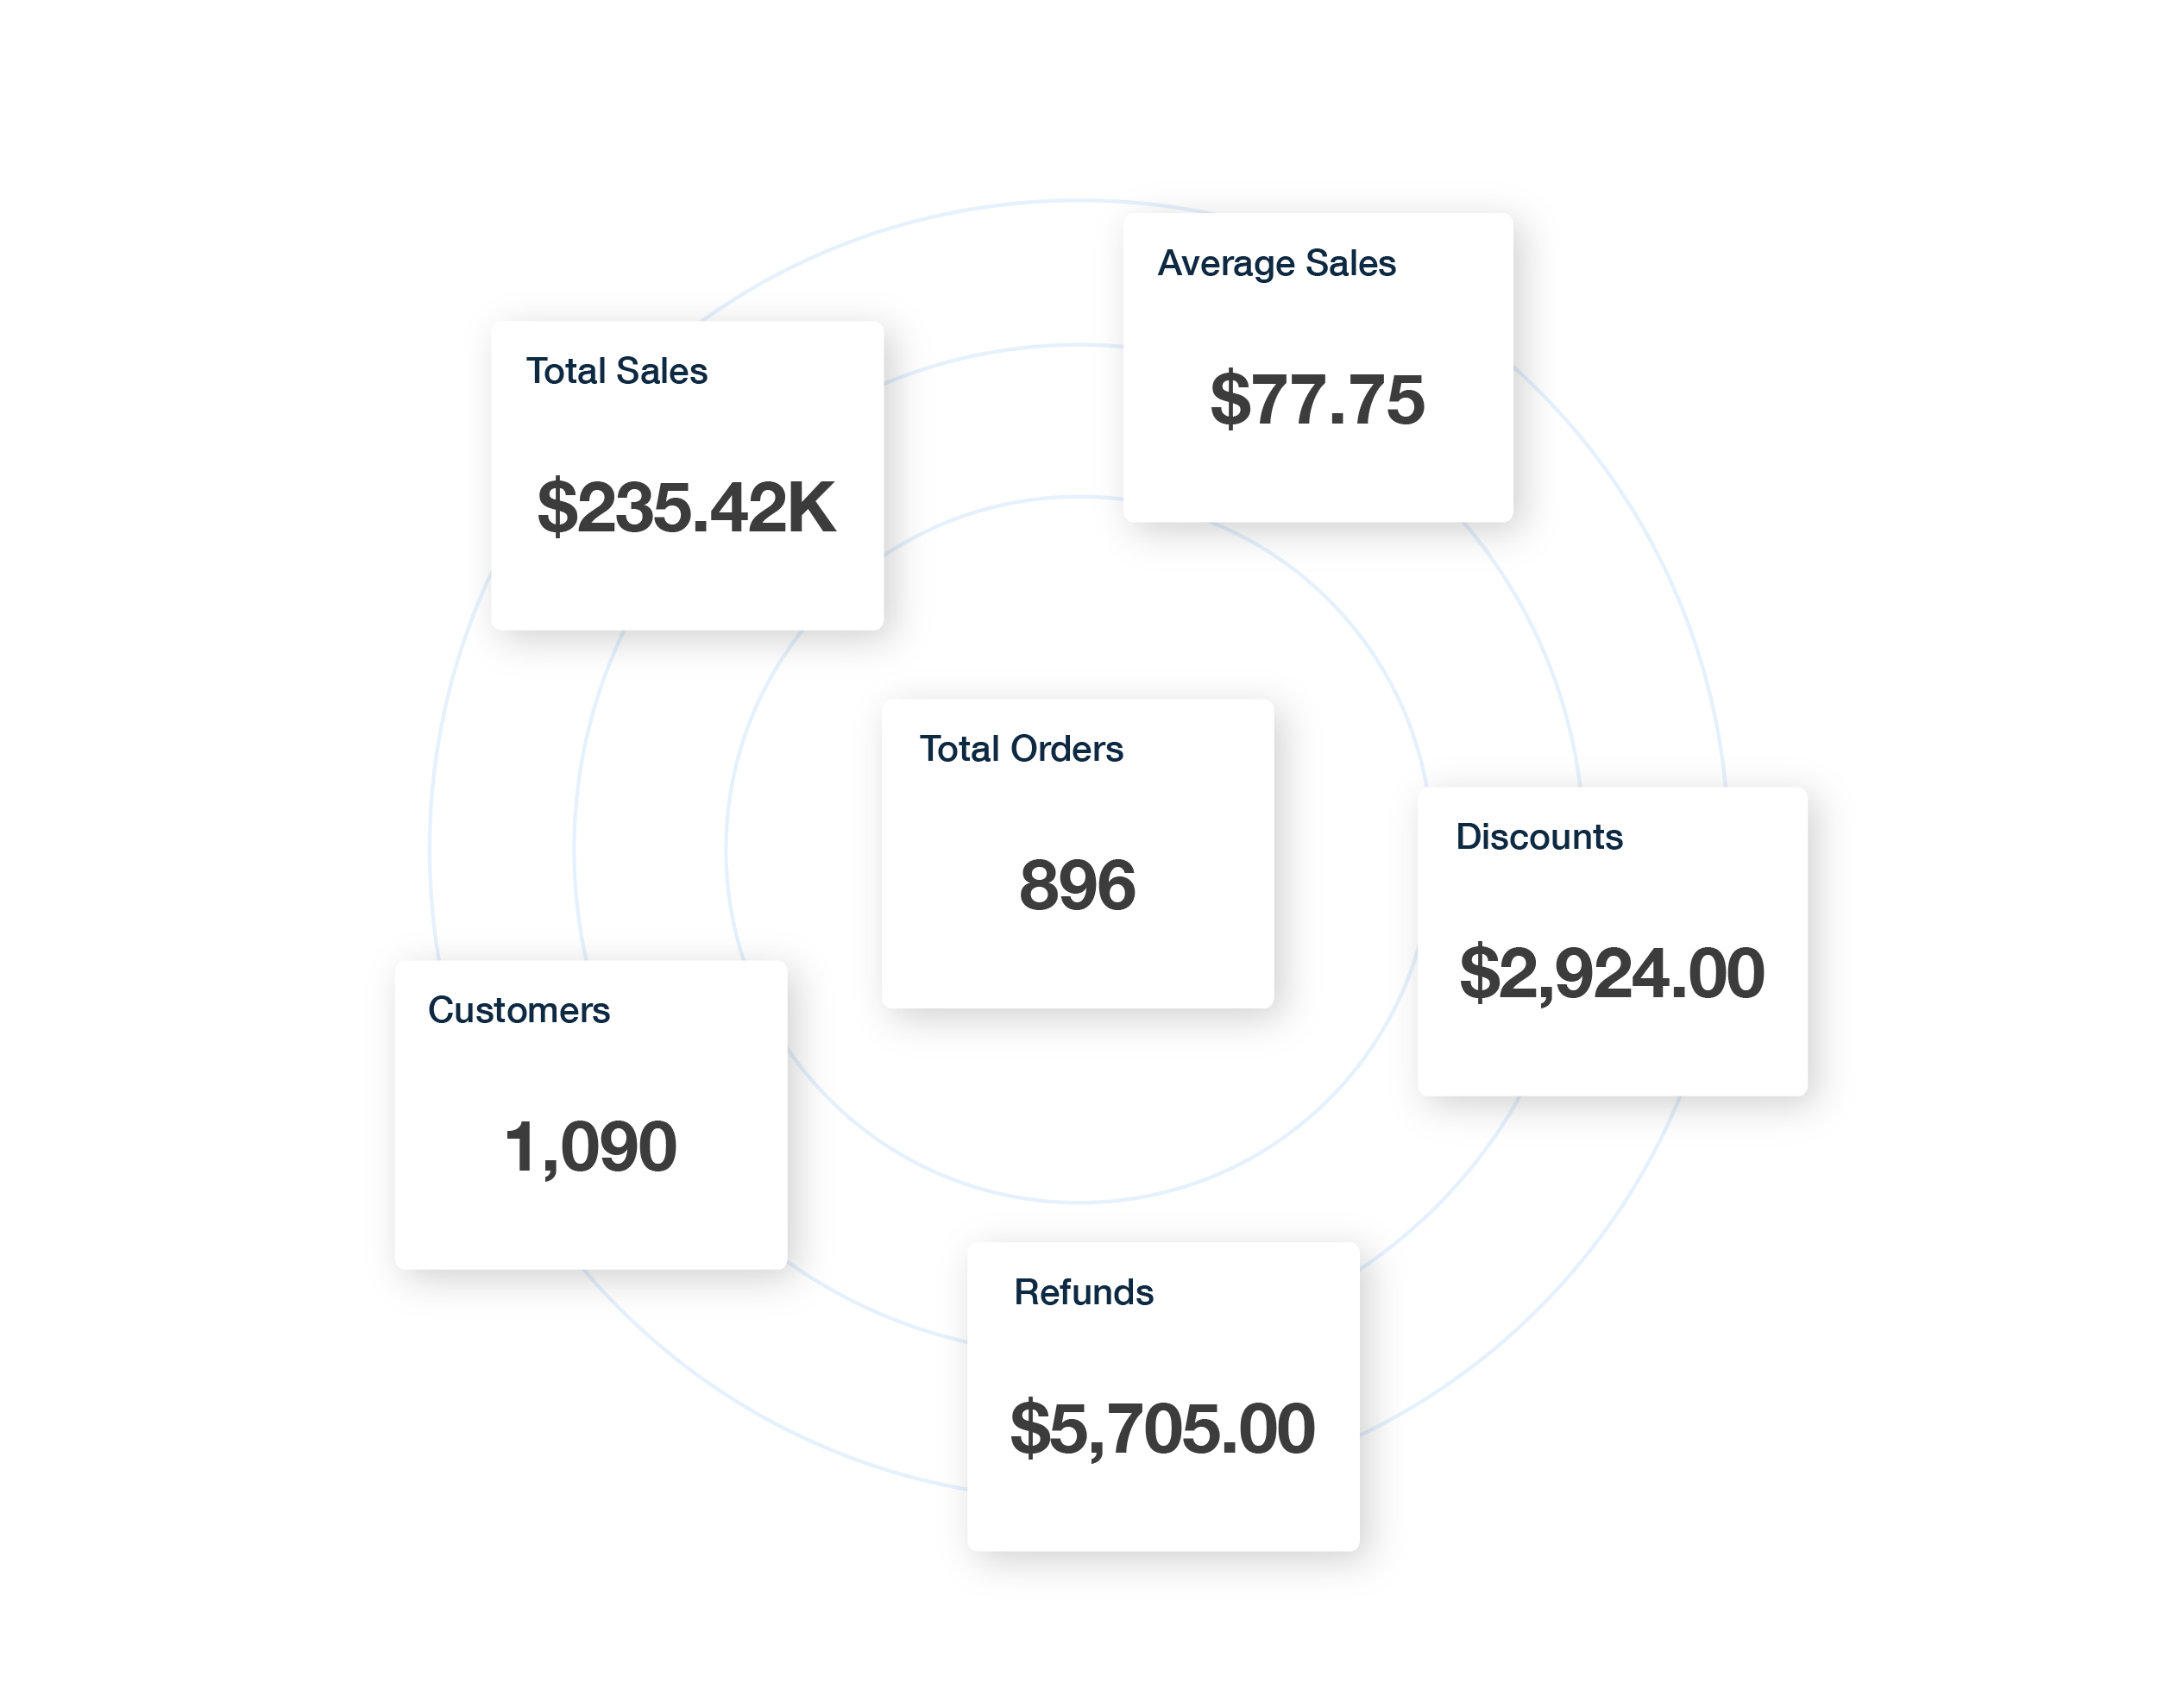
Remember, every KPI is a superhero with a unique power—it's your job to highlight it.
Supercharging Your eCommerce Reporting Process with AgencyAnalytics
Let's face it—compiling, analyzing, and reporting on eCommerce KPIs can be daunting. Enter AgencyAnalytics, the superhero sidekick that every marketer needs. It helps to streamline the reporting process, making it easy to compile KPI data, automate reports, and present findings in a client-friendly format.
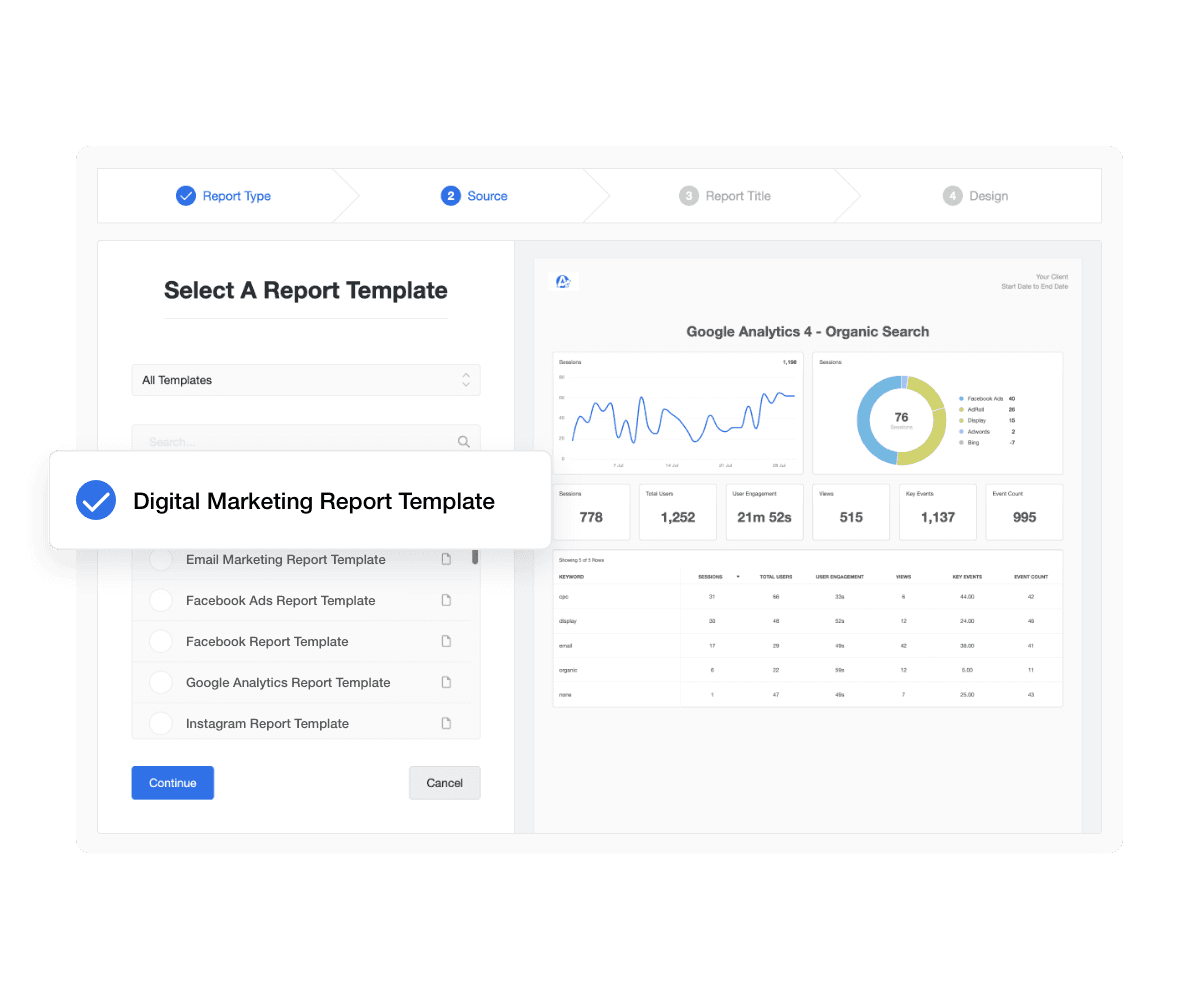
Not only does it save precious time, but it also provides a more accurate and holistic view of an eCommerce business. It's like having a personal assistant specializing in KPIs, analytics, and making life easier.
In essence, effectively reporting and communicating eCommerce KPIs is like being your clients' best customer service team—providing them with valuable insights, showing them the path to improvement, and equipping them with the tools they need for business success.
Let's take a look at what's available from some of the AgencyAnalytics eCommerce integrations:
Shopify Integration
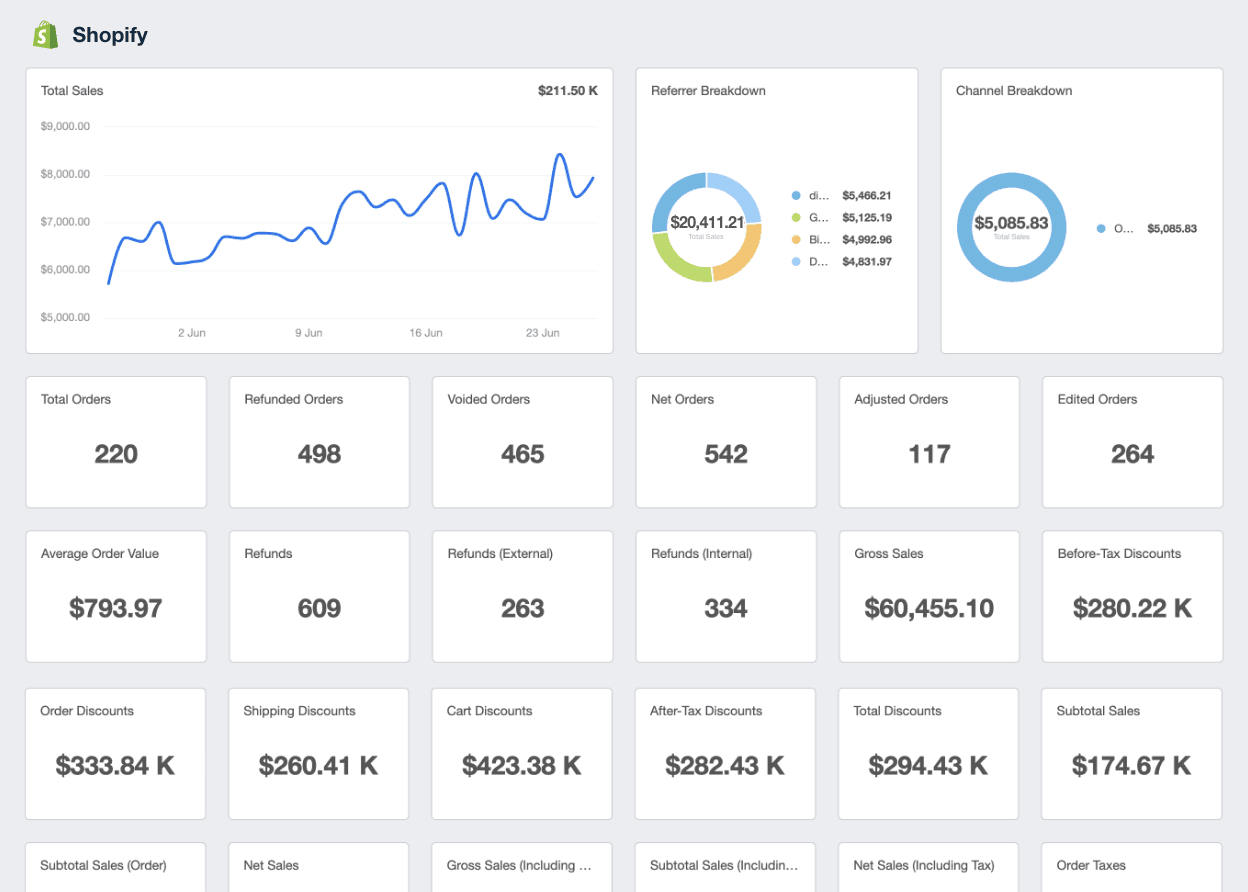
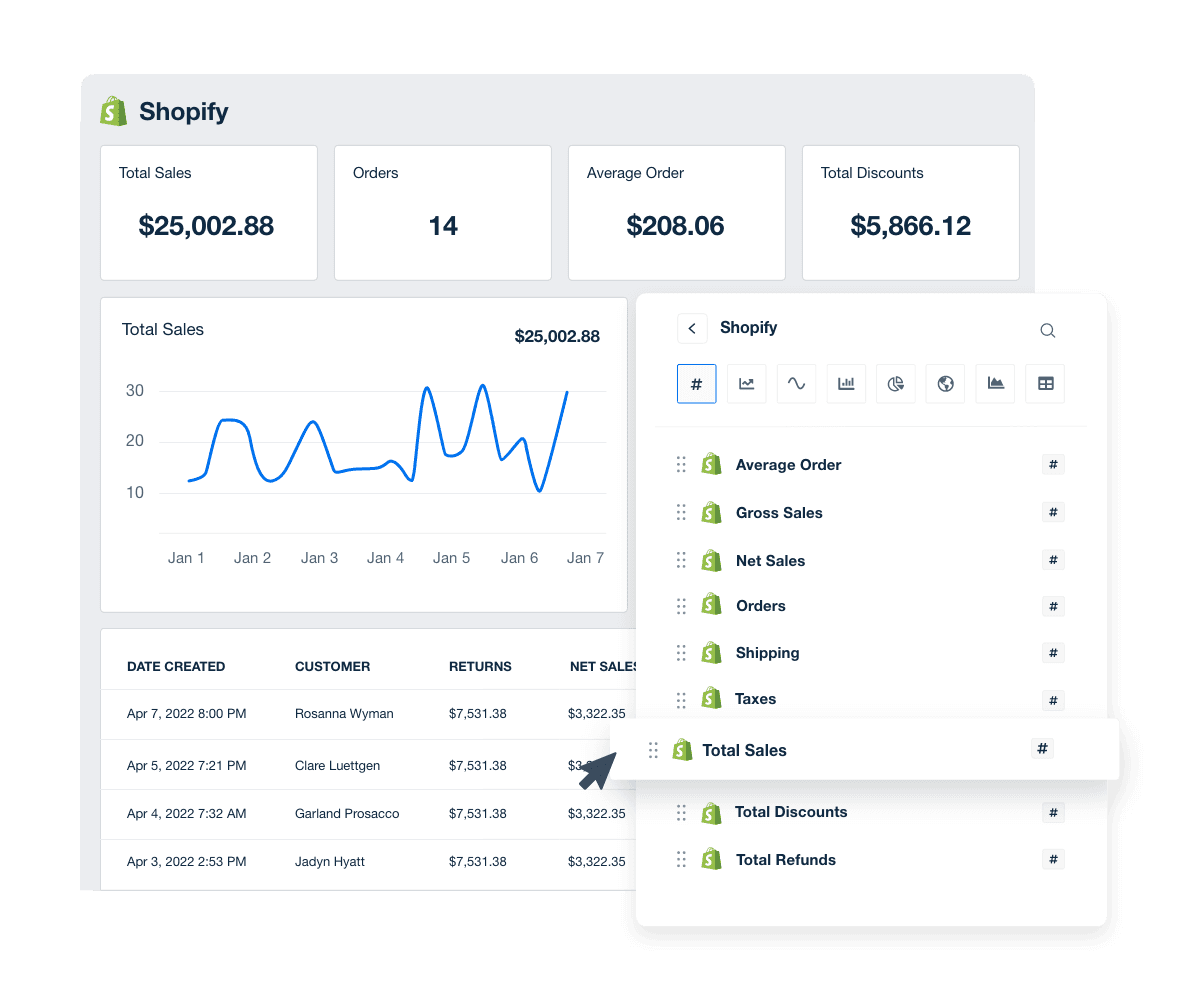
With the Shopify integration, quickly and easily add your clients' Shopify data to regular reports and custom Shopify dashboards.
Simply connect Shopify (it only takes a few seconds), then go to your Ecommerce > Shopify dashboard to see everything. Add this data to client reports and put your must-see metrics on custom dashboards.
You'll have access to Shopify analytics data covering:
Customers
Gross Sales and Net Sales
Discounts
Returns
Shipping & Tax
Transaction types
Referrers & Channels
The data is automatically available in report-ready tables, charts, and other widgets. You can track changes in data across time and zero in on specific date ranges.
WooCommerce Integration
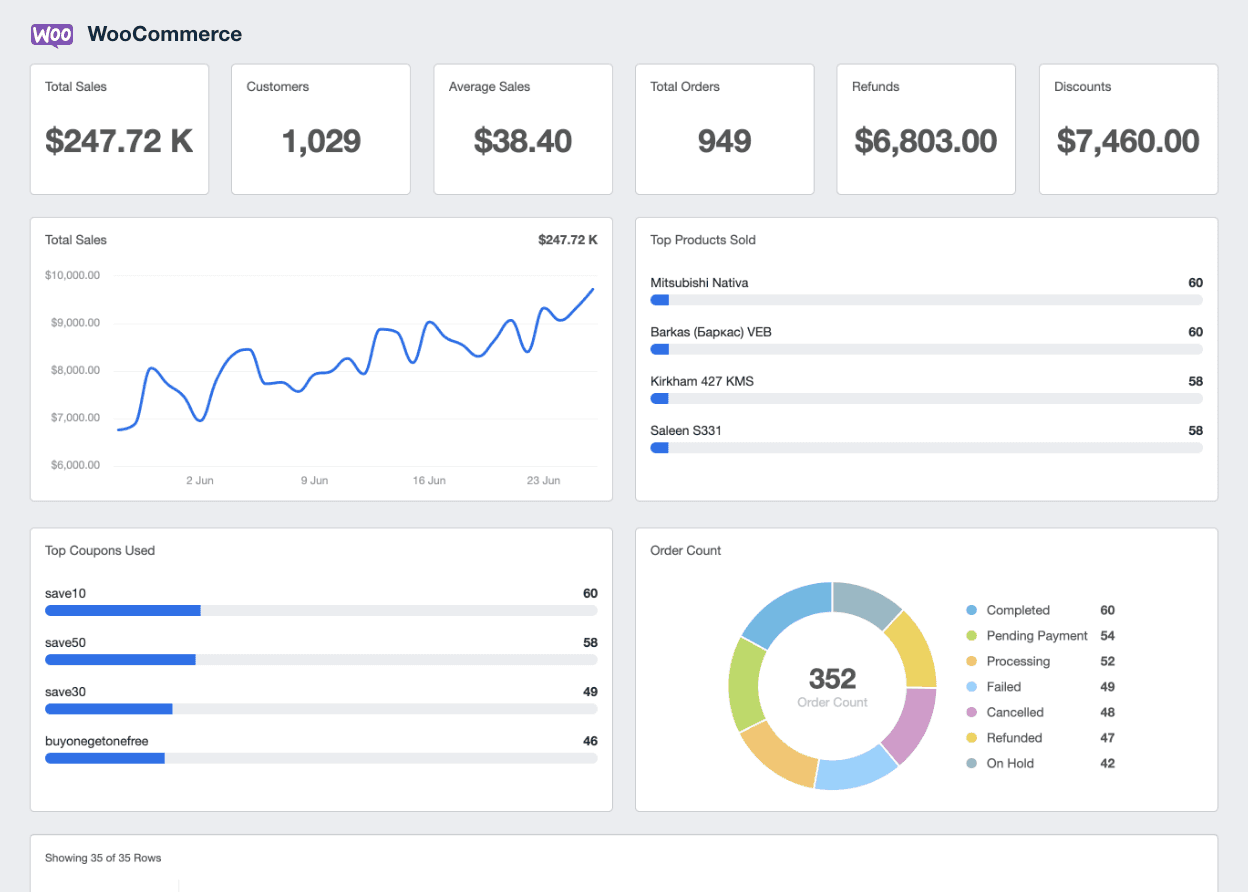
If your client is using WooCommerce, we've also got your client reporting covered. You'll find instructions here to connect WooCommerce to AgencyAnalytics. Once set up, you can see your data in the WooCommerce dashboard and add it to any reports or custom dashboards.
The WooCommerce integration gives you access to the following:
Customer Details
Sales
Orders & Order Status
Refunds
Discounts
Top Products Sold
Top Coupons Used
Like with our Shopify integration, the above WooCommerce data is available in tables, charts, and other widgets, giving you the flexibility to present your data exactly how you like.
Stripe Integration
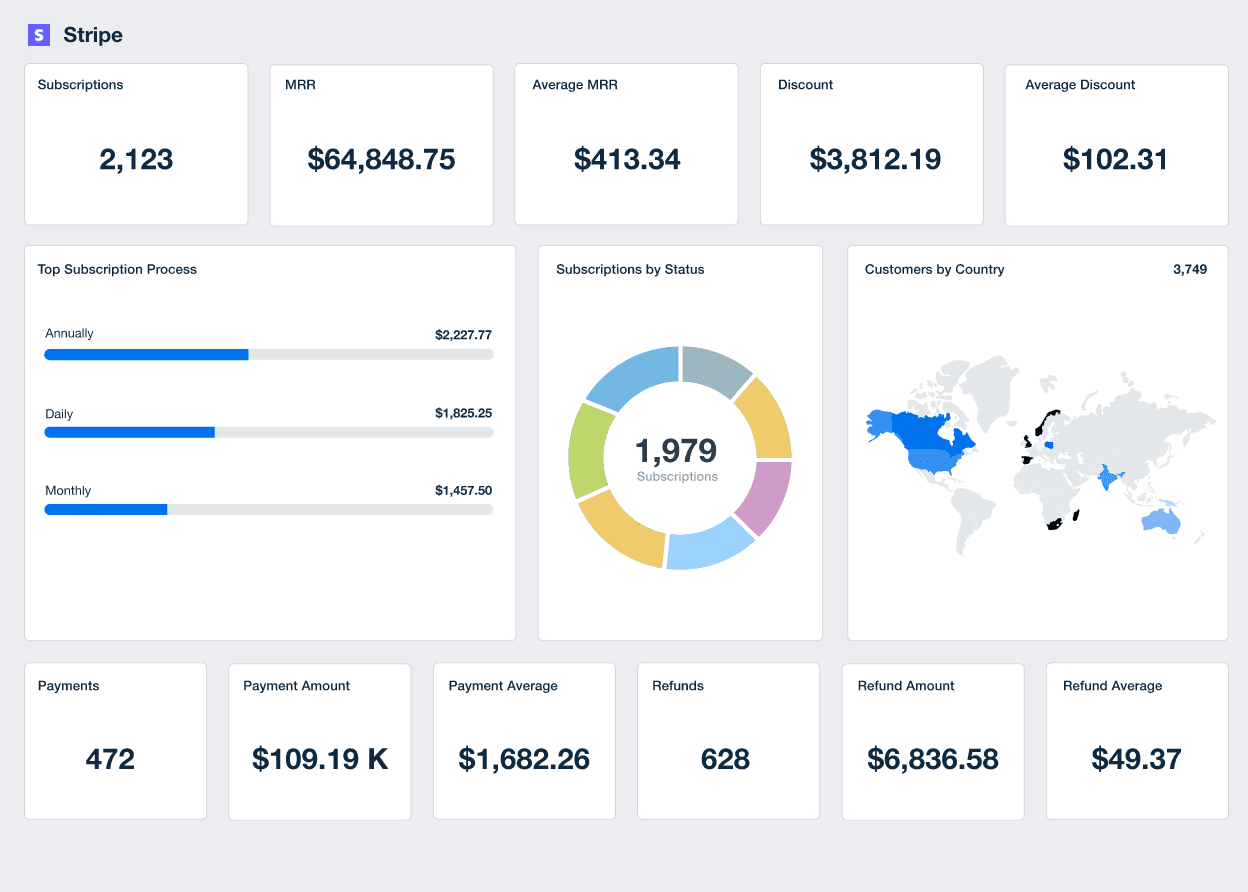
You no longer need to manually compile and cross-reference data from multiple sources. The Stripe integration pulls all your vital eCommerce data into your AgencyAnalytics dashboard, giving you a comprehensive, real-time view of your clients' financial metrics.
Key Stripe KPIs include:
Customer Analytics
Payment Analytics
Refund Analytics
Subscription Analytics
Subscription Churn Analytics
From new customers to total cost, gross profit, and more, it provides a broad scope of essential financial data at your fingertips. This enables you to delve deeper into the financial health of your clients' businesses, all without ever leaving your AgencyAnalytics dashboard.
Use a customizable Stripe reporting dashboard to showcase the value your agency brings to your clients in a clear and understandable way, try it free for 14 days!
80+ Other Marketing Platform Integrations
When it comes to eCommerce, having a clear, holistic view of your client's business performance is invaluable. By combining eCommerce data with information from all the acquisition platforms a client uses, you get a 360-degree perspective.
This isn't just about seeing the full picture but understanding how every puzzle piece fits together.
Let's think about it: each acquisition platform—social media, email marketing, or paid search—brings its unique value to the table. But when you examine these data sets in isolation, you only see part of the story.
However, when you unite them with your eCommerce data, you're equipped with a comprehensive narrative that reflects the client's complete business journey, from visitor acquisition to final sale.
With this integrated data, you pinpoint the most profitable channels, track how marketing campaigns affect sales, and determine which strategies result in the highest customer lifetime value. This insight enables data-driven decisions, optimizes marketing spend, and steers your clients toward sustainable growth.
It's like having a magnifying glass that shows you the details and reveals the bigger picture. All while clearly tying positive results to your agency's brand.
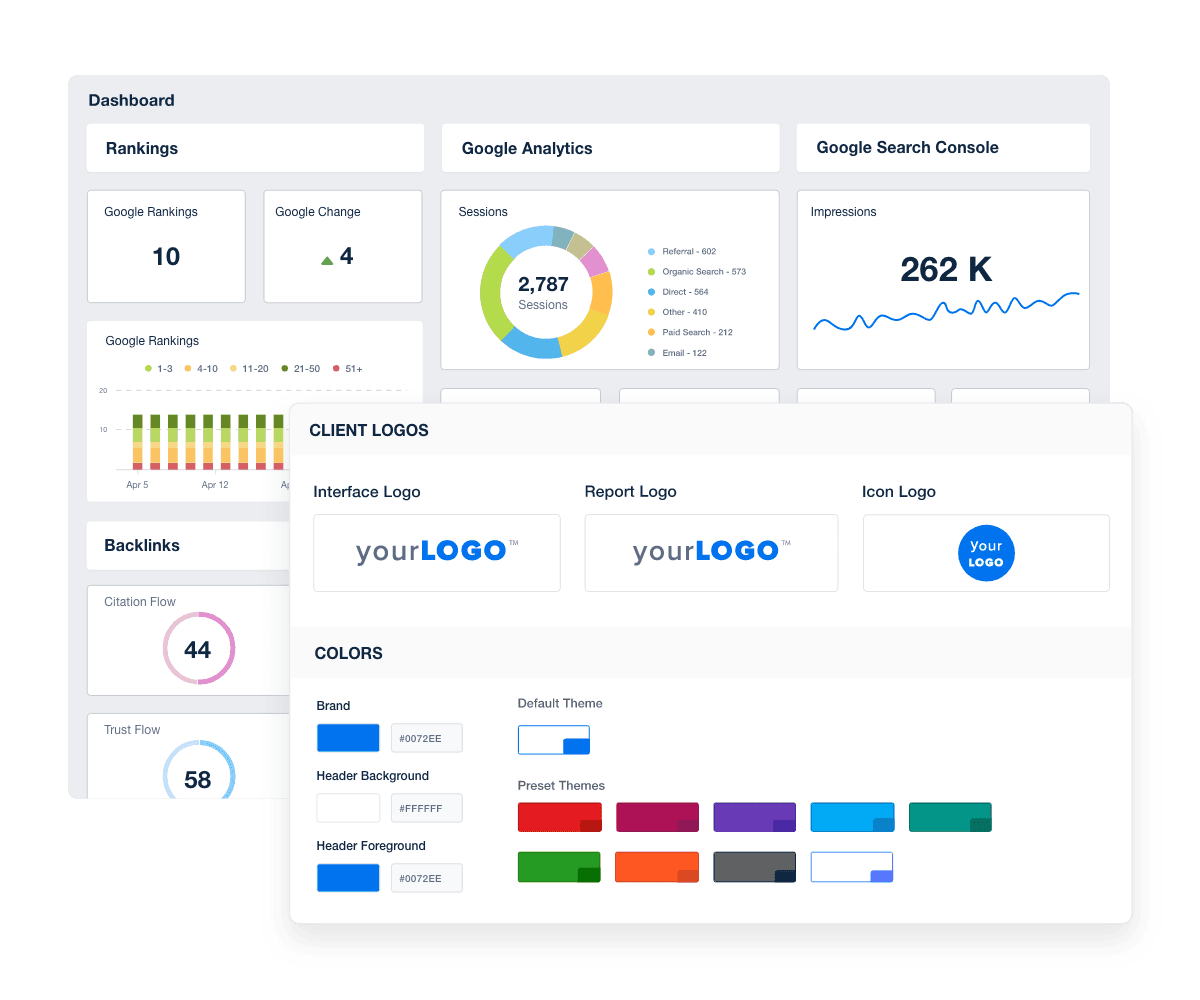
White label your agency's eCommerce reports using the only client reporting platform built for marketing agencies. Start your Free Trial today!
Summary & Key Takeaways
To navigate the ocean of eCommerce, you need more than a compass; you need a fully-fledged GPS. That's where key performance indicators (KPIs) come into play. They provide the precise coordinates to help steer your client's eCommerce businesses toward success.
One of the primary roles of KPIs is to turn the spotlight on new and repeat customers. By tracking metrics like the conversion rate and cost per acquisition (CPA), you gain insights into how many visitors are transforming into customers and at what cost.
On the other hand, the magic of the customer loyalty KPIs uncovers how many of these customers are returning for more. This is where the true treasure lies because a repeat customer spends more and requires less resource investment.
A keen eye on the customer support team's performance is equally important. Timely and effective support creates happier customers and paves the way for increased customer loyalty and, ultimately, more repeat business.
The average profit margin KPI provides insights into how much revenue your client retains after accounting for the cost of goods sold. This provides a snapshot of financial health, allowing you to steer the ship away from potentially choppy waters.
Simply put, KPIs are your compass, map, and lighthouse all rolled into one. However, picking the right eCommerce KPIs that align with your client's business goals and strategies is critical. Because, at the end of the day, while all metrics provide data, not all data drives your client's business forward.
Whether your client is a small online retailer or a large eCommerce business, with these KPIs at your disposal, you're well-equipped to guide them through any storm and help them find their treasure: sustained, profitable growth.

Written by
Alex is in product marketing, pushing the great work from the engineering team out into the world. When he's not marketing, he's probably rock climbing or researching the latest eCommerce trends!
Read more posts by Alex GirardiSee how 7,000+ marketing agencies help clients win
Free 14-day trial. No credit card required.


