31 digital marketing analytics that matter


Table of Contents
- Key takeaways
- What is digital marketing analytics
- The relationship between digital marketing and analytics
- Why tracking the right metrics matters
- Actionable analytics vs. vanity metrics
- Three ways to segment the metrics you track
- How to use the A.P.I.E. framework to turn analytics into growth opportunities
- The marketing metrics power triangle
- How to decide what makes it into the report
- 31 best digital marketing analytics to track
- 1. Website and eCommerce analytics
- 2. SEO analytics
- 3. Email marketing analytics
- 4. Social media marketing analytics
- 5. Paid ad (PPC) analytics
- 6. Local marketing analytics
- 7. Call tracking analytics
- Beyond the campaign: business metrics that show bottom-line impact
- A five-step process for reporting these metrics
- The bottom line
7,000+ agencies have ditched manual reports. You can too.
Free 14-Day TrialTable of Contents
- Key takeaways
- What is digital marketing analytics
- The relationship between digital marketing and analytics
- Why tracking the right metrics matters
- Actionable analytics vs. vanity metrics
- Three ways to segment the metrics you track
- How to use the A.P.I.E. framework to turn analytics into growth opportunities
- The marketing metrics power triangle
- How to decide what makes it into the report
- 31 best digital marketing analytics to track
- 1. Website and eCommerce analytics
- 2. SEO analytics
- 3. Email marketing analytics
- 4. Social media marketing analytics
- 5. Paid ad (PPC) analytics
- 6. Local marketing analytics
- 7. Call tracking analytics
- Beyond the campaign: business metrics that show bottom-line impact
- A five-step process for reporting these metrics
- The bottom line
7,000+ agencies have ditched manual reports. You can too.
Free 14-Day TrialThere are hundreds, if not thousands, of digital marketing metrics you can track. Very few of them are relevant or actionable when it comes to optimizing and reporting on client campaigns.
Without a system for tracking the right numbers, you end up piecing together fragmented data to quantify the impact of your team’s work, and clients start asking whether your strategies are genuinely effective or a series of fortunate creative experiments.
This article narrows it down to 31 digital marketing analytics that actually matter to an agency and their client-facing reports, plus three frameworks for prioritizing them and a five-step process for reporting them. You can also use our web analytics report template to report on the right web KPI’s to clients.
Key takeaways
Actionable metrics change what you do next; vanity metrics only make the report look good.
Thirty-one metrics across seven categories–website and ecommerce, SEO, email, social, PPC, local, and call tracking–cover almost every client campaign you’ll report on.
Traffic, conversion rate, and customer value compound: a 10% lift in all three raises revenue by just over 33%, not 30%.
Conversion metrics are the metrics that matter most to clients, according to the AgencyAnalytics Benchmarks Survey, and transparency is the number one client retention strategy for agencies.
Pulling these numbers by hand from a dozen platforms is where the hours go, so automate the collection and spend the time on the analysis.
What is digital marketing analytics
Digital marketing analytics is the practice of gathering, analyzing, and acting on data from digital platforms. It uses digital analytics tools or web analytics tools to measure how users interact with online content: websites, social media, and advertising campaigns.
By employing data analytics, agencies sift through both external data (click-through rates, engagement metrics, conversion rates) and internal customer data (behavior and preferences) to understand customer dynamics, predict future behavior, and improve campaign effectiveness. In practice it works as a compass, guiding marketing actions and investment. Build a compass‑friendly agency software stack with the essentials in our guide.
Digital marketing analytics vs. web analytics
The two are interconnected but different. Digital marketing analytics measures, manages, and analyzes campaigns across everything in your client’s digital ecosystem: social media, organic search, paid search, programmatic advertising, and more. Web analytics is limited to visitors on your client’s website. It’s part of the digital marketing world, but a tighter view of what happens after the connection between prospect and website has already been made.
The relationship between digital marketing and analytics
You need to measure and track results to optimize campaigns. There is a quote almost every marketer has come across during their career.
If it cannot be measured, it cannot be managed.
— Peter Drucker
It’s worth dispelling the myth that just because marketing is digital, everything can be measured and understood. There’s still an element of art to it, and not everything can (or should) be quantified. Even the most experienced agencies hit situations where a change in performance has its roots firmly hidden, deep in the data.
Analytics may tell you conversion rates dipped over the last six weeks without telling you why. It could be the user flow (easier to identify), competitor behavior attracting your client’s prospects (harder), or an external influence like world events or economic pressure that your agency has no control over (harder still).
It is wrong to suppose that if you can’t measure it, you can’t manage it – a costly myth.
— W. Edwards Deming
Rather than reporting on every data point under the sun, build clear client reports around the digital marketing metrics that showcase:
How well you understand your client’s business
The results you are driving on their behalf
How your agency is using its specialized capabilities to benefit the client
The progress being made on critical projects and marketing campaigns
Creative solutions to current marketing challenges
That you are staying within budget and timelines
Why tracking the right metrics matters
Clients hire an agency to get improved results, and you can’t improve what you don’t track. Few clients are happy spending money without understanding the return. According to the AgencyAnalytics Marketing Agency Benchmarks Survey, the number one client retention strategy for agencies is transparency and effective communication.

Metrics also inform budget allocation. Are the client’s PPC campaigns delivering a higher-than-expected ROI? Increase the investment. Are the paid social campaigns driving engagement but few clicks or sales? Rethink the messaging.
For your agency, tracking the right metrics:
Enhances customer satisfaction: accurate data presented regularly builds transparency, accountability, and trust.
Presents opportunities for improvement: reviewing metrics surfaces inefficiencies you can adjust in real time.
Increases competitive advantage: it sets you apart from competitors who rely solely on creative intuition.
Strengthens your portfolio: these numbers add credibility to case studies and help you win higher-profile clients.
For your clients, it clarifies how the business is performing within its niche, confirms your activities align with their goals, demonstrates the return on their investment, and replaces guesswork with informed decisions.
Actionable analytics vs. vanity metrics
Before the 31 metrics, it’s important to understand the difference between actionable metrics and vanity metrics.

Actionable metrics tell you whether campaigns are meeting the goals you set, and point at what to change. Vanity metrics might make you or your client feel good (hence the name) but they don’t provide relevant insight.
Ex: Is your goal generating more leads from your client’s website? A relevant metric would be the number of leads that you generated last month or the lead capture conversion rate from the landing page. A vanity metric may be the total number of subscribers, no matter what their age or status, currently in the database.
Vanity metrics, by and large, are a waste of time for both you and the client. Trying to show improved metrics to make you look good will take away from your efforts of reaching the actionable metrics that will prove your marketing worth to the client.
Nathan Hawkes, Arcane Marketing
A vanity metric can still work as a barometer early on. In the first couple of months of an SEO campaign, impressions show visibility is rising and the campaign is moving in the right direction, before the leads arrive.
Metrics, KPIs, and business metrics
Are KPIs the same as metrics? Not quite. A metric measures some aspect of a client’s business. A Key Performance Indicator directly relates to the primary goals of a project, such as Marketing Qualified Leads or Sales Qualified Leads from an eBlast campaign. Business metrics like Customer Lifetime Value give a broader view of financial health and operations.

Track both. KPIs keep project objectives on course, business metrics keep the big picture in view, and together they stop you reporting vanity metrics that look like performance but don’t align with client goals.
Three ways to segment the metrics you track
If you can measure it, it can become a metric, so it helps to look at the full set through a lens. Three work well: objective, funnel stage, and channel.
1. Selecting metrics based on key objectives
Objective-based metrics measure performance against what you’re trying to achieve: website visits, conversion rates, email open rates, cost per acquisition, return on ad spend. Business objectives vary, and so do the metrics that reflect progress toward them.
Business objective | Examples of marketing metrics |
|---|---|
Sales or revenue metrics | Total Sales, Revenue Growth Rate, Average Revenue per Sale, Gross Profit Margin |
Lead metrics | Leads Generated, Marketing Qualified Leads, Sales Qualified Leads, Lead Conversion Rate |
Cost metrics | Customer Acquisition Cost, Cost per Lead, Cost per Click, Return on Marketing Investment |
Brand awareness metrics | Brand Recognition, Brand Recall, Brand Sentiment, Share of Voice |
Website or foot traffic | Total Visits, Unique Visitors, Bounce Rate, Page Views per Visit |
Conversion rates | Conversion Rate, Shopping Cart Abandonment Rate, Call-to-Action Click-through Rate |
Average customer value | Average Purchase Value, Purchase Frequency, Customer Lifetime Value |
Reputation management metrics | Net Promoter Score, Customer Satisfaction Score, Online Reviews and Ratings, Social Media Mentions |
Customer lifecycle / customer lifetime value | Customer Retention Rate, Customer Lifetime Value, Repeat Purchase Rate, Existing Customer Growth Rate |
Growth rate | Revenue Growth Rate, Customer Growth Rate, Market Share Growth Rate |
Two things to hold onto. A keyword with a low cost per click is great, but cheap traffic that doesn’t generate revenue or qualified leads helps nobody. And a higher customer lifetime value can justify a higher customer acquisition cost.
2. Using marketing funnel metrics (ToF, MoF, and BoF)
The second lens is where the user sits in their purchase journey, which maps onto the AIDA framework of Awareness, Interest, Decision (or Desire), and Action.

Funnel stage | What you’re measuring | Examples of marketing metrics |
|---|---|---|
Top of funnel | Capturing attention at first touch | Website traffic, blog views, PPC clicks, social interactions, social media reach, brand awareness, cost per thousand impressions (CPM) |
Middle of funnel | The consideration phase, as prospects move closer to a purchase decision | Engagement metrics (likes, shares, comments), email open rates, email signups, add-to-cart rates, cost per lead, marketing qualified leads, product qualified leads (typically for SaaS businesses) |
Bottom of funnel | Performance at the opportunity and customer level | Conversion rate, shopping cart abandonment, lead qualification rates, sales qualified leads, sales, revenue, reorder rate, customer acquisition cost, retention metrics, customer lifetime value (CLV), net promoter score, marketing ROI |
Measuring at each stage shows where you’re engaging prospects well and where there’s room to improve, and keeps the difference clear between a marketing qualified lead at the top and a sales qualified lead near the bottom.
3. Breaking them down by channel
Email marketing needs different metrics than organic search or pay-per-click. Each tactic has its own set of key digital marketing metrics, which is how the 31 metrics below are organized.
How to use the A.P.I.E. framework to turn analytics into growth opportunities
A.P.I.E. stands for Assess, Plan, Implement, and Evaluate. It works for both digital marketing analytics and web analytics.

Assess: review the client’s current efforts using analytics data. Are you solving problems with their SEO or campaign performance, or are they on a solid trajectory and looking for the next level? Put benchmarks in place and establish a growth forecast.
Plan: map how you’ll improve results, whether that means changes to campaigns, the website, or both. Expect new opportunities and issues to arise during the process.
Implement: put the plan into action and annotate when each key step was executed, so you can measure the impact of each element.
Evaluate: review the results and adjust. Did things get better? By how much, and what drove it? If not, why not?
A.P.I.E. is repeatable and iterative, and it doubles as a sales tool: showing your preliminary assessment expertise helps land more clients with an SEO proposal. If it’s not for you, S.M.A.R.T. goals are a go-to alternative for setting expectations with both the team and the client.
The marketing metrics power triangle
The power triangle explains the relationship between the three key levers in marketing performance:
Traffic: how many people are driven to a website or physical location.
Conversion: how often those visitors become paying customers.
Customer value: how much each customer spends, usually AOV for eCommerce clients or MRR for SaaS and business services.

How the power triangle drives compound growth
Improving any one lever increases revenue. Improving all three compounds. Start with a client on 10,000 visitors a month, a 2% conversion rate, and $400 average spend.
Scenario | Visitors per month | Conversion rate | Average spend | Monthly revenue |
|---|---|---|---|---|
Baseline | 10,000 | 2% | $400 | $80,000 |
10% more traffic only | 11,000 | 2% | $400 | $88,000 |
10% across all three | 11,000 | 2.2% | $440 | $106,460 |
You’d be forgiven for expecting three 10% gains to add up to 30%. Because they compound, the total increase comes in at just over 33%.

Let any one lever fall dramatically and the whole revenue picture collapses, which is why the triangle works as a troubleshooting flowchart. It identifies leaks in the acquisition pipeline and surfaces the low-hanging fruit.
Example: balancing an eCommerce client’s funnel
Say you’re optimizing an eCommerce client’s funnel. You invest in SEO and organic traffic climbs. If the conversion rate stays flat, that extra traffic won’t pay back, so you improve the site’s user experience, product descriptions, and checkout flow until more visitors turn into customers. Then you lift average order value through bundling, upselling, and cross-selling.
High traffic with low conversions is a signal to reassess the funnel or the user experience. High conversions with low AOV points toward upselling or increasing perceived value.
How to decide what makes it into the report
As Cheryl Ingram, Managing Director of The Digital Media Collective, advises: report on what’s necessary rather than everything and anything. Your client report templates need to be meaningful, understandable, and include the most important pieces.
I always look at data and ask myself SO WHAT? If the report doesn’t answer The SO WHAT question, then don’t send it.”
Cheryl Ingram, The Digital Media Collective
1. Show the big picture
Track conversions from every channel–email, Google Ads, SEO, social–and look at them together. Website visitors over time reveal trends that a single month can’t, and the whole picture surfaces problems faster than handing a client raw data ever will.
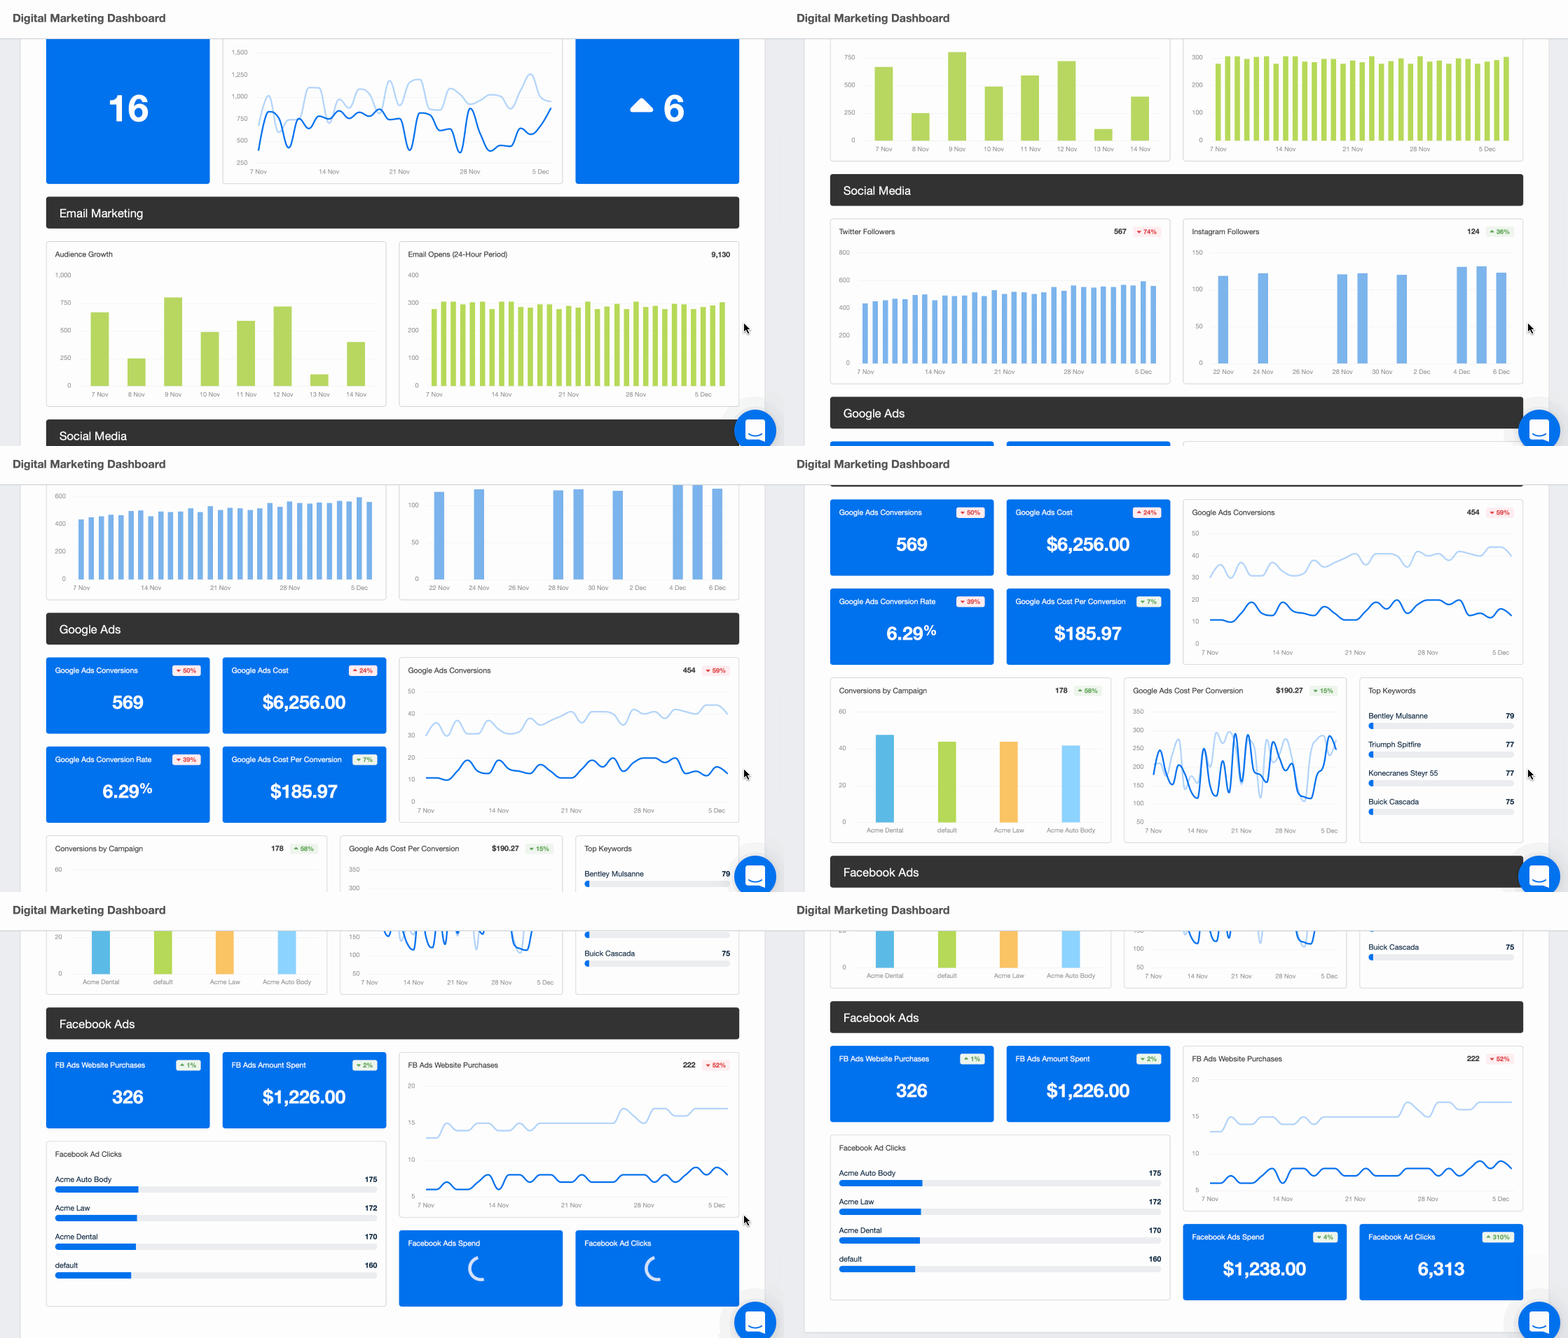
Use the Digital Marketing Dashboard to convey your agency’s digital marketing success, or check out the other dashboard templates available on the platform.
2. Keep it simple
Sifting the data before you send it is what catches the outliers. Low email open rates alongside high click-through rates points at subject lines or preview text. Identify which KPIs and metrics matter most and build the insight around those.
Clients want to see real-time data and analytics, but they don’t understand metrics or look at metrics the same way we do. To us, a conversion from PPC is a call. To a client, a conversion is money in the bank. So, having the ability to show SEO & PPC results with traffic next to a revenue number–speaks volumes.
Ruben Roel, Investigator Marketing
3. Customize for maximum impact
Select KPIs that work for both short-term optimizations and long-term planning. Too little data and the client wonders what’s happening; too much ends in analysis paralysis. Run the fact-finding in your discovery meeting or client onboarding process so you know what matters to them, then add the metrics that showcase your team’s performance.
Most clients don’t want seven reports, one per platform. They want everything condensed into one easy-to-read report.

Whatever you land on should align with the client’s objectives. Conversion metrics are vital if the goal is online sales. If brand awareness is the focus, reach and impressions are more appropriate.
31 best digital marketing analytics to track
These are the digital marketing analytics to track in your digital marketing reporting tool, classified into 7 fundamental types:
1. Website and eCommerce analytics
These core metrics stop you planning campaigns in the dark. Website data gives you customer preferences, interests, spending patterns, and demographics. Ecommerce data shows store performance and the barriers to revenue growth.

Bring all your clients’ marketing metrics under one roof by combining Google Analytics with over 85 other marketing platforms. Start your free 14-day trial today.
Website visitors
Website traffic is the most fundamental of these metrics. Use it to see which channels drive traffic and which need attention. The pure number matters less than the trends, patterns, behavior, and sources.
It breaks down into sessions, unique visitors, page views, and unique page views. Sessions is the important one: it tells you how many times people visited and how often they come back. It’s the equivalent of foot traffic in retail, and a decline is an early flag. The “unique” versions strip out repeat visits to give you the addressable audience.
New vs. returning visitors splits that audience in two. A healthy mix means the client is attracting new customers while retaining existing ones.

Track the analytics that matter most to your clients with our website analytics dashboard. Test it out with a 14-day free trial.
Bounce rate
Bounce rate indicates how well the site engages visitors, but it only means something in context. Bounce rates in GA-4 vary by device, industry, and content type, so compare against industry benchmarks.

Running a content marketing campaign for a real estate agency? Factor in both industry and content type to set a realistic blog bounce rate benchmark.
Conversions and goals
Conversions are user actions that align with business goals: completing a purchase, signing up for a newsletter, filling out a contact form, downloading a resource. Agencies that focus exclusively on sales as the conversion point miss growth opportunities, so track micro-conversions too. Goals are a subset of conversions, since a user can hit certain goals without submitting a form or an order.
According to the AgencyAnalytics Benchmarks Survey, conversion metrics are the metrics that matter most to clients.

Agency Tip: If your client is launching a new product, a conversion could be signing up for a pre-launch announcement email, but a goal could be watching the teaser video. Set custom goals to monitor the progress against both of these KPIs (Key Performance Indicators).
Conversion rate
Conversion rate tells you how many visitors took the desired action. What matters more is whether it’s improving or declining over time. It gives you a read on five drivers: the right audience, the right product, the right user experience, the right message, and the right time. A/B testing, page design, and customer experience work are the usual levers.
Cart abandonment rate
Cart abandonment rate is the percentage of users who add items to the cart but don’t buy. A high rate points at friction in the shopping experience, and gives your agency a clear brief: improve the checkout UI, or send follow-up emails.
Refund and return rate
The percentage of orders returned or refunded. Monitoring it helps clients identify product problems, adjust their offerings, and improve the customer experience.
Average order value (AOV)
AOV is how much revenue a client generates per transaction. A high AOV means the store is driving quality sales without needing more traffic or a better conversion rate, and it’s the number behind pricing and bundling decisions.


No more fishing for the metrics that matter–use AgencyAnalytics’ Shopify, Stripe, and Google Adwords integrations to consolidate ecommerce metrics into beautiful reports your clients easily understand. Try it free for 14 days.
Revenue
Revenue is the goal and one of the hardest metrics to attribute, because pricing changes, seasonality, economic conditions, and the customer journey all move it. It also opens the attribution model debate over which channel claims a conversion. Google Ads alone offers everything from first click to last click and a range in between.

Breaking revenue down by product or service shows which offerings are most in demand and which are wasting resources.

That view lets you recommend focusing spend on top sellers, optimizing pricing, bundling high-demand items with slower movers, or discontinuing what isn’t working. Part of your role is understanding the revenue each campaign drives, and how those campaigns support each other.
Acquisition channels
Dig into where the traffic comes from and how that compares to industry benchmarks. Typically the largest drivers are Direct and Organic, followed by Paid Search and Referrals, though that shifts with site maturity, client focus, and budget.

A startup client leans on paid ads and social while brand awareness and site authority are built. Over time paid falls as a percentage of total sales, either naturally as other channels grow or deliberately as you shift budget away from under-performers. Keep a finger on every channel, even the ones you aren’t managing yet.

Source: Hubspot
You may also like 15+ Most Important Ecommerce Metrics & KPIs to Measure Client Success
2. SEO analytics
Even if SEO isn’t your focus, SEO analytics are worth tracking. SEO reports for clients take a few minutes to set up and show how the work is paying off, the long-term benefits of the SEO work, and where to focus next.
Content sits alongside these numbers. Content metrics such as page views, time on page, click-through rate, engagement, reach, and leads generated tell you which content resonates and which topics deserve more investment.

Automatically create and send SEO reports for clients using a customizable SEO dashboard or SEO report template. Try AgencyAnalytics free for 14 days!
Organic traffic
Organic traffic is visitors arriving through unpaid search results, and it’s the clearest long-run read on your SEO work. Don’t expect it to skyrocket at launch; what matters is the direction of travel. High organic traffic also signals content quality and relevance to search intent.

Then look at what those visitors do: bounce rate, time on page, and new versus returning tell you whether you’re engaging the right audience.
Create a comprehensive SEO dashboard in minutes. Try AgencyAnalytics free for 14 days!
SEO site health
Site health gives an overall score plus detail on the factors behind it: page speed, mobile-friendliness, common SEO errors. Slow loading hurts user experience and organic search visibility, so it’s worth holding the web team to this one.
Read more about how to perform an SEO Health Checkup.
Domain authority
Domain Authority estimates how likely a site is to rank and predicts changes in search rankings. 100 is the maximum, but the chances of getting there are slim. Google.com has an Authority Score of 99, and SEMrush only scores 79 on its own tool. The floor is 0, usually a brand new site with minimal content and no backlinks.

This range guide answers the questions clients ask: is my authority score any good? When can we get it to 90? Why didn’t it increase last month?
DA score | What it means |
|---|---|
0-19 | A new site with minimal content, social shares, or backlinks. With consistent SEO and content work you should see it grow a little each month, though it can take a few months post-launch to see initial gains, and plateaus are normal. |
20-39 | Your agency is making headway on a new or previously ignored site. Perfectly acceptable for a local or niche business with minimal competition. A lot of agencies get stuck here, so breaking into 40+ matters if you want to tackle competitive keywords. |
40-59 | The sweet spot for many agencies working with small businesses, and a sign you’re developing the domain well. No matter how hard you try, you may never move a client above 59. |
60-79 | Elite company. Only a small percentage of websites score in this range, and a one-point increase here takes far more effort than a 10-point gain at the first level. |
80+ | The best of the best, typically only well-known brands or enterprise companies. |
Keyword rankings
Keyword ranking shows where a term sits in search results. The higher the ranking, the more likely people are to find and click your client’s site. There are plenty of rank tracking tools available, but we–of course–recommend the AgencyAnalytics keyword rank tracker.

Rankings mean little if you’re targeting the wrong terms. For a well-known client, branded search is a weak measure of your work; the unbranded searches that don’t mention their name are where the growth is. Strong rankings that aren’t generating traffic point at keyword volume or click-through rate. If it’s CTR, adjust the title and meta description.

Automatically track the keyword rankings for new content using the built-in SERP Rank Tracker. Try AgencyAnalytics free for 14 days!
Backlinks generated
Track new and lost backlinks with a backlink monitor tool, and look at anchor text, Trust Flow, and Citation Flow so you know how good the links are, not just how many.
Google can’t yet make a qualitative decision about a website. It can tell what it’s about, but it can’t tell if it’s important or useful just by reading the site. One of the main factors it uses to determine importance is backlinks because these act as “votes of confidence.” If it trusts the sites that are linking to you, you get a portion of those referring sites’ trust. It’s just that simple.
Jens Rhoades, Floodlight SEO
According to the HubSpot State of Marketing Report, these are the metrics businesses use to measure SEO success:

Read more about the important SEO metrics to track.
3. Email marketing analytics
Email is still one of the most cost-effective channels available, with the highest conversion rates and contacts that keep giving back.
Email list growth
List growth rate measures your ability to grow the client’s audience, and it feeds other channels by creating a multi-funnel approach to acquisition. A growing list points to successful outreach and engaging content.
If the immediate return on ad spend between Facebook Ads and Google Ads is identical but Facebook drives four times the email signups, shift budget to Facebook. Same current revenue, higher future potential.
Email response rates
Track open rate–the percentage of recipients who open out of the total delivered, which reflects subject lines and preheader text–and click-through rate. Most platforms also show where people click within the email and which devices they use.
There’s a balancing act in maximizing the KPIs for an email campaign. Nobody clicks an email they didn’t open, but chasing open rate with catchy, disconnected subject lines improves one metric at the expense of the others. As with the power triangle, the goal is to get the right people opening.
Email rarely lives on its own. It usually drives traffic to the website or social profiles, which is why email metrics belong next to website metrics rather than in their own silo.


Communicate your agency’s success in driving revenue and ROI with a customizable Email Marketing Report Template. Try AgencyAnalytics free for 14 days!
Email deliverability
Deliverability tells you whether emails are reaching inboxes at all. Spam filters, blacklists, and bounces all affect it, and providers like Gmail and Yahoo change their algorithms constantly, so it needs watching rather than assuming.
Email bounce rate
Email bounce rate is the percentage of emails that can’t be delivered. It’s a strong indicator of list health and tells you when to spend time cleaning the list.

Unsubscribe rate
Every campaign loses a few recipients. If the number creeps above past averages or email marketing benchmarks, the messaging isn’t as relevant as the client would like. A 2021 report by Campaign Monitor put the average unsubscribe rate at 0.1%, with healthcare services among the highest at 0.3% and retail close to the average.
Why do they leave? According to Hubspot’s State of Marketing Report, more than half of people who unsubscribe do so because they’re contacted too frequently.

The trick is working out what “too frequently” means to that audience. Daily is usually too often. Weekly or monthly depends on the client, the content, and the appetite to receive it.
Monitor unsubscribe rate, click-through rate, open rate, and bounce rate through the Mailchimp, Constant Contact, or Active Campaign integrations.

Create Automated Campaign Monitor reports for your clients and present robust email analytics in an engaging format. Try AgencyAnalytics free for 14 days.
Read more about important Email campaign metrics.
4. Social media marketing analytics
Whether the focus is Instagram metrics, Facebook data, or LinkedIn analytics, engagement, reach, followers, clicks, and conversions make up a successful social campaign. Which matters most depends on the client’s lifecycle stage. A new business creating buzz cares about Facebook Ad metrics like reach and new followers. A client launching a product leans on YouTube metrics and whether they’re gaining organic ground on YouTube. An established eCommerce business focuses on conversions, because followers don’t always become customers.

Track likes, comments, shares, clicks, and saves for every platform your client uses in one place, pulling from more than 85 marketing platform integrations.

Create dedicated reports to showcase Instagram, Facebook, LinkedIn, or YouTube performance, or create your own social media dashboard to consolidate social media metrics from all platforms in just a few clicks. Try it free in AgencyAnalytics for 14 days.

Automated Client Reports, Ready in Just a Few Clicks
Engaged social followers
Followers show reach and influence, but the total matters less than the trend and the engagement behind it. A steady increase means the content is landing; slow growth suggests adjusting content, timing, or targeting. Growth by platform also tells you where your client’s audience actually is.

Post engagement
Post engagement measures interactions with a piece of content: Likes, Comments, Shares, and Clicks. Sometimes dismissed as a vanity metric, engagement rate shows how connected the audience is to the brand, and it moves fast enough to act on mid-campaign.


Keep an eye on critical social media analytics across multiple platforms with one social media dashboard. Try AgencyAnalytics free for 14 days.
Best posting times
There’s no set best time to post. It depends on the audience and the brand, and you find it through testing. If you need a starting point, Sprout Social suggests these posting times drive the most engagement per platform.

Read Next: The Ultimate Guide to Social Media Analytics.
5. Paid ad (PPC) analytics
Paid search analytics help you optimize ad campaigns so client budget goes further. Google Ads metrics point at what to fix in targeting, budgeting, and messaging. Tracking it all in one platform also lets you compare ROAS or cost per marketing qualified lead across Google, Meta, and LinkedIn side by side.

Use a PPC Dashboard to highlight your agency’s success with paid ads. Google Ads is just one of the over 85 platform integrations included at no extra cost. Try AgencyAnalytics free for 14 days!
Cost
Paid campaigns get expensive, so track spend against budget. The total budget may look like a vanity metric, but staying on it is not. Watch cost per reach alongside it: it measures what you pay to reach each member of the target audience, and helps ensure there’s enough budget to keep ads visible for the whole campaign.
Agency Tip: Setting your client’s budget up as a custom goal will help keep your agency aligned on the total monthly spend.
Click-through rate (CTR)
CTR measures the effectiveness of a paid ad campaign: clicks divided by impressions, with little room for interpretation. A high CTR means the ads are relevant to the keywords being targeted, at least enough to convince a searcher to click.
Agency Tip: Although CTR is less important than some other metrics, it can be an indicator of ad quality or keyword targeting issues that will lead to increased costs.
Cost per click (CPC)
CPC is what you pay each time someone clicks an ad. It’s the foundation of the cost metric: the higher you’re willing to bid, the higher the daily spend.
Agency Tip: Don’t get caught up in a bidding war to win positions for keywords that don’t perform well for clients. Focus on the bottom line and adjust the CPCs accordingly.

Use the AgencyAnalytics PPC dashboard to consolidate key metrics from all your clients’ PPC campaigns. Try it free for 14 days!
Cost per action (CPA)
CPA is what you pay for a completed tracked action, such as a purchase or a newsletter signup. It shows whether campaigns are driving the right kind of clicks. A low CPA means the budget is working; a high one means resources are going to waste.
The COVID-19 pandemic shifted a lot of these numbers. The average cost per acquisition on Bing has crept above Google’s, although Bing Shopping remains fairly cost-effective.

Zoom out one level and you get client acquisition cost (CAC), the total cost of landing a new customer. CPA prices a specific action; CAC prices the customer.

Return on ad spend (ROAS)
ROAS takes CPA further by adding revenue, comparing what you spent to acquire a customer against what that customer generated. The industry average on Google Ads is 200% (2x), but you need the client’s own target. Are they willing to take a loss on the first purchase to win a long-term customer, or do they need to be profitable on that order?
Want to dig deeper into Google Ads Metrics? Read 11 Critical Google Ads Metrics Agencies Should Monitor Daily!
6. Local marketing analytics
These overlap with the metrics above, with far more focus on local detail:
Local SEO metrics – localized search rankings and NAP placements (Name, Address, Phone Number) in local directories.
Local search PPC metrics – targeted campaigns and GLSA campaign performance.
Local social media metrics – standard likes, follows, and shares, with a focus on local content and engagement.
Reviews and reputation management – review reports track reputation within the community.
Usage of maps and directions – can users find the business on maps and locate the closest outlet?
Call tracking – which leads to the next category.

Working with a local client? You might also enjoy reading How To Create Local Marketing Reports.
7. Call tracking analytics
Call tracking shows how effective digital campaigns are at driving offline behavior. With a call tracking app, you can see which campaigns generate the most calls, leads, and revenue, then adjust accordingly.
Call volume
The top-level count of calls generated by client campaigns. Phone calls are valuable, especially in services businesses with high-value customers, because someone who calls is typically ready to buy. Marketing Dive notes inbound lead calls convert at 25 to 40%. Against an average lead form conversion rate of 2%, calls turn prospects into buyers at 12 to 20 times the rate.
Call source
Any call tracking is incomplete without knowing what drove the call. This is what tells you which campaigns and platforms deserve more budget.
With a dedicated Call Tracking dashboard, collect data and report on results in real time. Take AgencyAnalytics for a test drive with a 14-day free trial!
Call status
A placed call isn’t a completed connection. If the client operates 9 a.m. to 5 p.m. but you have call-driving campaigns running after hours, those calls go unanswered, and unanswered calls mean lost customers.
According to a study by Call Centre Helper, these are the average handling times for the most common touchpoints:

Social media isn’t in those benchmarks because the study found too much variance between participants to nail down an average.
Check out this article for more information: Call Tracking Analytics: The Top 5 Metrics You Should Track
The 31 metrics at a glance, by channel
Marketing channel | Examples of marketing metrics |
|---|---|
Website metrics | Total Traffic, Bounce Rate, Average Session Duration, Pages per Session, Conversion Rate, often from Google Analytics data |
Paid marketing metrics | Click-through Rate, Cost per Click, Conversion Rate, Cost per Lead, Return on Ad Spend |
SEO marketing metrics | Organic Traffic, Bounce Rate, Keyword Rankings, Backlink Count, Click-through Rate from Search Results |
Content marketing metrics | Page Views, Time Spent on Page, Social Shares, Conversion Rate, New vs. Returning Visitors |
Social media marketing metrics | Follower Count, Engagement Rate (likes, shares, comments), Click-through Rate, Conversion Rate, Retention Metrics |
Email marketing metrics | Open Rate, Click-through Rate, Conversion Rate, Unsubscribe Rate, Bounce Rate |
Local marketing metrics | Google My Business Views, Clicks to Call, Clicks for Directions, Local Keyword Rankings, Reviews and Ratings |
Beyond the campaign: business metrics that show bottom-line impact
The 31 metrics above measure campaigns. These measure the business your campaigns feed, and adding them moves the conversation from what the ads did to what it did for the company.
Monthly recurring revenue (MRR)
MRR is the steady income from subscriptions or ongoing services. Stable or growing MRR reflects customer satisfaction; a decline signals a change is needed.
Net revenue retention (NRR)
NRR tracks revenue retained from existing customers, accounting for upsells, cross-sells, downgrades, and churn. It’s a key indicator of long-term financial stability.
Customer lifetime value (CLV)
CLV is the total revenue from a customer across the whole relationship. It guides which products to develop and where to put budget, and it’s the number that justifies a higher acquisition cost.
Customer retention rate (CRR)
CRR is the percentage of customers a business keeps over a period. A higher rate correlates with stronger loyalty, lower marketing costs (retention is cheaper than acquisition), and more long-term revenue.
Net promoter score (NPS)
NPS measures how likely customers are to recommend the client’s products or services, making it a strong read on reputation and satisfaction, and on client retention.

Monitor these alongside CPA and net profit in one dashboard rather than pulling them from spreadsheets and CRMs by hand. Multi-Factor Authentication and Single Sign-On keep the client’s sales data secure.

Use the Hubspot or Salesforce integrations from AgencyAnalytics to pull the most relevant metrics for your clients into digestible reports. Try it free for 14 days.
Impress clients and save hours with custom, automated reporting.
Join 7,000+ agencies that create reports in minutes instead of hours using AgencyAnalytics. Get started for free. No credit card required.

A five-step process for reporting these metrics
1. Define shared agency and client goals
Define goals that align with the client’s strategic objectives, so every metric you monitor is relevant. “Increase revenue” or “get new clients” isn’t specific enough. Get clear on what success looks like, then set lead and lag measures underneath it.
2. Determine a reporting cadence
Set a timeline that balances frequency with usefulness–weekly, monthly, or quarterly–so clients get timely updates without being overwhelmed. The regular rhythm is what keeps expectations aligned.
3. Create automated metrics reports
Use one platform instead of pulling from multiple sources by hand. With built-in integrations from over 85 marketing platforms at no extra cost, you collect, visualize, and analyze the data in one place. AgencyAnalytics is built specifically for marketing agencies, with advanced reporting and automated scheduling.
Reporting method | Pros and cons |
|---|---|
Manual reporting | Pulling data from various platforms and compiling it by hand gives complete control over what’s included, but it’s time-consuming and prone to human error. |
Platform-specific reporting | Platforms like Google Analytics offer their own reporting. It saves time and reduces error, but often lacks customization and may not include all the data you need. Handling multiple platforms means multiple disjointed reports. |
Automated reporting software | Software like AgencyAnalytics automates collection and generation while allowing customization for specific client needs, delivering accurate, comprehensive reports efficiently. |
Manual reporting is where the hours disappear. Cobbling data together and taking screenshots takes time from the billable hours you could spend delivering value, and it introduces errors, including the classic of reaching the end of a report and realizing you pulled a different date range for one platform.

Use AgencyAnalytics’ AI features to automate complex data analysis, uncover hidden insights, and create personalized, actionable reports that impress clients and fuel growth. Try it free in AgencyAnalytics for 14 days.
Related: How To Create a Metrics Dashboard for Clients
4. Use data visualization in your reports
No client wants to decipher endless Excel spreadsheets. Use pie charts, progress bars, bar graphs, or geographic maps to turn complex data into digestible takeaways.

All AgencyAnalytics report templates include visualization tools to transform complex metrics into digestible insights clients love to see. Start your 14-day free trial to see what you can create.
5. Regularly review and adjust your key metrics
Check in with clients to gauge how the current set is landing. Priorities shift, projects close, products launch, and they’ll have ideas for new metrics. Regular check-ins surface those needs so you keep capturing the most relevant data.

Combine data from multiple integrations into custom metrics to track the exact performance indicators you’re after. Start your 14-day free trial to test it out with AgencyAnalytics.
The bottom line
There’s a wide range of digital marketing analytics available at any moment, and it’s easy to get overwhelmed by data from the website, paid ads, email, automation, and social. Narrow the focus to the 31 that matter, drill deeper only when a number moves, and you keep a stronger finger on the pulse of every client campaign. Follow up on the business metrics with industry benchmarks, too, so you know whether a client’s numbers are healthy for their sector.
The remaining challenge is breadth: this data lives across dozens of platforms, and gathering it can take hours or days of logging in, copying, compiling, and summarizing before anything reaches the client. That’s time not spent optimizing campaigns or onboarding new clients. The right analytics tools and a digital marketing report template collapse that into one place, with custom metrics where the standard ones don’t fit.
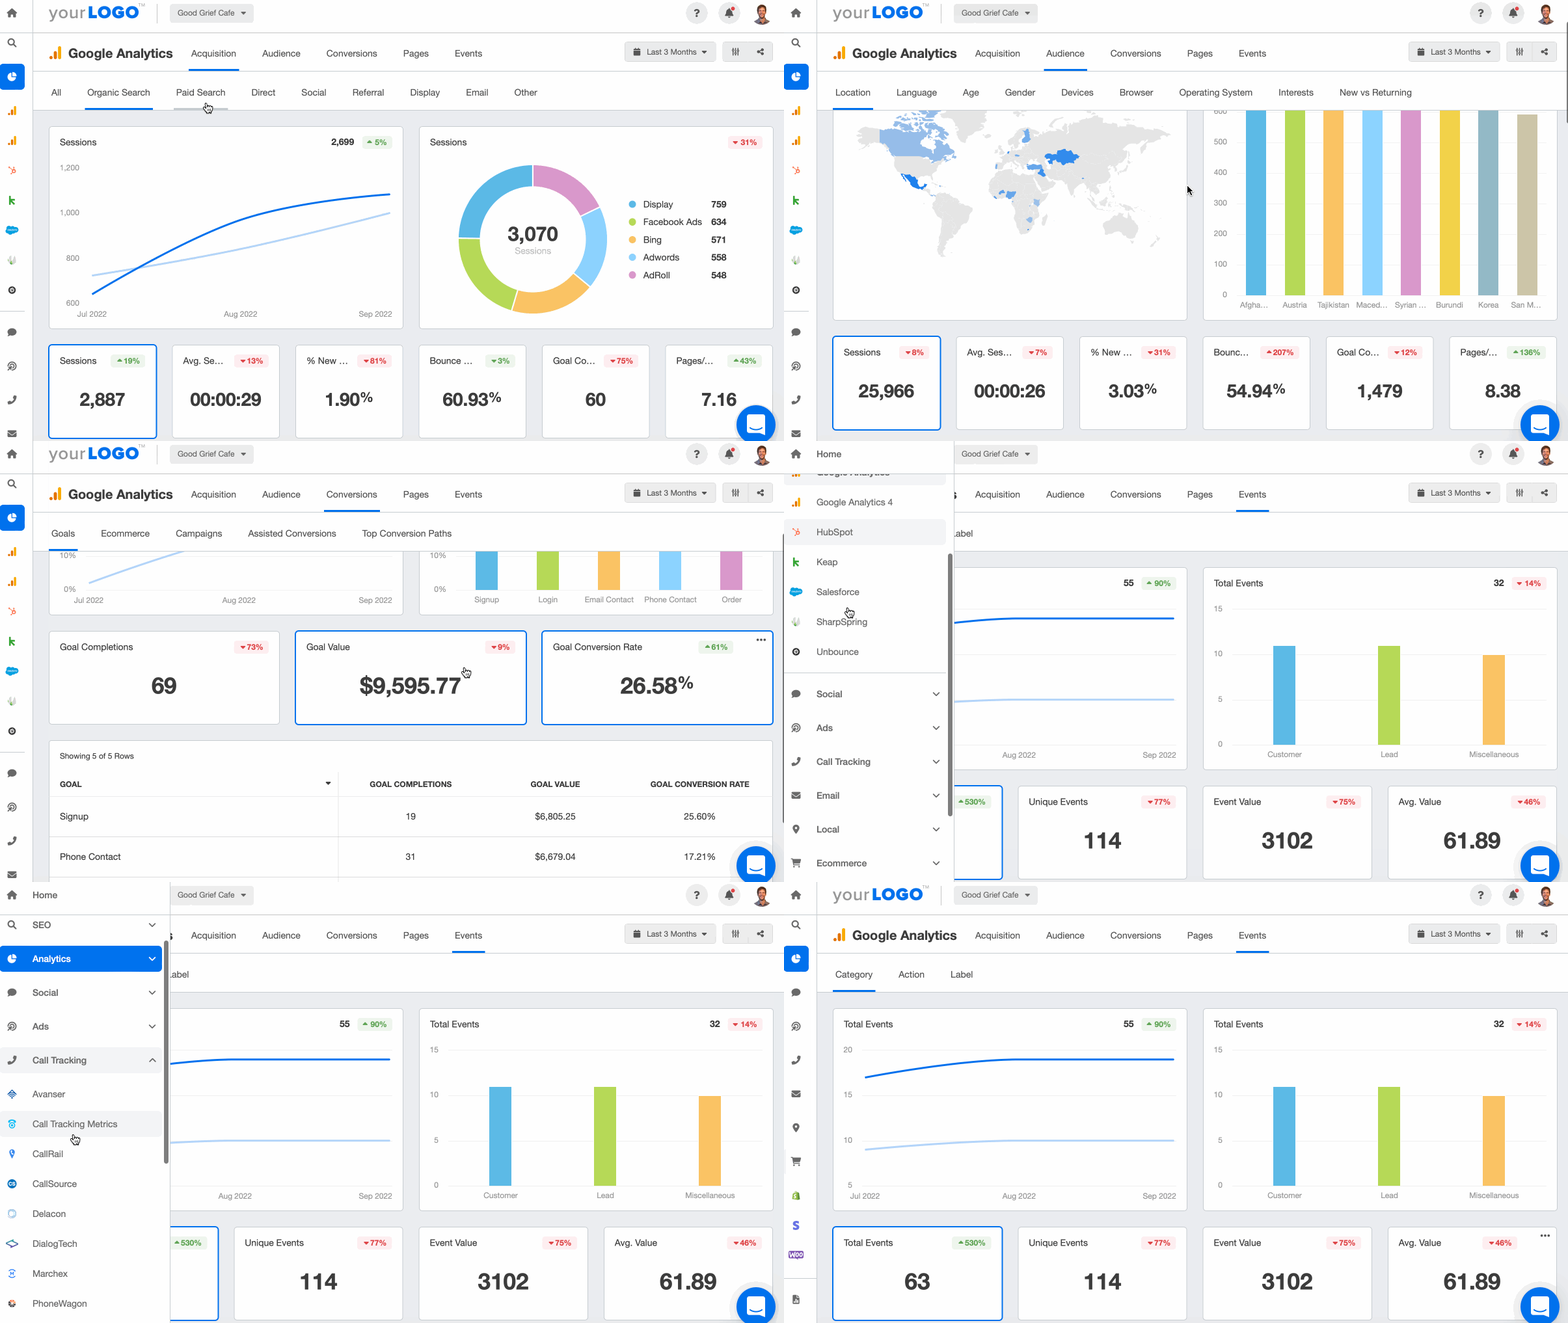
With a digital marketing dashboard, your team tracks ad spend, SEO keyword rank, conversion rate, revenue, and more from a single, real-time platform.
Save hours each month by automating data retrieval and housing all your clients’ metrics under one roof. Start your free 14-day trial today and discover why over 7,000 agencies use AgencyAnalytics.
What other digital marketing analytics do you think are important for agencies to track? Join the conversation on LinkedIn or Facebook!
Paul Stainton is a digital marketing leader with extensive experience creating brand value through digital transformation, eCommerce strategies, brand strategy, and go-to-market execution.
Read more posts by Paul StaintonWhat other agency experts are reading

What is data-driven marketing? The unofficial guide
Learn how to build a data-driven marketing strategy.

Google Ads vs. Facebook Ads: Which is Better?
Compare Google Ads vs. Facebook Ads to determine which platform is better for your goals. Explore the pros, cons, and strategies to maximize ROI.

What is a Good CTR? Is Your Click-Through Rate Good Enough?
Click-through rate is arguably one of the most common metrics for digital marketing ad campaigns. And this is for good reason! Average click-through rate informs you about the number of people clicking on your ads compared to everyone who sees them, usually your target audience.