Table of Contents
QUICK SUMMARY:
Instagram metrics gauge the performance of content on this popular social media platform. Instagram data reveals user interest and guides future Instagram campaign strategies. Monitoring Instagram performance metrics helps identify trends and areas for improvement. With Instagram's vast user base, understanding these analytics is key to growing client accounts and enhancing engagement, ensuring business goals align with social media strategies.
Instagram remains a powerhouse for digital marketers. But with shifting algorithms, new features like Reels and Stories, and more competition for attention, understanding your performance data is more important than ever.
With over 2 billion eyes glued to the platform, and so many of them following brands, the potential for client growth is ridiculous! But as any savvy marketer knows, it's not just about the numbers–it's how you make those numbers count. That's where Instagram metrics come in. Think of them as your mission control, letting you see what's working, what needs a boost, and how to steer your clients toward social media stardom.
The question is: Which metrics matter most? How do you turn those insights into action for your clients?
In this article, we're going to dig a little deeper. I'm talking about the 11 key metrics that should be on every marketing agency's watchlist. Consider these your secret weapons for understanding what makes your clients' audience tick and how to deliver results that speak for themselves.
What Are Instagram Metrics?
Simply put, an Instagram metric is a measure of performance that allows you to track key data on how your client’s content is performing. This way, you use your Instagram analytics tools to decide what type of content generates the most user interest based on your clients' goals. Over time, you’re better able to expand on high-performing content, make recommendations for future Instagram campaigns, and even discover demographics of untapped markets.
Why Are Instagram Metrics Important?
With approximately 2 billion users per month, Instagram is one of the largest social media platforms. It’s also one of the most powerful branding social media platforms for marketers.
Nowadays, social media marketing is an integral part of a digital marketing plan. Tracking the most important Instagram metrics is important to growing your clients' accounts and building an engaged following.
Like any other social media platform, Instagram is not very useful for business unless you actively track social media analytics and see results like conversions.
How Have Instagram Metrics Evolved?
Instagram has come a long way since it was just a photo-sharing app. Today’s key IG metrics now include video views, bio link clicks, Reels watch time, and profile interactions. With so many ways to engage—from tapping Insights to reviewing post saves—tracking performance requires looking beyond likes and comments.
What Are Instagram Insights?
Think of metrics as data in its raw form. Instagram Insights goes a step further by adding a data-based narrative to your client’s metrics.
This data-driven digital marketing analytics tool allows a greater level of interpretation and understanding of what’s happening with your client’s content performance. This includes snapshots of:
The number of accounts your client’s content has reached
The number of accounts that engaged with your client’s content
Changes to the total number of followers on your client’s Instagram account
A summary of any changes to earnings (if applicable)
Detailed breakdowns of performance based on content type (i.e., photos, videos, stories, reels, live videos, and promotions)
Also, viewing insights for individual posts on your client’s Instagram feed gives a breakdown of:
Post engagement (number of likes, comments, direct messages, and bookmarks)
Reach, impression, and content interaction summaries
Whether the post was previously boosted on Instagram
Instagram insights help you make informed decisions about top-performing posts and give ideas for your client’s future social media calendars.
Instagram KPIs vs. Metrics: What’s the Difference?
KPIs (Key Performance Indicators) and metrics are often used interchangeably but are actually distinct items. While key Instagram metrics may provide valuable data points on how content is performing, an Instagram KPI is a specific target that your client sets. Instagram KPIs help clients make strategic decisions and understand whether their efforts align with their company’s goals.
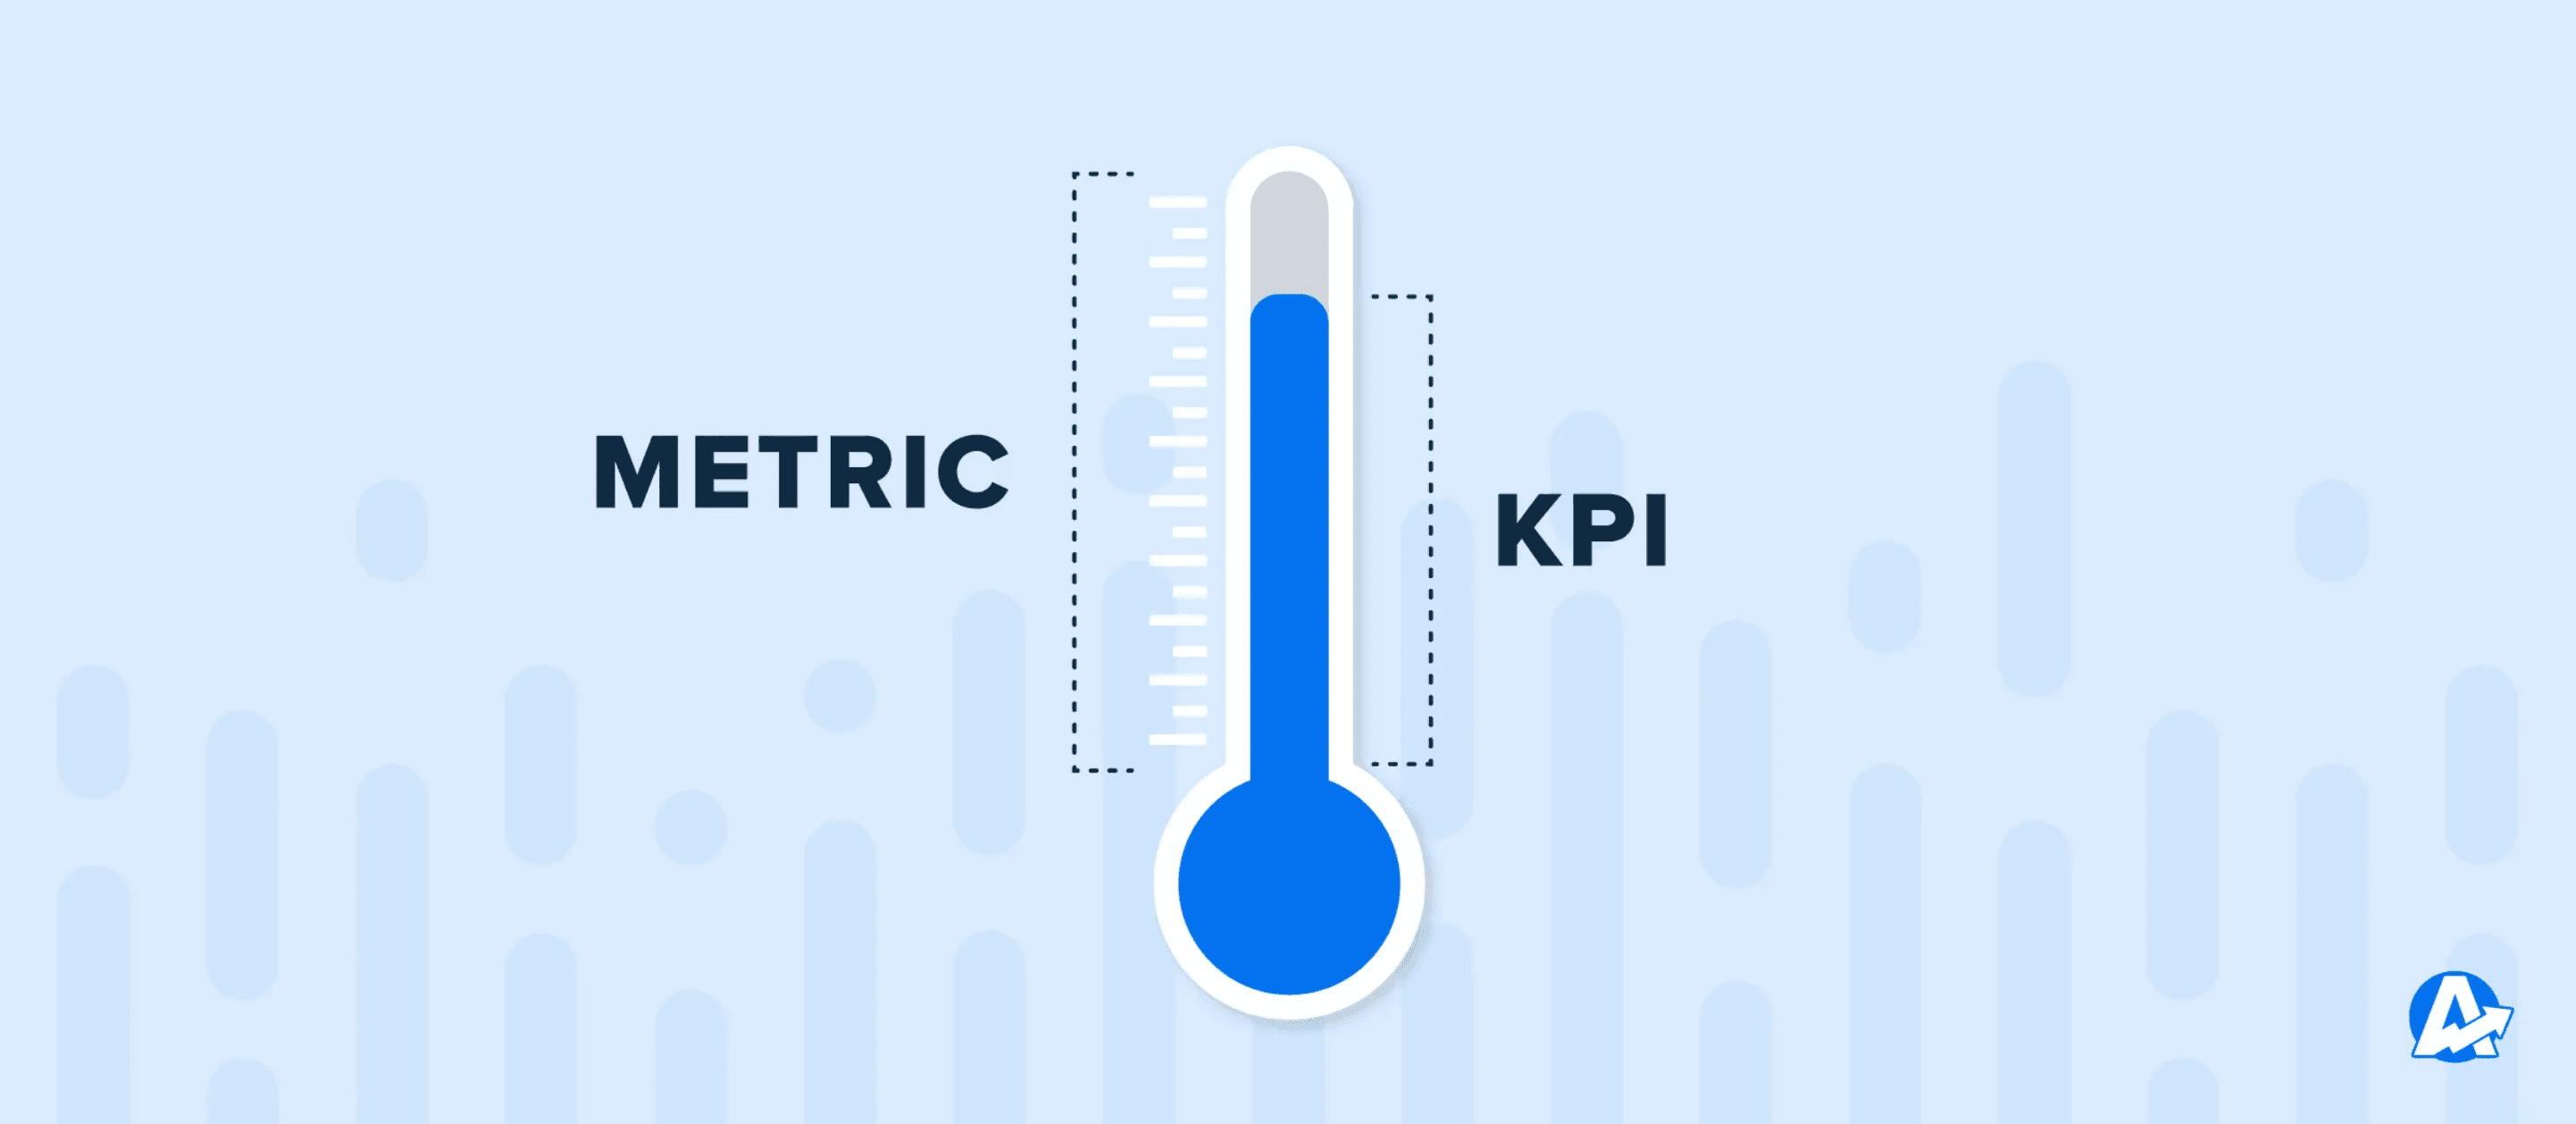
For example, the number of total post views each month might be a nice metric, and it feels really good when a post goes even a bit viral. But will it really move the needle for a client? If not, then it's not a critical social media KPI. Here’s a quick overview of KPIs vs. Metrics that you can keep handy for reference:
Instagram KPIs | Instagram Metrics |
|---|---|
KPIs are focused | Metrics are not limited to one result or dimension |
KPIs can be more granular | Metrics cover a broader range |
KPIs can be used over longer periods | Metrics are usually shorter term |
KPIs focus on results | Metrics focus on processes and problems
|
KPIs are often easier to understand | Metrics needs interpretation |
KPIs may be measured in a variety of ways | Metrics are usually tied to specific data |
Agency Tip: Have a one-on-one with your clients to understand their Instagram KPIs. Explain which Instagram metrics apply to their goals the most while also understanding their overall, long-term strategy. Keeping an open line of communication ensures you’re both on the same page to meet or even surpass those Instagram KPIs.
What’s the Most Important Instagram Metric to Track?
While having a go-to Instagram metric may be a huge time saver, there’s no “one measure” that gives an overall picture of how your client’s content is performing.
This has the potential to be subjective, depending on what your client wants to achieve. One client may prioritize impressions on an Instagram ad campaign, while another may see a high level of engagement as a success.
However, focusing on a North Star Metric (NSM) helps you get a rough estimate of your client’s expectations. More on this later.
Regardless of your clients’ goals, providing valuable data-driven insights helps everyone make more informed decisions with the right knowledge.
Impress clients and save hours with custom, automated reporting.
Join 7,000+ agencies that create reports in under 30 minutes per client using AgencyAnalytics. Get started for free. No credit card required.
Already have an account?
Log in11 Instagram Metrics That Actually Matter for Agencies
When it comes to which Instagram metrics to track, you probably already understand the difference between reach and post impressions. But what about the percentage of Instagram followers who engage with your client's posts? Or the rate at which your agency has grown their follower base?
While important Instagram metrics provide an overview of content performance, they’re all distinct in their own ways. Here are the 11 most important Instagram metrics to measure your client's post performance on Instagram:
1. Follower Growth Rate
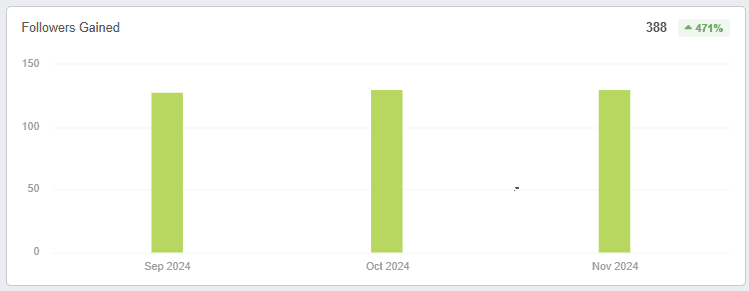
A high Instagram follower count builds brand credibility, but it doesn’t necessarily say that much about the health of your client’s marketing campaigns and Instagram strategy.
As of November 2024, the median Instagram follower count for accounts managed by marketing agencies was 617, based on data from over 150,000 Instagram accounts run by the 7,000+ agencies using AgencyAnalytics.
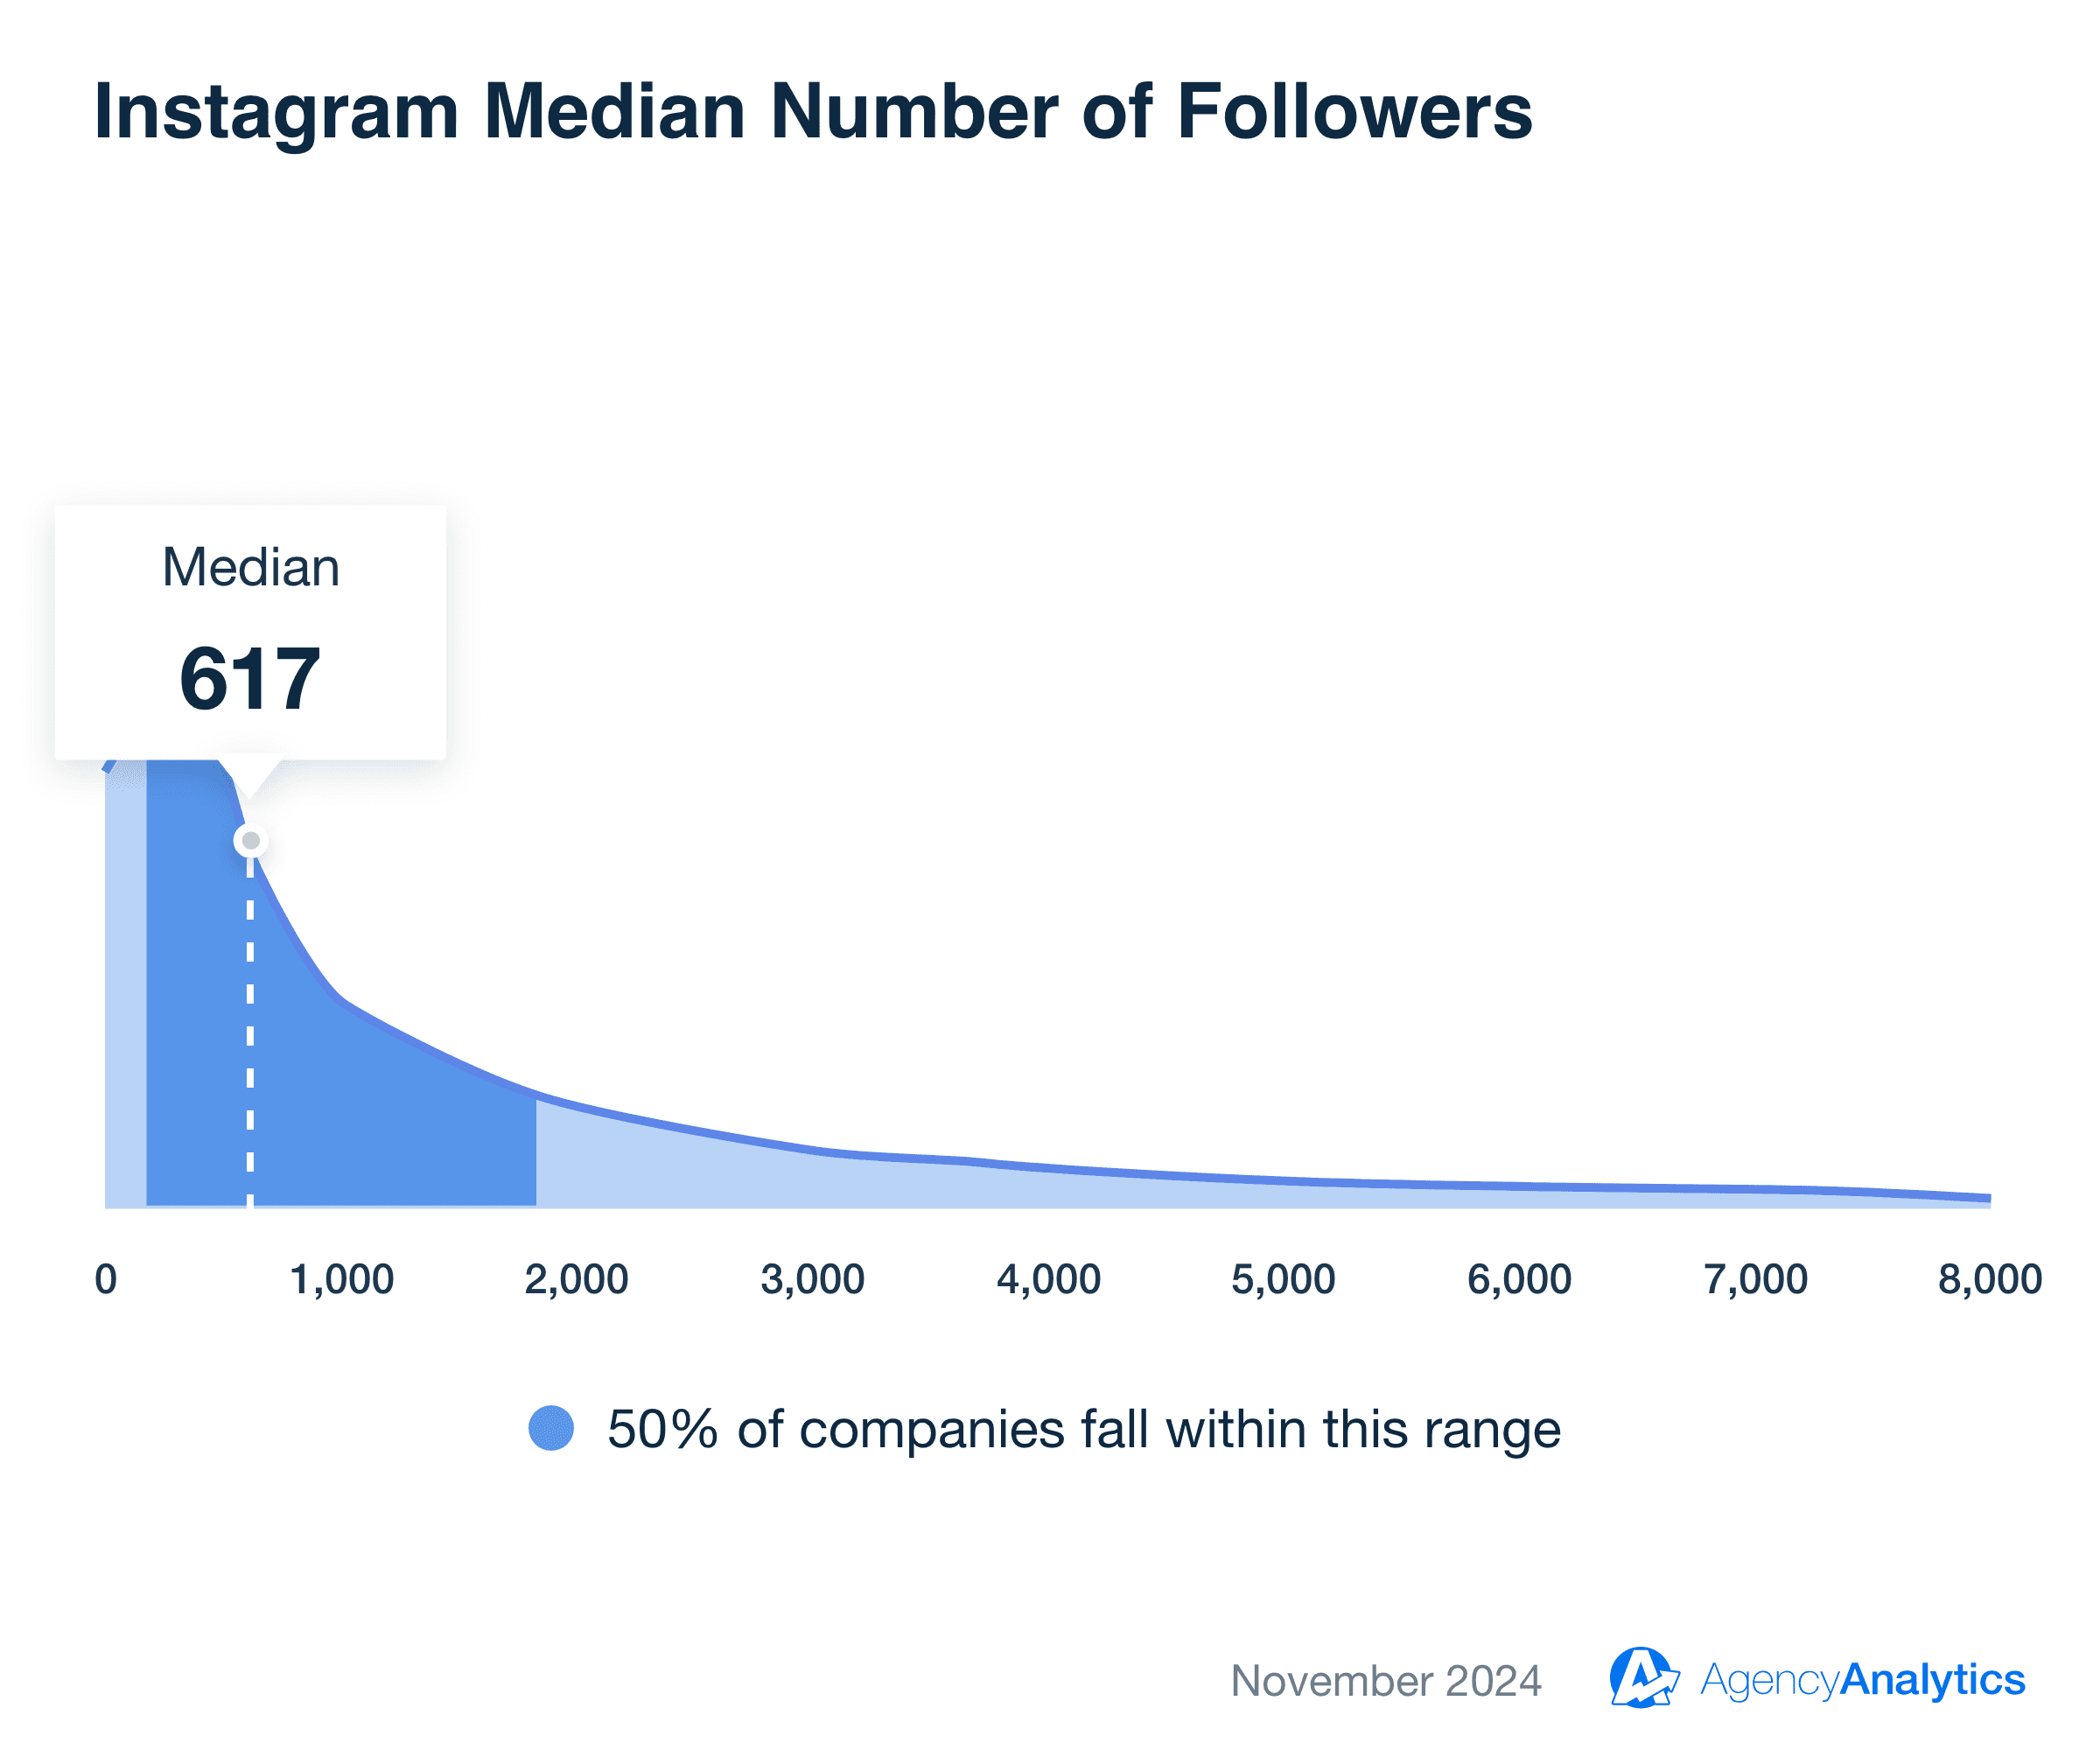
Why does this number matter? Benchmarking performance against industry medians provides valuable context for client campaign performance. Whether you're managing accounts with fewer followers or scaling accounts well beyond this median, knowing where your client stands helps set realistic goals and adjust the strategy.
Agency Tip: Clients want to know how their marketing performance stacks up against their competition. With AgencyAnalytics’ new Insights features, compare your client’s marketing metrics against data from other businesses in the same industry.
Follower Growth Rate gives you a good idea of whether your client’s business is expanding its reach and catching new people’s attention.
In other words, when evaluating follower performance, the way follower count changes is often more important than the actual number of Instagram followers. For example, suppose you get 50 new followers in a month. If your client started out with 500 followers, that’s a 10% growth rate–which is excellent. However, if you started out with 5000 followers and got 50 new followers that month, follower growth rate would be only 1%. This Instagram metric indicates that your marketing efforts are stagnating, and it may be time to try a new strategy.
2. Reach and Reach Rate
Reach is another Instagram metric that requires you to switch to a Business Account to create an Instagram Business Profile. View your client’s Instagram reach within Instagram Insights.
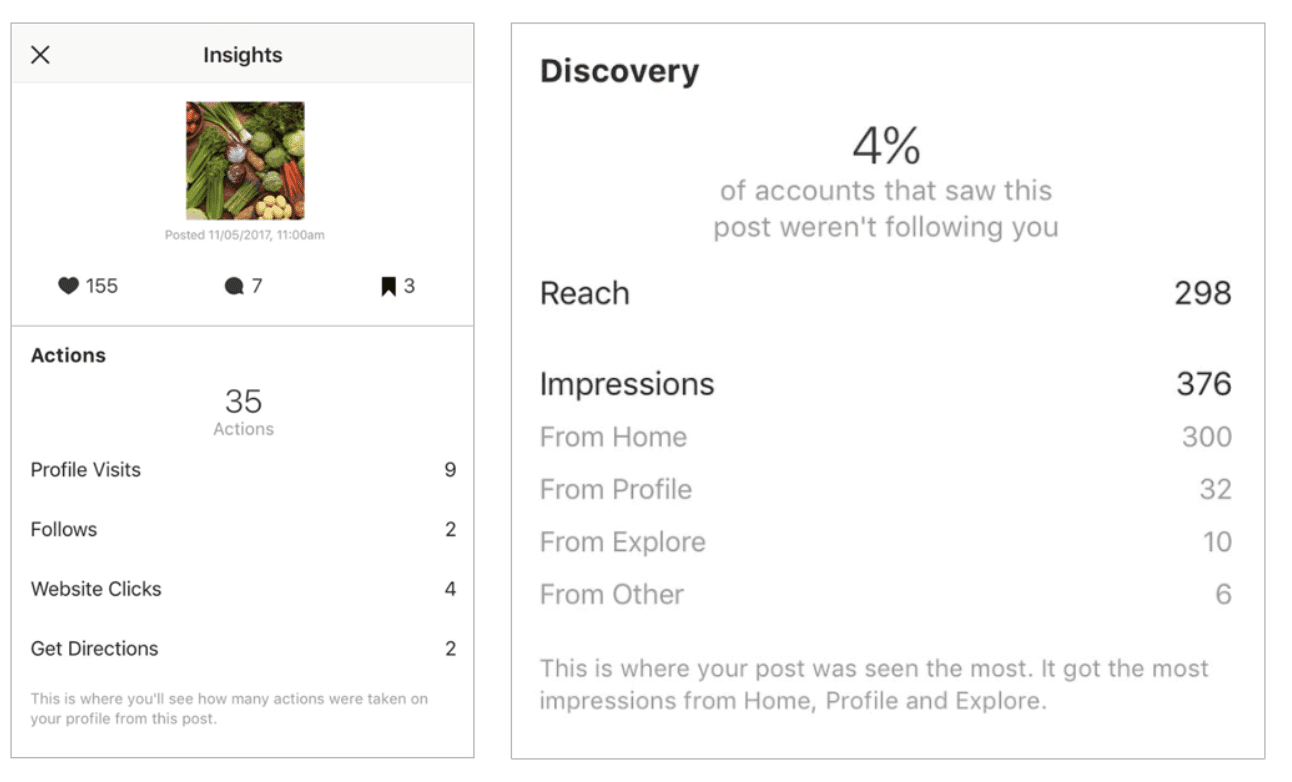
Reach tells you the total number of people who have seen your client’s post.
As of November 2024, the median reach for accounts managed by professional marketing agencies was 2,999. This benchmark helps gauge how many unique users are exposed to your client’s content and provides a baseline for measuring brand awareness.
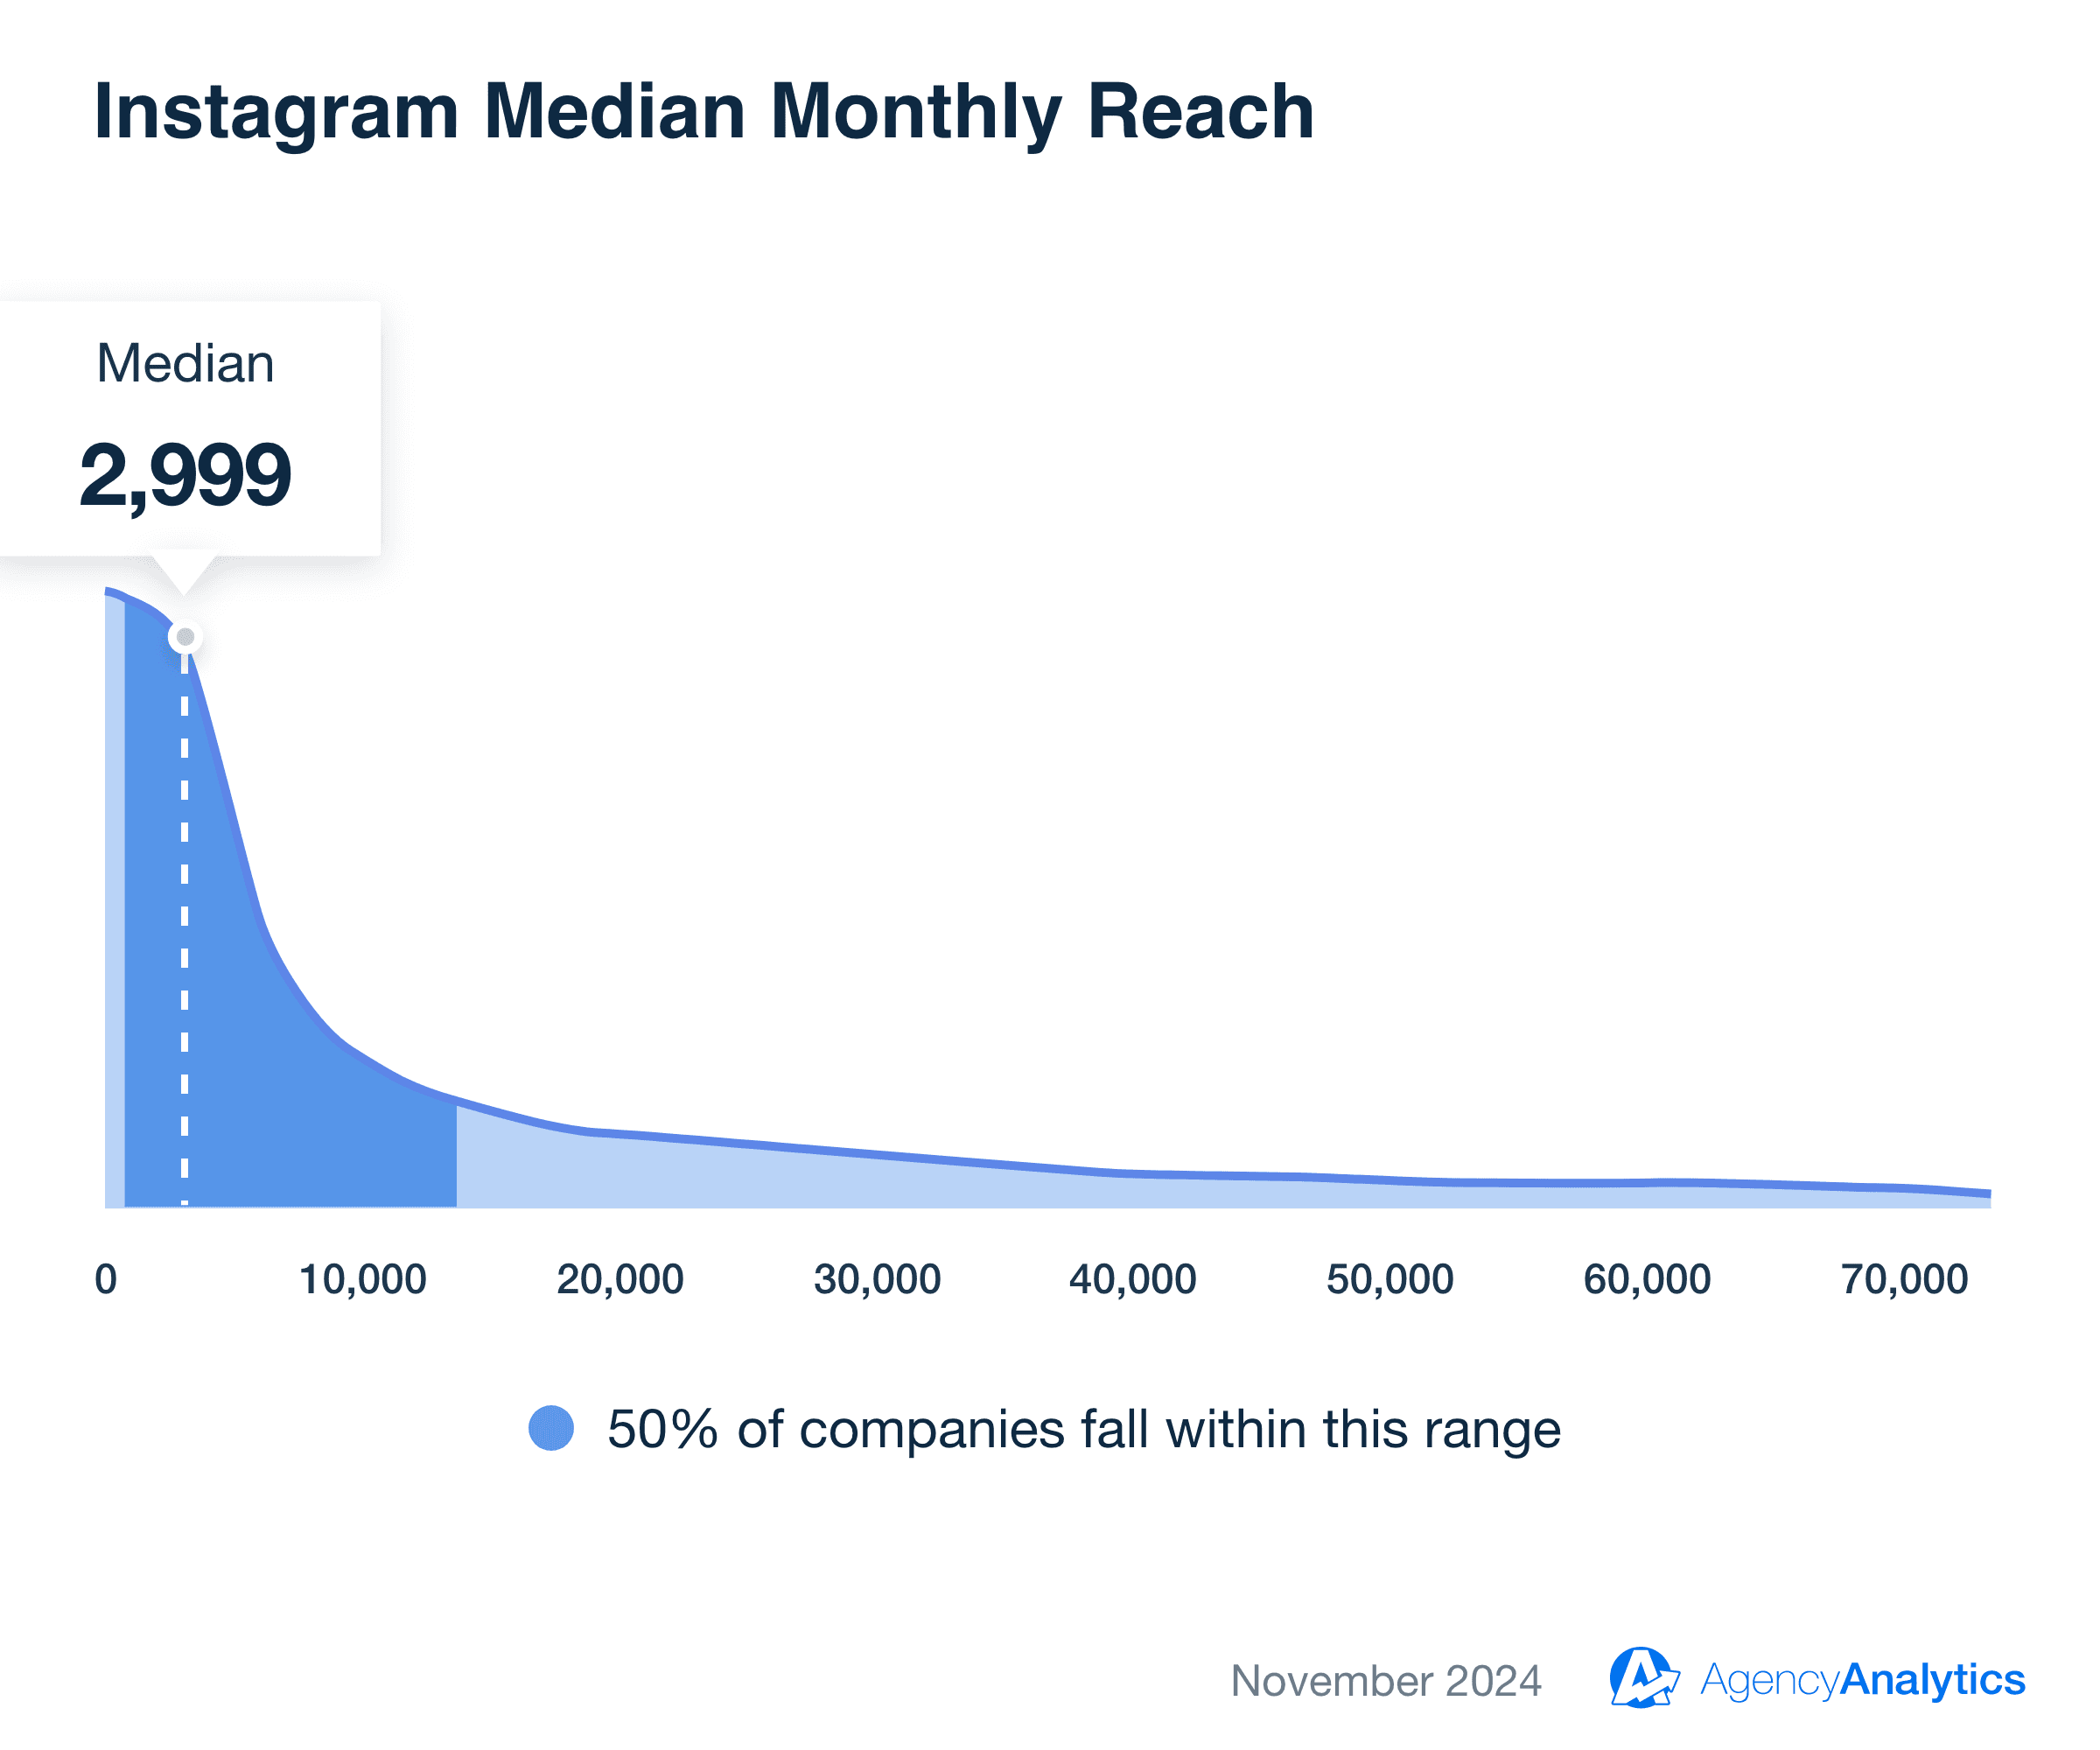
Along with total reach, you want to track Reach Rate. This is the percentage of followers who see your client’s post. Calculate it by dividing the total reach of a post by the total number of followers. For example, if your client has 300 reach and 1000 followers, their reach rate is 30%.
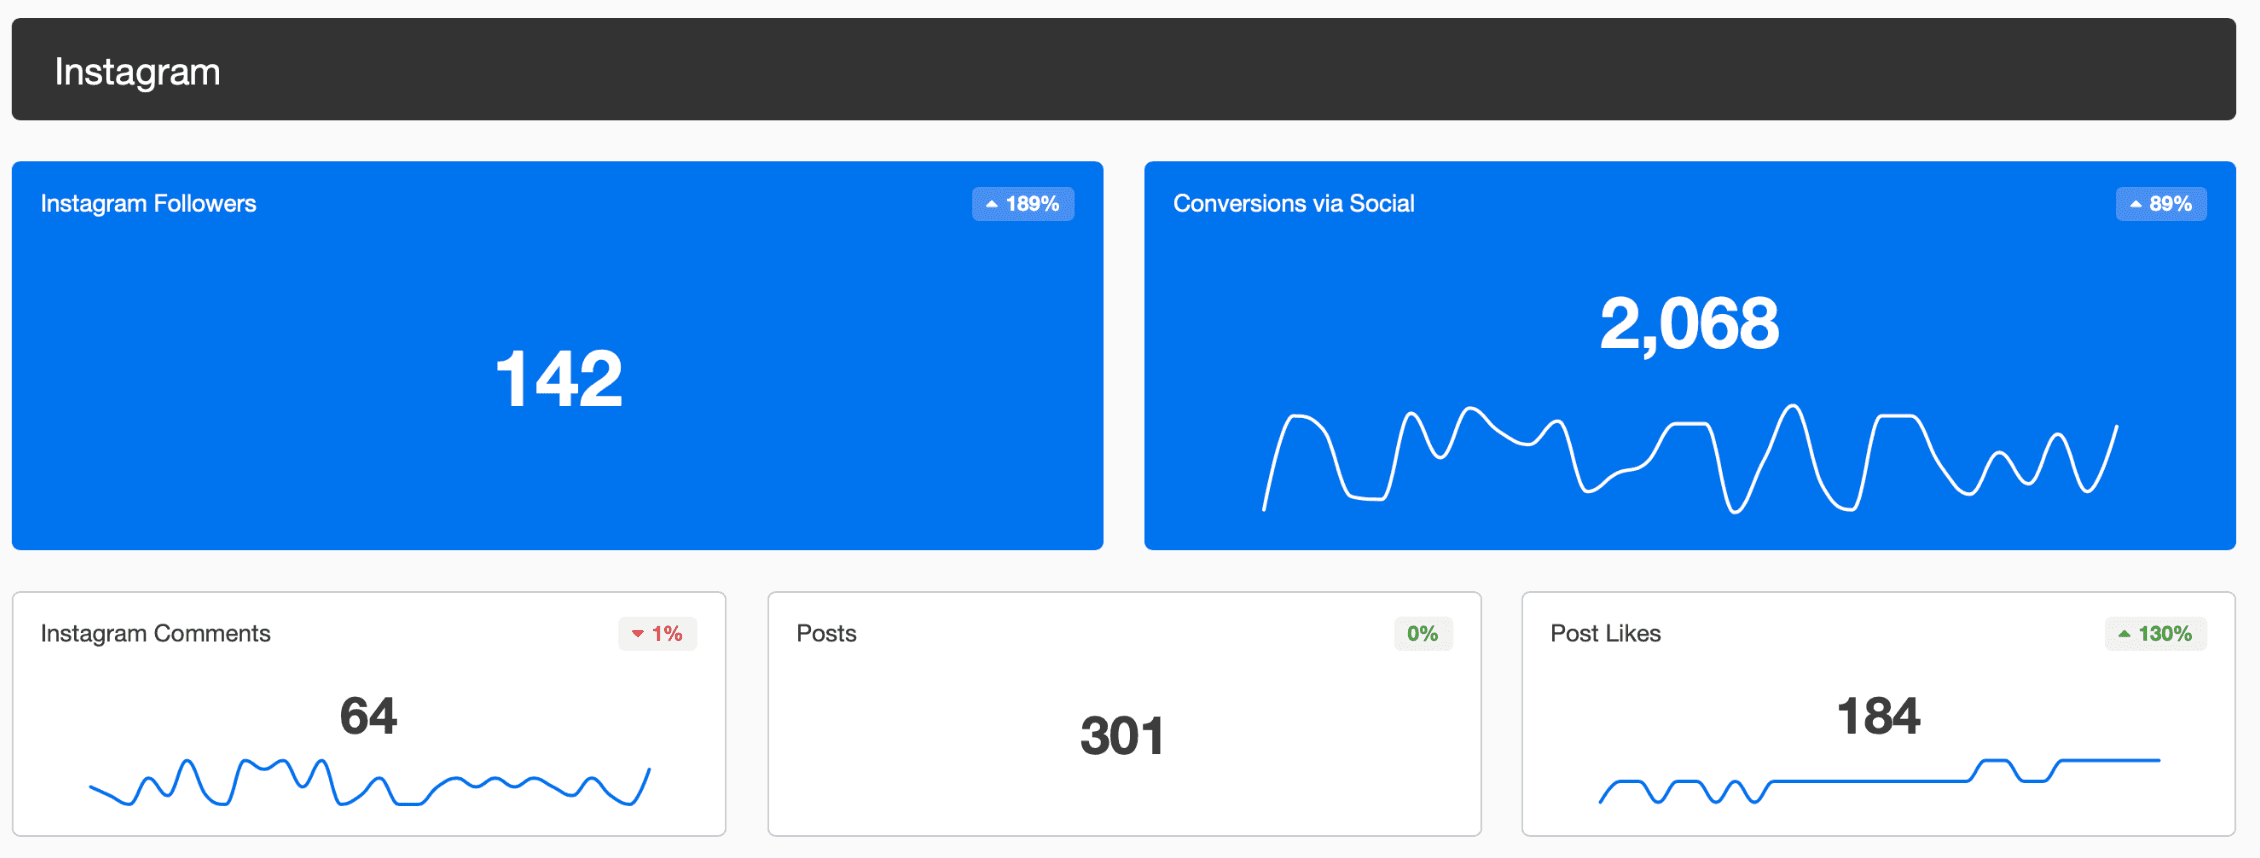
One way to increase your client’s reach is to use hashtags and branded hashtags. However, be sure to use them correctly—check out this guide on how to use Instagram hashtags to get results.
Agency Tip: Similar to SEO keywords, routinely monitor hashtag performance to see what gets the most traction. Instagram allows up to 30 hashtags, providing the flexibility to incorporate branded hashtags, wider-reaching hashtags, and ones that are specific to your client’s niche. You should also throw an eye on brand competitors' hashtags and even come up with alternative hashtags that help your client stand out from the crowd.
3. Impressions
While reach measures unique viewers, impressions capture the total number of views, making it an essential metric for understanding content resonance and repeat exposure. It’s an important metric for measuring brand awareness and the number of times people actually see a post.

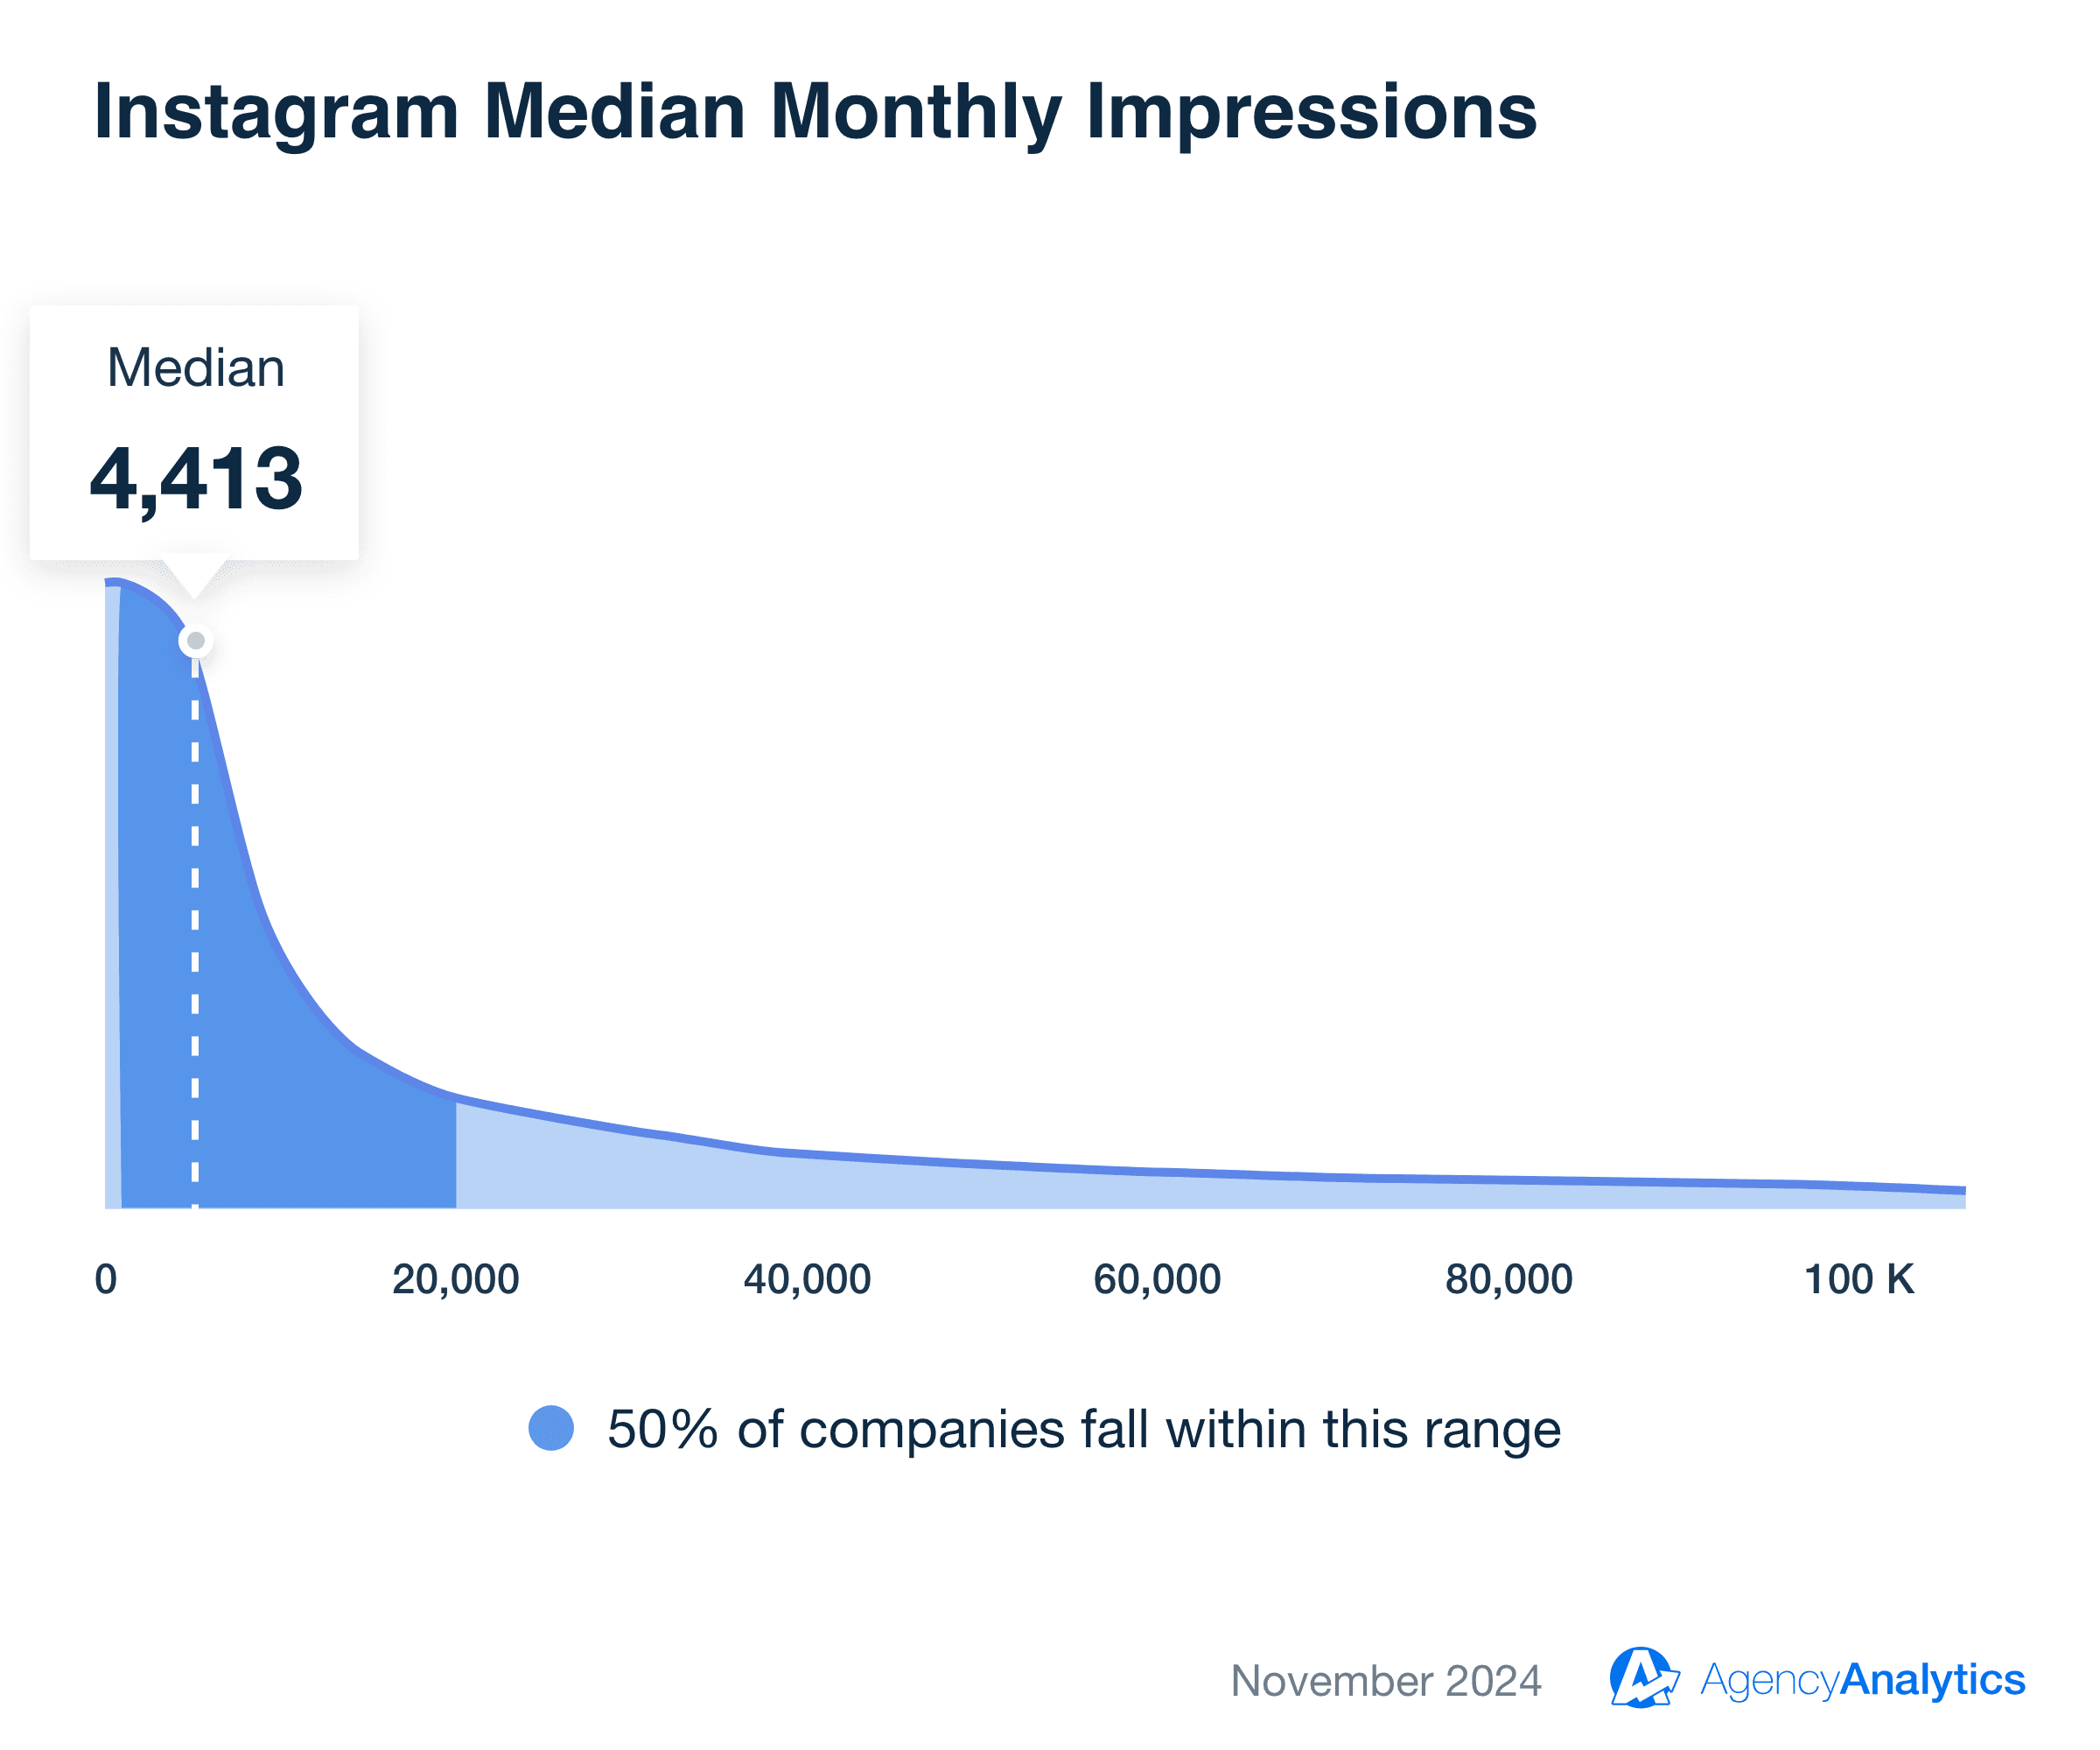
If the same person sees a post three times, it will count as three impressions. As of November 2024, the median impressions per Instagram account stood at 4,413, with some accounts generating over 100,000 impressions per month.
4. Instagram Story Engagement
Tracking an Instagram story’s engagement is as simple as swiping up!
After posting a story to your client’s Instagram Business profile, clicking on the eye icon shows who’s viewed the story.
To see how the story is performing, click on the graph icon, which shows an overview of post shares, replies, and sticker taps.
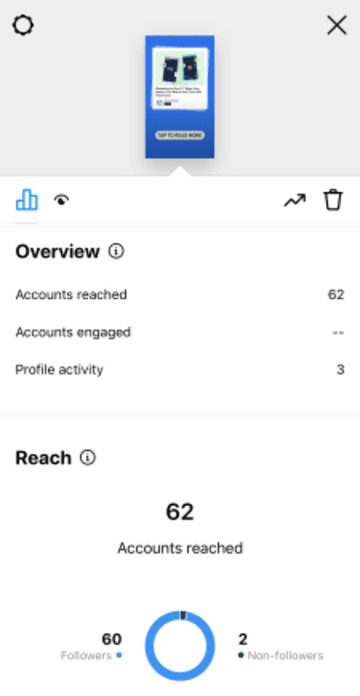
Instagram stories, which can be either videos or photos, differ from regular content as they disappear after 24 hours. But have no fear that these Instagram insights will disappear! To access performance analytics of previous Instagram stories, go to the ‘Insights’ section on your client’s profile, then under ‘Content You Shared,’ click ‘Stories.’ You’ll see a useful grid of previous stories, views, and analytics for individual posts - even after they’ve expired.
Plus, find insights into your engagement in AgencyAnalytics under the Stories tab:
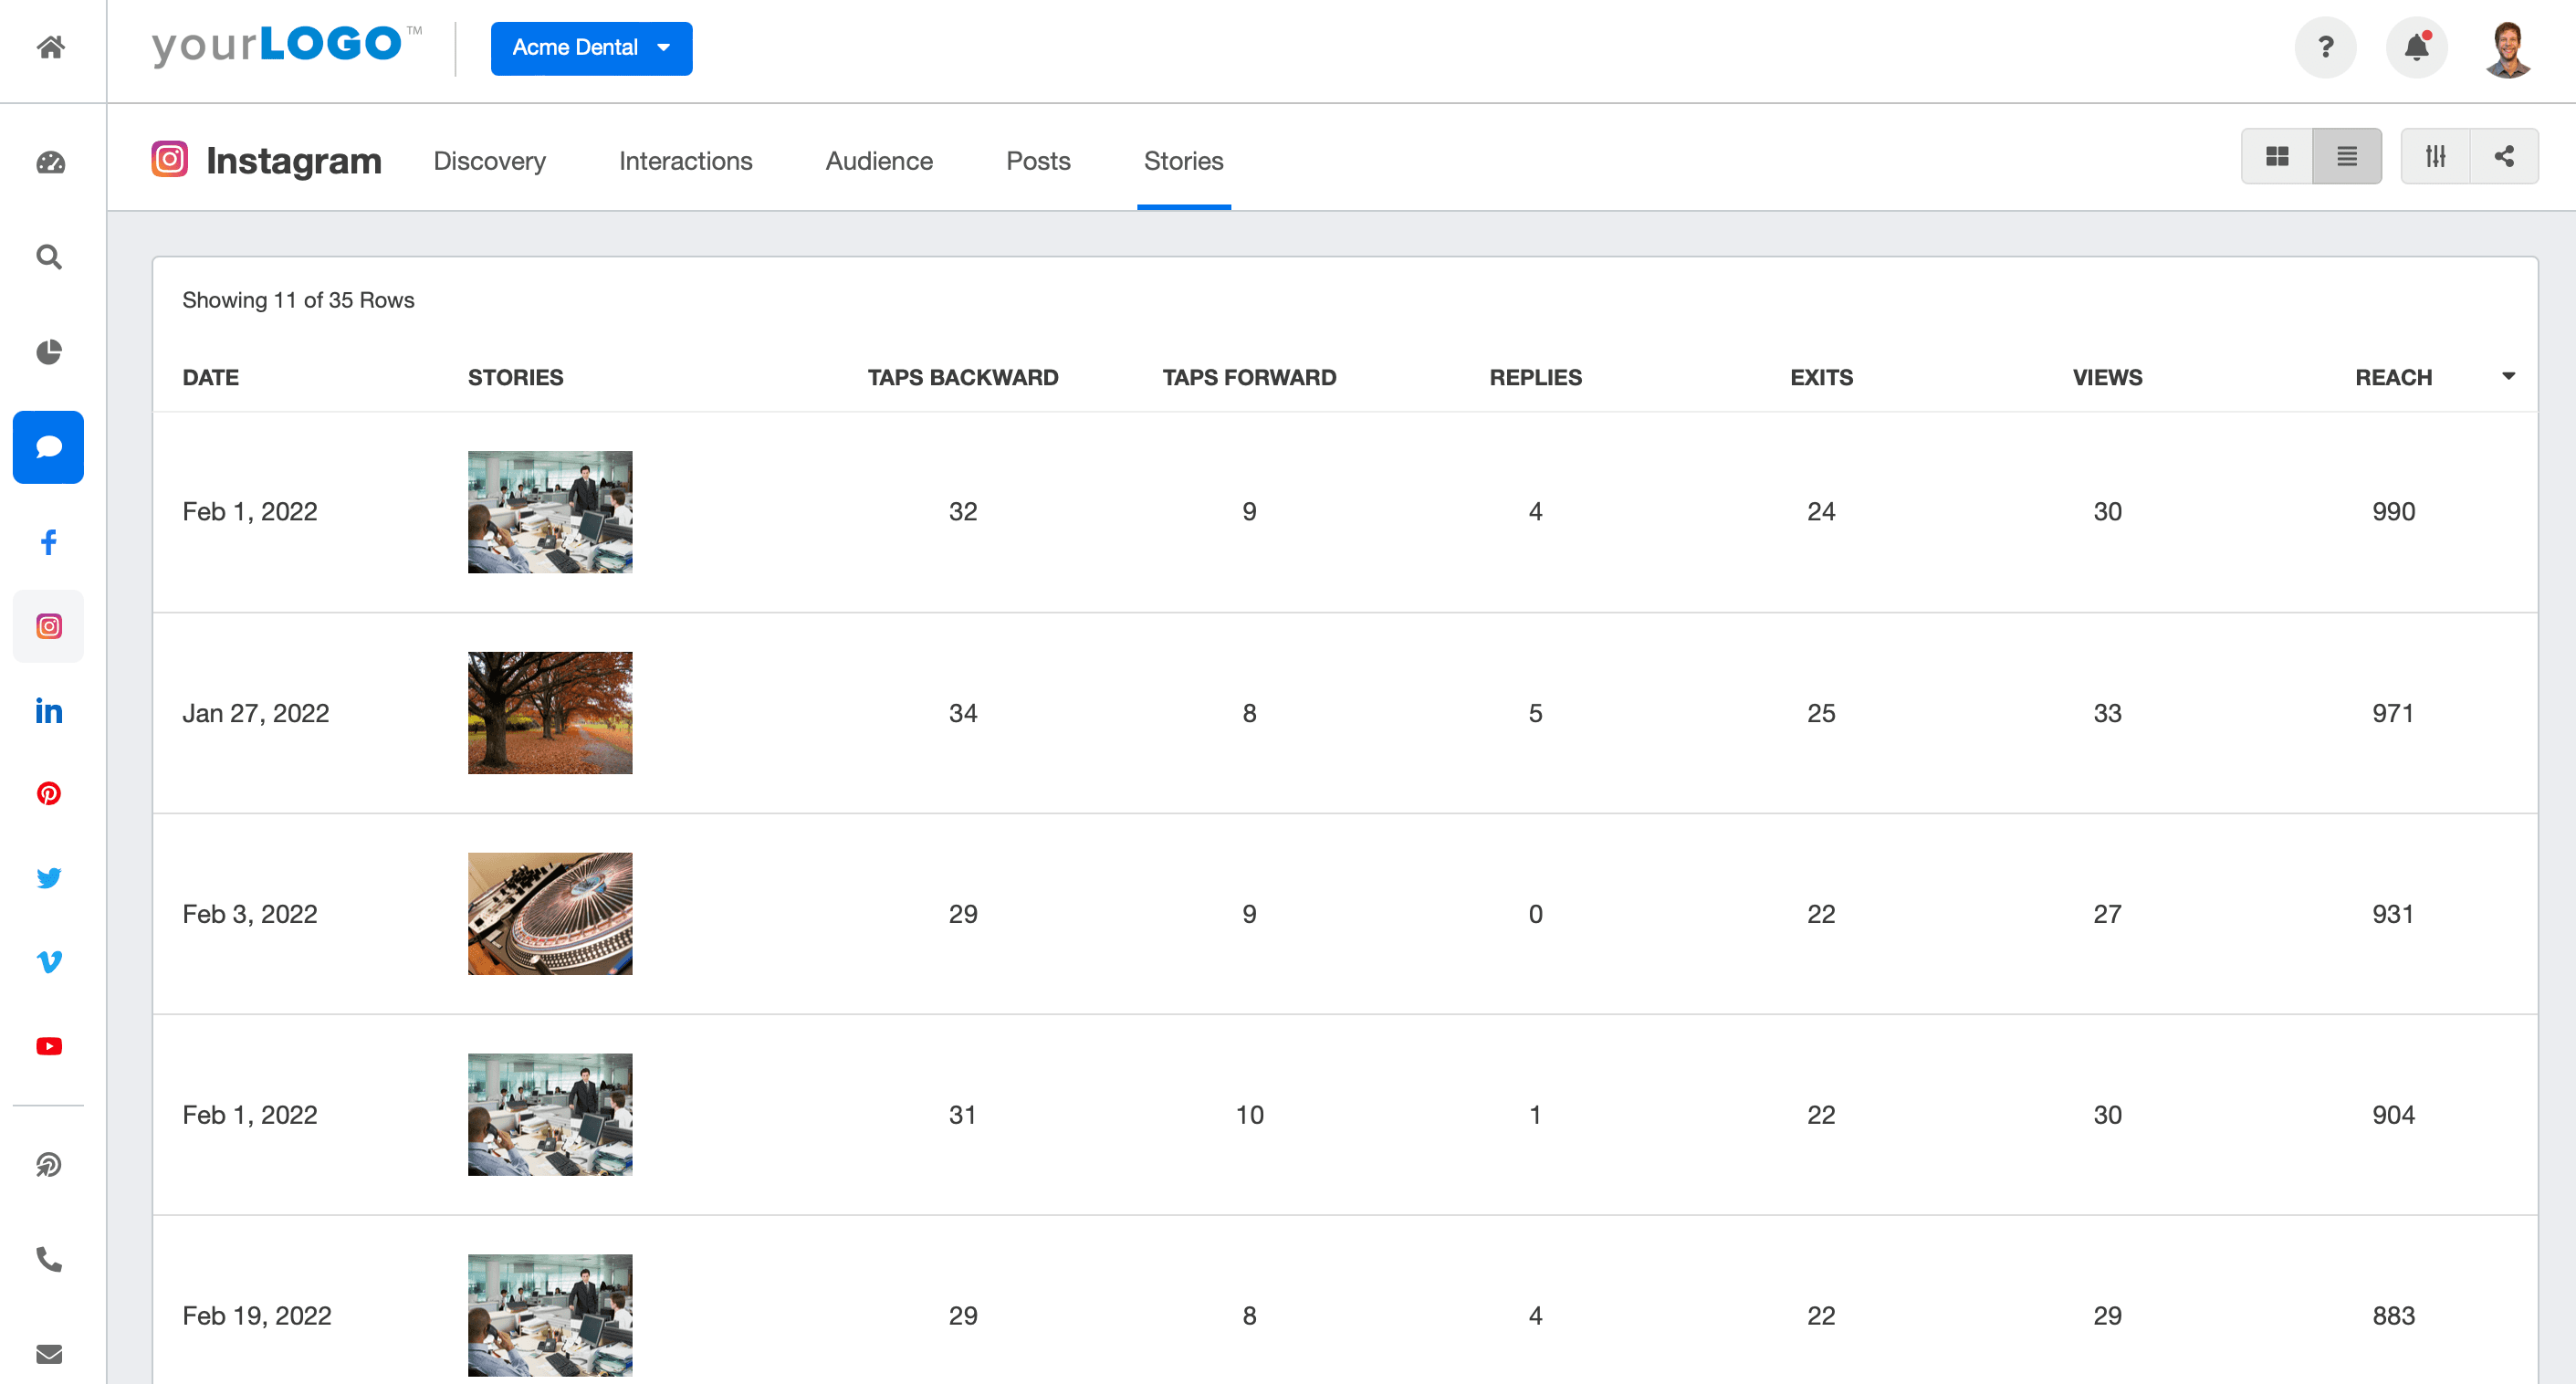
You should pay attention to two important metrics when it comes to Instagram Stories: views and exits.
Views tell you how many unique viewers saw your client’s story. In general, the longer your client has an account on Instagram and the more followers they get, the more their story views should increase.
Exits tell you which slide people were on when they exited their story. Exits are a good way to determine what holds their audience’s interest and what doesn’t. If you notice a lot of exits on one particular slide, try to figure out why so many people lost interest at that point.
5. Instagram Reel Metrics
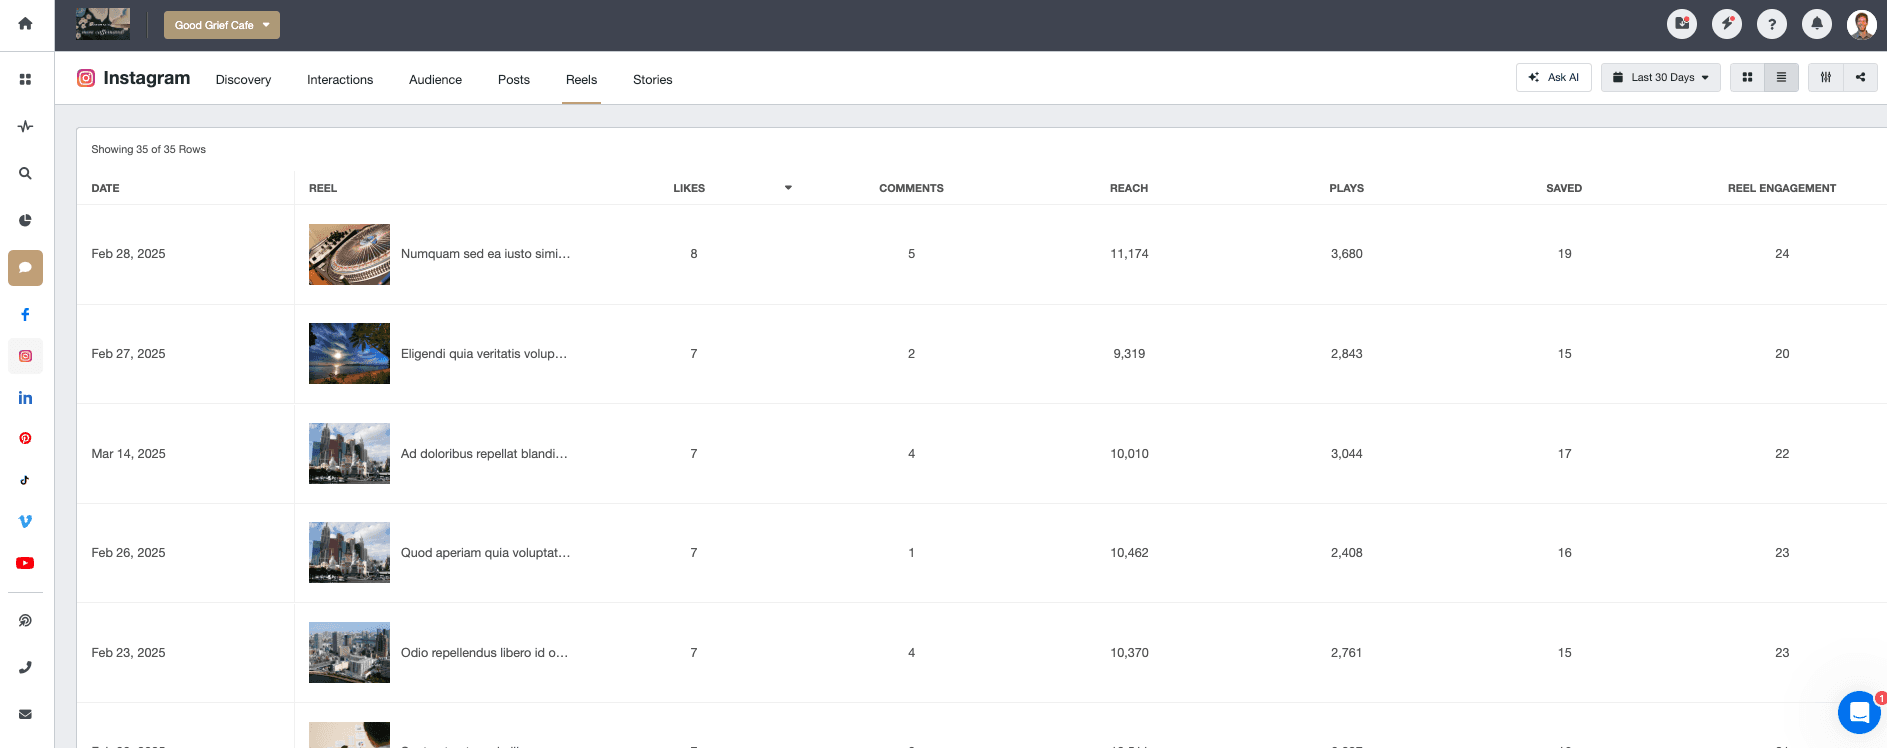
Instagram Reels have their own set of performance metrics, including reach, plays, watch time, and engagement rate.
Unlike standard post reach, Reels reach can extend beyond followers due to Instagram’s recommendation algorithm.
For example, if a client’s Reel gets 50,000 plays but only 10,000 reach, it means users are rewatching, signaling strong interest.
Watch time is another key indicator—if viewers drop off early, the content may need a stronger hook. Tracking these metrics helps determine whether Reels are driving brand awareness, keeping users engaged, or leading to conversions. If engagement is low, adjust hook timing, format, or CTA placement to improve performance.
Show your clients exactly how their Instagram strategy is performing with easy-to-understand, customizable reports from AgencyAnalytics. Get started today with a 14-day free trial.
6. Engagement Rate By Followers
This important Instagram metric gives you a clearer picture of how many followers interact with your client’s content.
To calculate the Engagement Rate by Followers, add the total number of engagements (likes, comments, shares, and reposts) and divide it by the total number of followers. Multiply by 100 to get a percentage rate. This can be tailored if your client wants an engagement rate by followers for a specific type of content.
7. Website Traffic
Like other social media channels, Instagram is a powerful driver of traffic to your clients’ websites.
Instagram is more limited than other social platforms in driving traffic off-app. You can't add clickable links to each post. Instead, the platform only allows a link in the bio, and brands with over 10k followers can add swipe-up links to their Instagram stories.
Agencies track the number of website visitors from Instagram with the help of a Google Analytics reporting tool, which segments a client’s traffic into default channel groupings—one of which is "social."
Navigate to "Acquisition" → "Channels" and click "Social" in the GA account to see exactly which social channels drive traffic to the site.
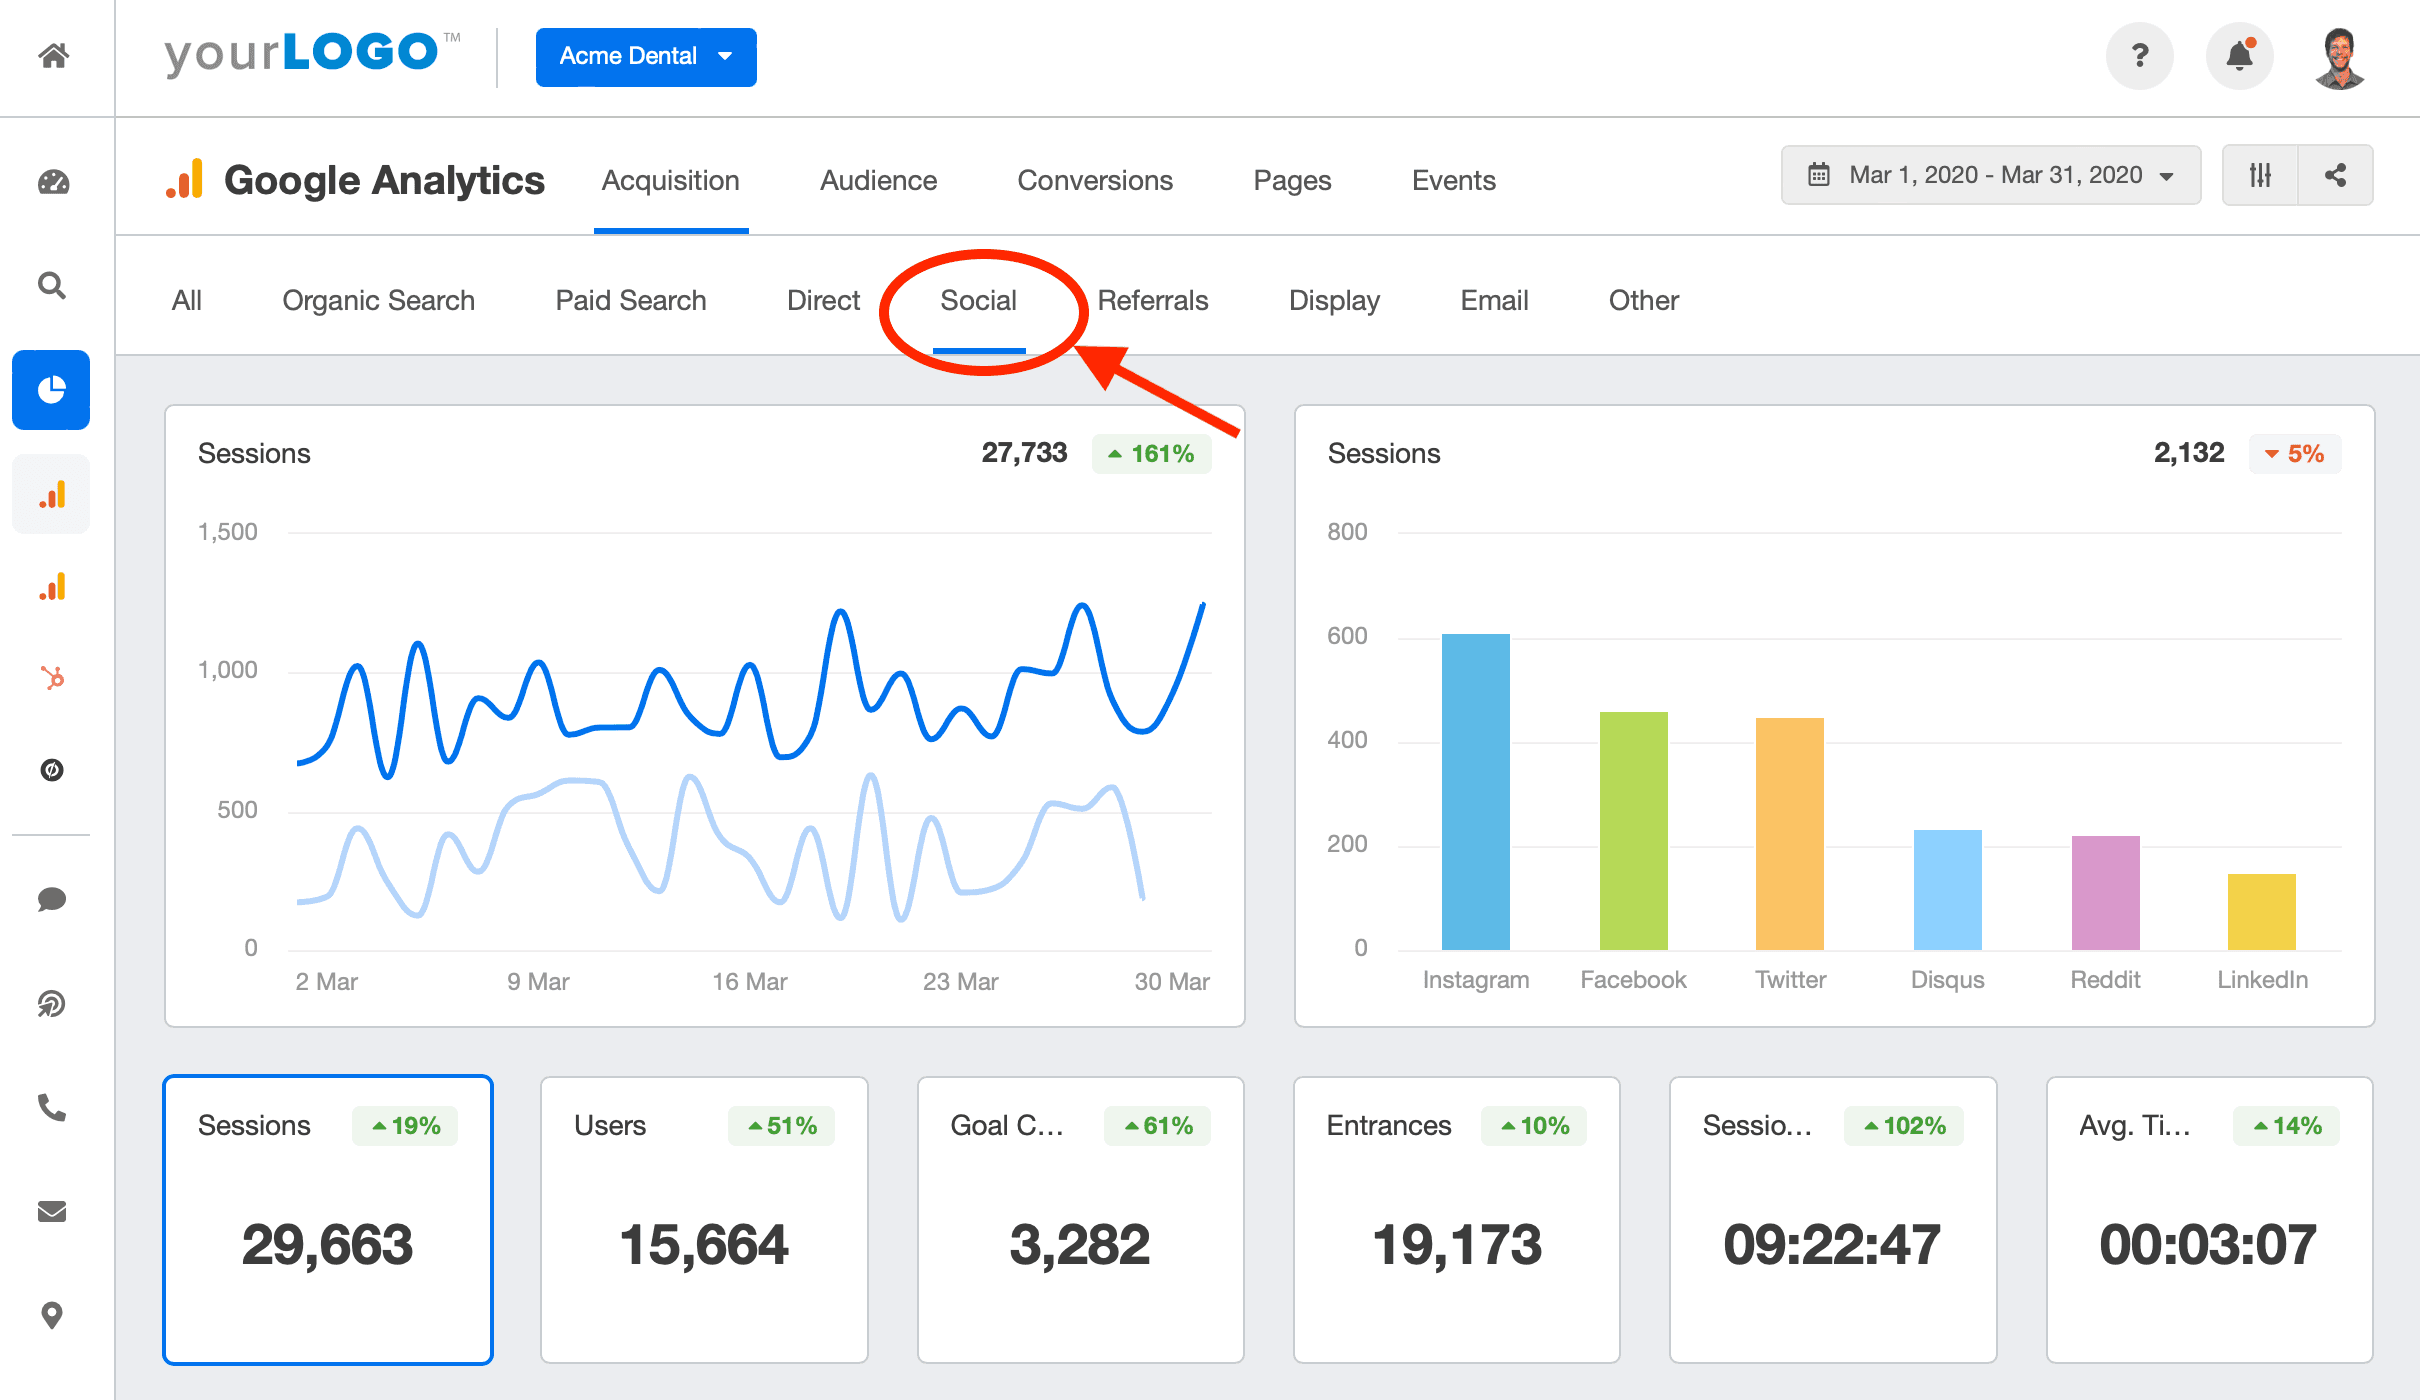
Accurately measure the ROI of your social media efforts. Track "Goals" in Google Analytics to see if your client’s Instagram traffic converts. Try AgencyAnalytics free for 14 days!
8. Link Clicks per Post
Now that you’ve figured out how to measure Instagram traffic to a client’s website, the next step is determining which specific links and Instagram stories were clicked.
Create URLs with UTM parameters that tell your analytics platform where particular profile visits came from. UTM parameters are basically informational tags that you append to a client’s normal URL.
UTM URLs can be unwieldy to type out manually, but many simple tools on the internet will generate these URLs for you. GA Campaign Builder is a popular (and free!) one.
Below is an example of a simple UTM URL:
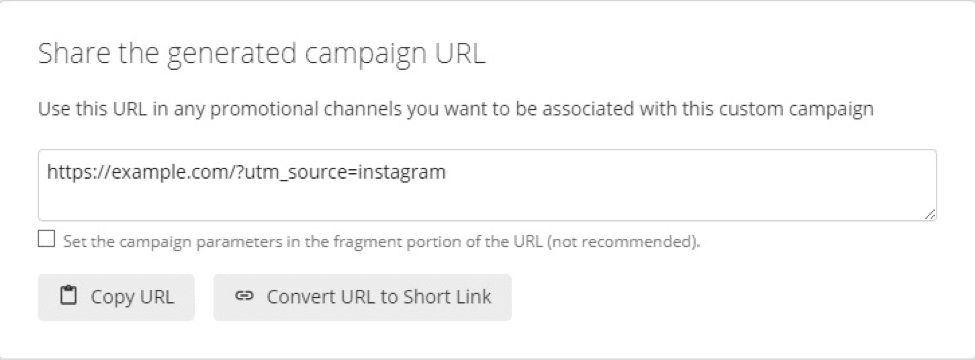
UTM URLs are known to be a bit clunky, so it helps to shorten your finished URL with bit.ly or a similar tool.
Take it a step further in your reports to impress clients and demonstrate results from Instagram by adding a Google Analytics dashboard for your social traffic to AgencyAnalytics, including goal completions and goal value.
This report measures how well traffic from social channels, like Instagram, converts on your client’s website.
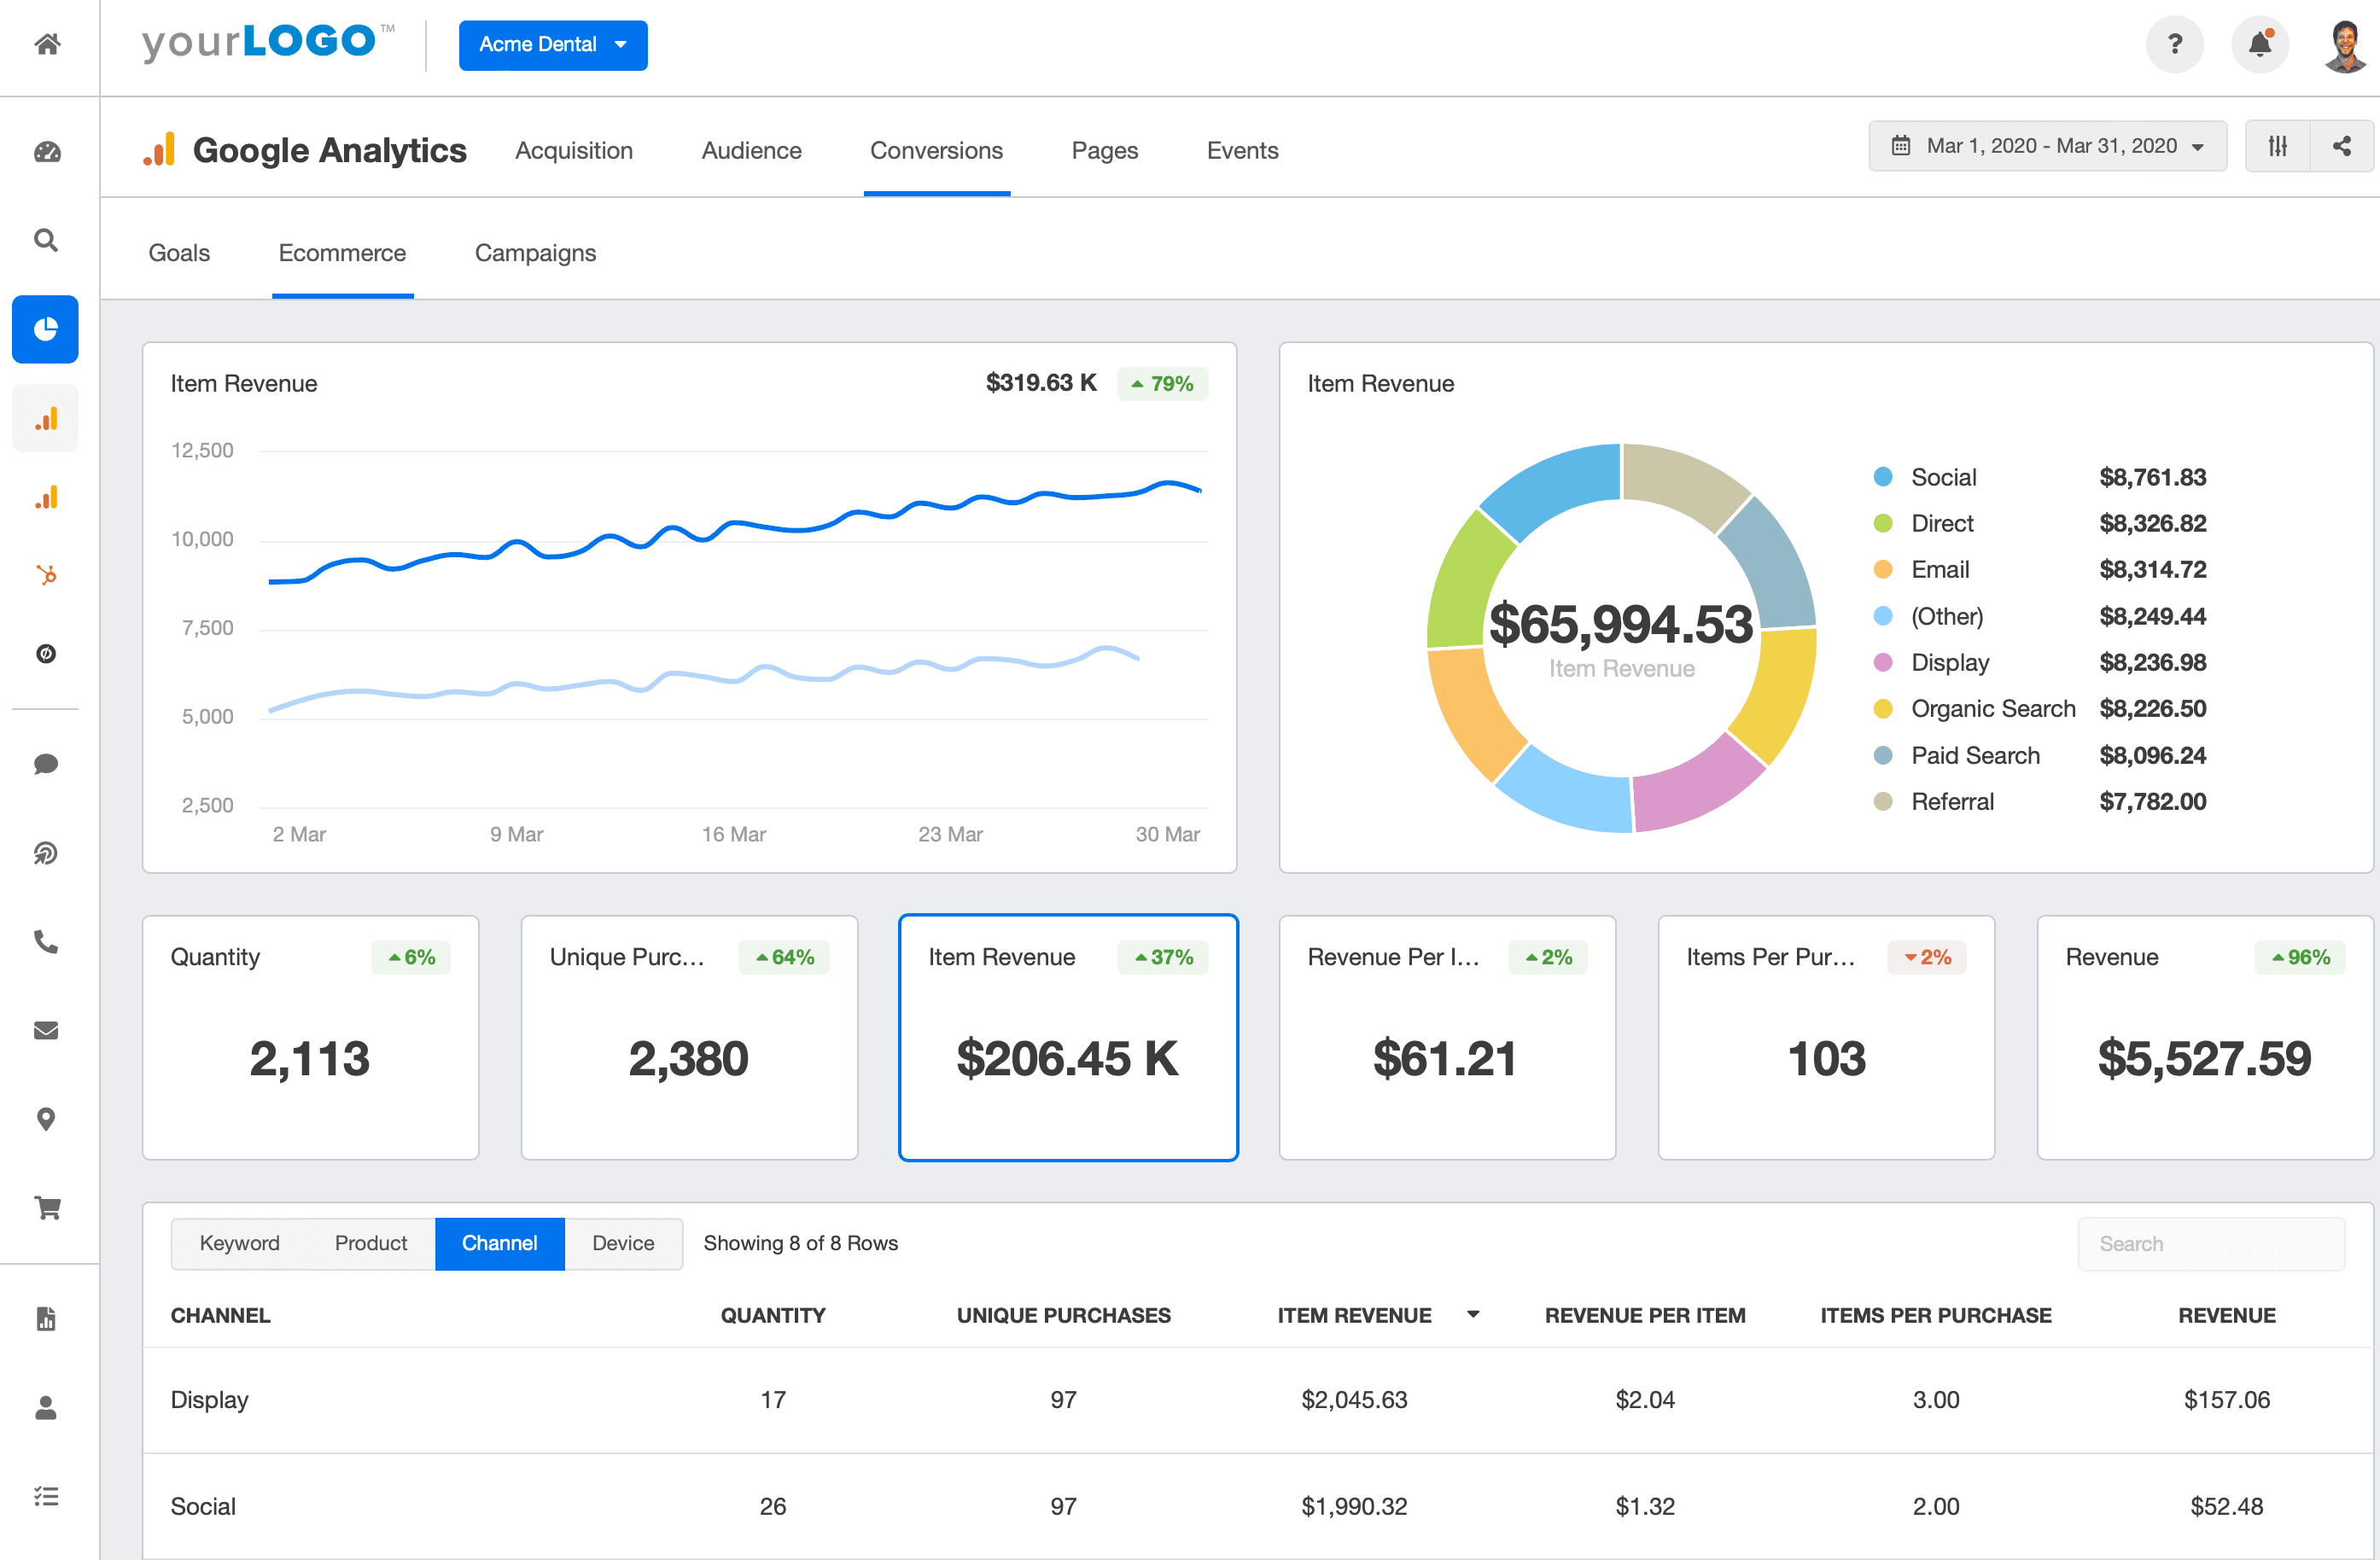
Create your Google Analytics reports and dashboards for your social traffic in minutes. Try AgencyAnalytics free for 14 days!
Combine Instagram click data with tools like AgencyAnalytics to measure total website traffic and conversion rates. This helps you contextualize Instagram's role in broader campaign success and identify opportunities to refine your approach.
9. Comments per Post
Likes on Instagram are gratifying, but comments are worth more when it comes to engagement.
Tapping the “like” button only takes a second, but typing a comment requires time and thought. When someone leaves a comment, it shows that you’ve really caught their interest and connected with them in some way.
That said, the number of comments your client gets is an important metric to track. Monitor their average, and notice if it goes up or down. If the average number of comments has decreased, try to figure out why your client’s audience is less engaged than they used to be.
It’s also good to note which individual posts get the most comments to see if a pattern emerges over time. For instance, if their audience really likes a particular type of product photo, create more posts like that to keep engagement high.
10. Audience Demographics
When executing powerful Instagram marketing campaigns, understanding your client’s target audience demographics is the key to unlocking paid and organic success. These demographic details provide a wealth of information that marketers use to tailor content, optimize posts, and maximize engagement. But what exactly should you be focusing on?
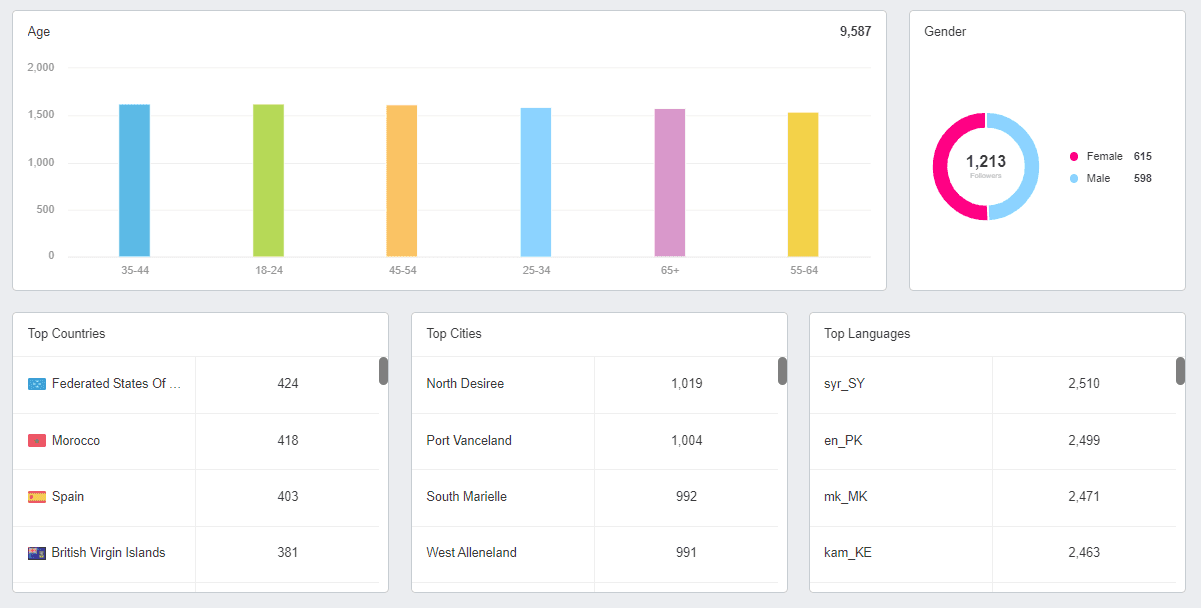
Keep your fingers on the pulse of your client's Instagram marketing metrics with just a few clicks. Try AgencyAnalytics free for 14 days.
Age
Knowing the audience's age range is critical. Different age groups have distinct preferences and behaviors on social media. For instance, younger audiences may be more engaged with Instagram Reels, while older audiences might prefer traditional Instagram posts. An Instagram analytics tool provides this vital information, ensuring every piece of content resonates with the target audience.
Gender
Identifying the gender breakdown of the audience also helps shape a social media marketing strategy. Certain products, services, or content themes might be more appealing to one gender over another. Knowing this, you craft Instagram posts that effectively connect your client with the right people.
Country and City
Geographical location plays a significant role in Instagram marketing campaigns. Due to cultural, societal, or economic factors, users in different countries and cities may respond differently to your client’s content. A detailed location analysis helps you better understand these nuances and fine-tune strategies accordingly.
Language
Language is another vital demographic factor to consider. If your client’s Instagram followers predominantly speak a particular language, it's worth creating content that caters to this language group. This approach not only enhances the accessibility of the content but also promotes a sense of inclusivity among the target audience.
Create more personalized, engaging, and successful Instagram marketing campaigns by leveraging an Instagram analytics tool to understand these key audience demographics. Remember, successful social media marketing is about reaching the right people with the right message.
11. Your Client’s North Star Metric (NSM)
Every client has a different goal on the Instagram app, so it’s essential to define a North Star Metric (NSM)—the one measurement that best reflects success. Some brands prioritize revenue, while others focus on engagement, follower growth, or website conversions. Choosing the right NSM helps align content strategy, ad spend, and campaign objectives with the client's business goals.
For brands relying on direct sales, link clicks or purchases from Instagram Shopping might be the key indicator. If a brand is focused on audience loyalty, Instagram Stories metrics (tap-forwards, tap-backs, and completion rate) will show whether content resonates. Meanwhile, for awareness-driven brands, reach and impressions might matter most.
Tracking too many numbers just creates noise. Instead, tying all analytics back to a single NSM ensures that every Instagram post, story, and ad contributes to meaningful growth. By focusing on this metric, marketing teams prove ROI and continuously refine their Instagram marketing efforts to meet the client’s long-term objectives.
Track and Report Instagram Metrics With the Click of a Button
There's no question that Instagram is a great social media channel for marketing your clients’ businesses. It’s fun, it’s an artistic outlet, and it lets you connect with their audiences.
Keep in mind that if you want your agency’s Instagram marketing to be profitable and fun, you want to track and report the right metrics to showcase your agency’s efforts (and value). You'll hit those marketing industry benchmarks each month by focusing on key social media metrics that matter instead of vanity metrics.
Whether your client wants to track organic growth, impressions, or Instagram ad performance, AgencyAnalytics saves 7,000 agencies time on monthly reporting! The social media report template compiles the top social media metrics that clients care most about. What’s more? It’s customizable, too, so your agency can swap different metrics or add new widgets that make the most sense for a particular client campaign.
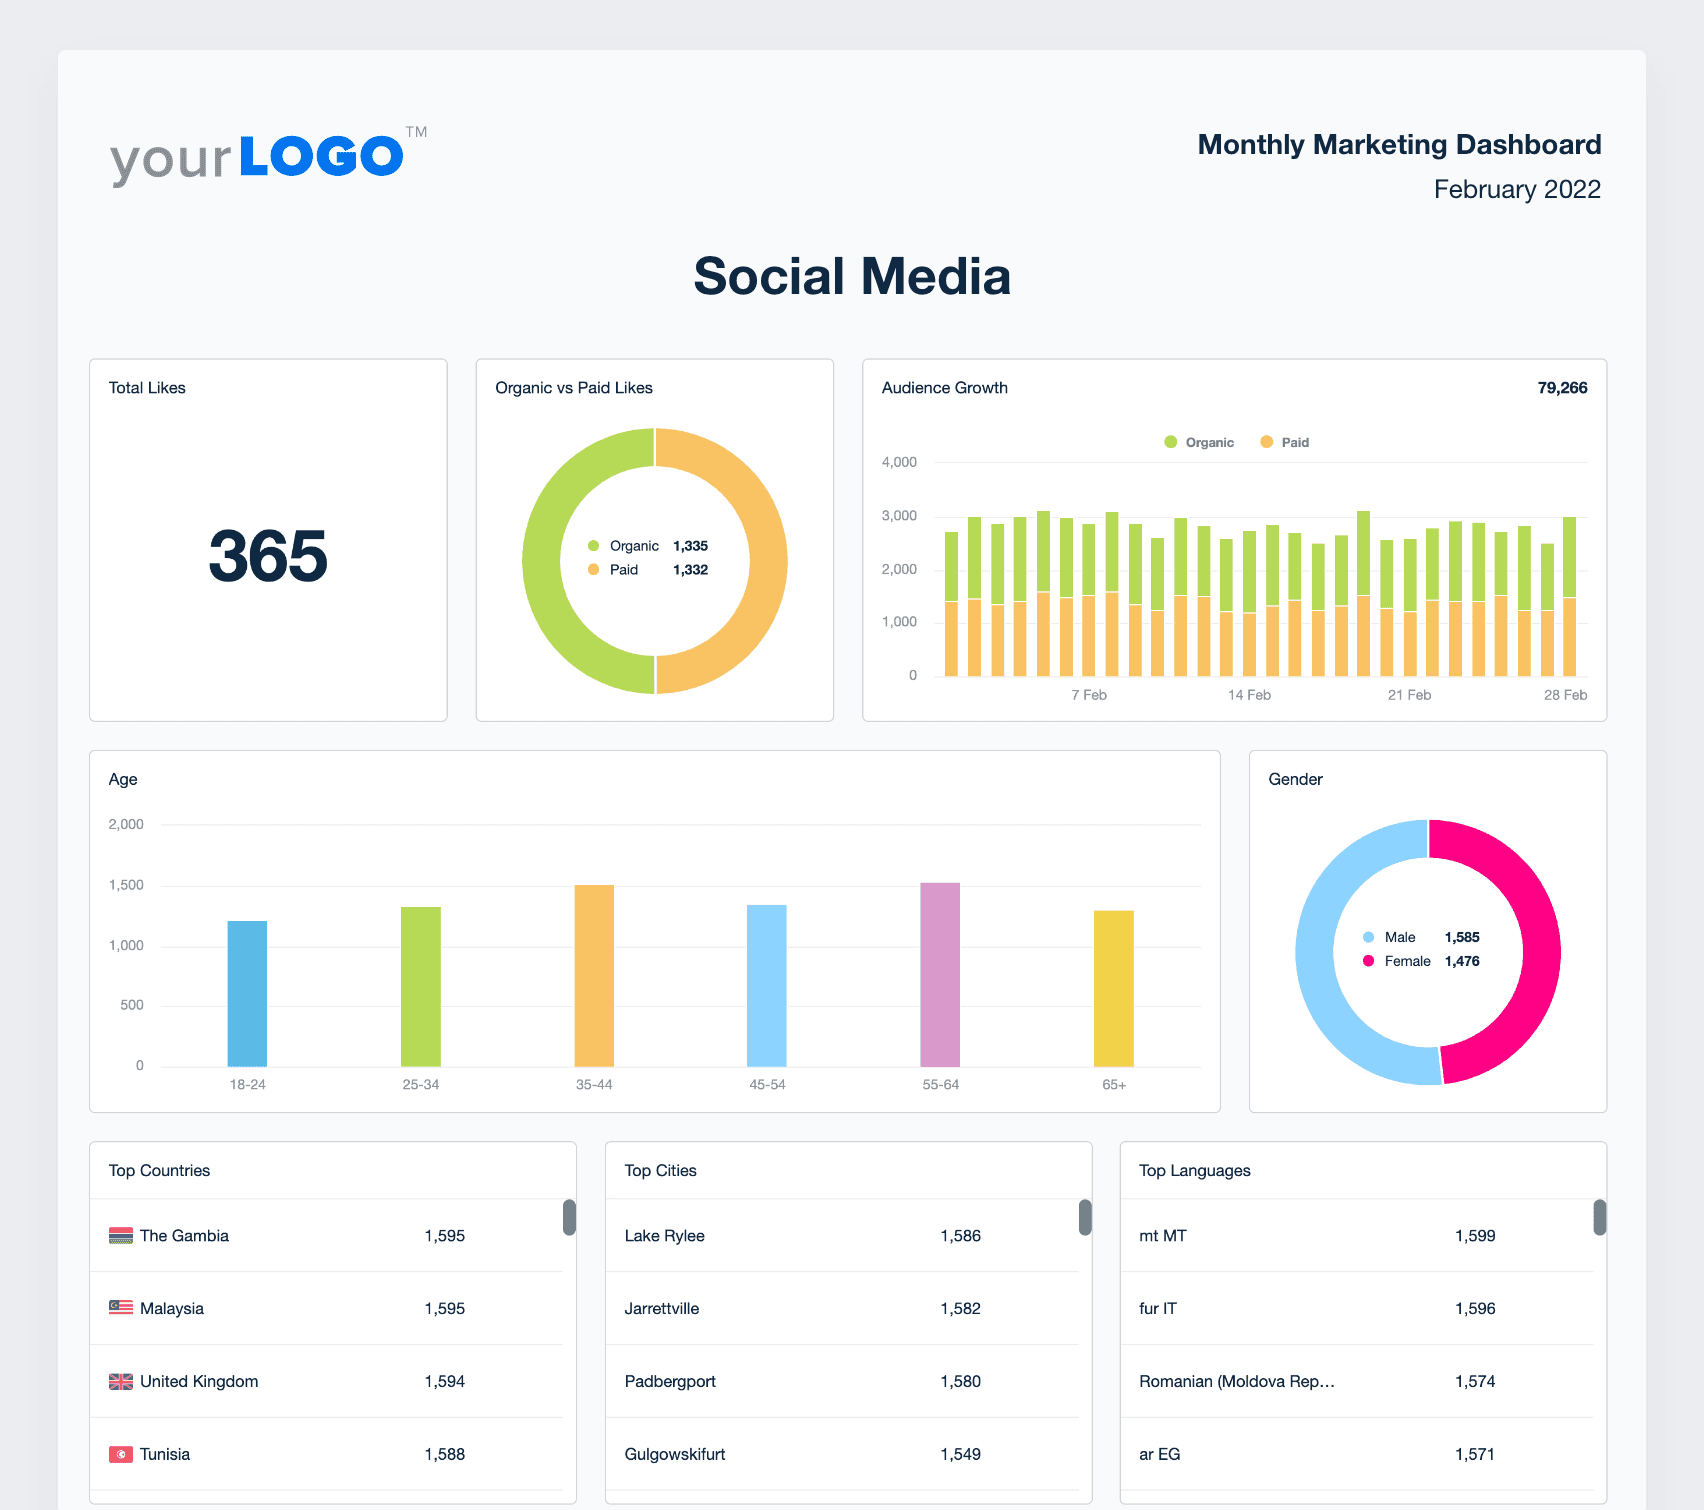
How can you speed up your client’s social media reporting? Try AgencyAnalytics free for 14 days. Get started here!
Your Instagram Metrics Questions, Answered
Let’s clear up the confusion around what to track, how often, and what it all really means.
Reach counts how many unique users saw your content. Impressions count how many times your content was displayed—even if it was to the same user multiple times. Both metrics appear in your account insights under insights overview.
To accurately measure Instagram engagement, track likes, comments, shares, saves, profile interactions, and replies from non followers. Then calculate the average engagement rate as: (Total Engagements ÷ Total Followers) × 100. Check this under your posts section for specific posts. Or use a platform like AgencyAnalytics that does the calculations for you.
A good Instagram engagement rate is typically between 1% and 5%, depending on industry benchmarks, location, and follower count. Use it to gauge how well your Instagram content performs with your target audience. Higher rates show stronger audience connection and content performance.
Track total followers over a defined time frame using account insights. Review spikes after campaigns, compare top countries and top locations, and look at how many people interacted with content to evaluate growth trends. Or use an automated reporting platform like AgencyAnalytics, and have these metrics at your fingertips, automatically.
The most important Instagram metrics for agencies include accounts reached, impressions, engagement rate, follower growth, profile interactions, and traffic from the bio link. These key IG metrics help clients increase brand awareness and track ROI.
The best way to track Instagram metrics is with a platform like AgencyAnalytics that automates reporting, pulls up-to-date Instagram across all posts data automatically, and visualizes insights on custom dashboards. From video views to website traffic to specific metrics that matter to your agency, everything is in one platform.
To track traffic from Instagram, use UTM links in your bio link and check referral traffic in your analytics tools. Tap into account insights to see link clicks and profile actions over a chosen time period.
The easiest way to start tracking Instagram performance is to connect your client’s Instagram profile to AgencyAnalytics. It pulls in metrics from Stories, Reels, and posts—automating reports and creating professional dashboards in minutes instead of hours.
With AgencyAnalytics, agencies typically create a full Instagram metrics report in under 30 minutes. The platform auto-pulls data from your client's Instagram profile, tracks important indicators like accounts engaged and comments left, and builds a branded report—no manual work required.
Impress clients and save hours with custom, automated reporting.
Join 7,000+ agencies that create reports in under 30 minutes per client using AgencyAnalytics. Get started for free. No credit card required.
Already have an account?
Log in
Written by
Joe is the co-founder and CEO of AgencyAnalytics, a marketing reporting platform used by more than 7,000 agencies. With experience creating multiple businesses, he thrives on tackling the challenges of sustainable growth and innovation.
Read more posts by Joe KindnessSee how 7,000+ marketing agencies help clients win
Free 14-day trial. No credit card required.


