Table of Contents
Table of Contents
- What Is a Metrics Dashboard?
- Dashboards vs. Reports
- Marketing Dashboard Examples and Templates
- Why Should You Use a Metrics Dashboard? 5 Key Benefits
- Don’t Report on Fluff: Stick To Actionable Insights
- How To Quickly and Easily Create a Metrics Dashboard With AgencyAnalytics
- 3 AgencyAnalytics Features To Incorporate in Metrics Dashboards
- Transform Numbers Into Insights With a Metrics Dashboard
7,000+ agencies have ditched manual reports. You can too.
Free 14-Day TrialYou can’t evaluate your clients’ campaigns and marketing channels if you don’t know what’s happening, which is where a metrics dashboard comes in.
Data is a lifeline and is the only reliable way to make critical business decisions. After clients sign on the dotted line, they count on your agency to deliver results and help them meet their monthly key performance indicators.
Performance-tracking aside, it’s nearly impossible to manage a full roster of clients without the right agency processes.
So when the reporting periods roll around, how do you track multiple data sources for multiple clients? And how do you show clients and stakeholders what you’re working on? It isn’t about slapping some numbers in a manual spreadsheet or PDF file or dealing with excessive follow-ups like, “What’s my conversion rate this week?”
Impress clients and reduce churn with intuitive dashboard reporting software that’s easy to navigate. A marketing metrics dashboard is the only way to track real-time data-driven insights, keep clients in the loop, and save time along the way.
If you’re on the fence about investing in dashboard software, read on to learn about:
What Is a Metrics Dashboard?
Simply put, a business metrics dashboard is an interactive and visual display of your clients’ key data points across multiple sources.
The best part? Using dashboard tools means data retrieval is automated, which means less time compiling data and more time monitoring progress.
Accurate client reporting is a great way to show customers that your work is making a difference. It's also useful when all of the marketing data is centralized in one place, which leads to greater customer satisfaction.
Ryon Gross, CEO of Local Leap Marketing
No two business metrics dashboards are the same, though! It depends on your clients’ unique business needs and which insights are most relevant. While building an SEO dashboard may work for one client, another may need a more general automated KPI dashboard.
To give an idea of what a metrics dashboard looks like, here’s a digital marketing dashboard example.
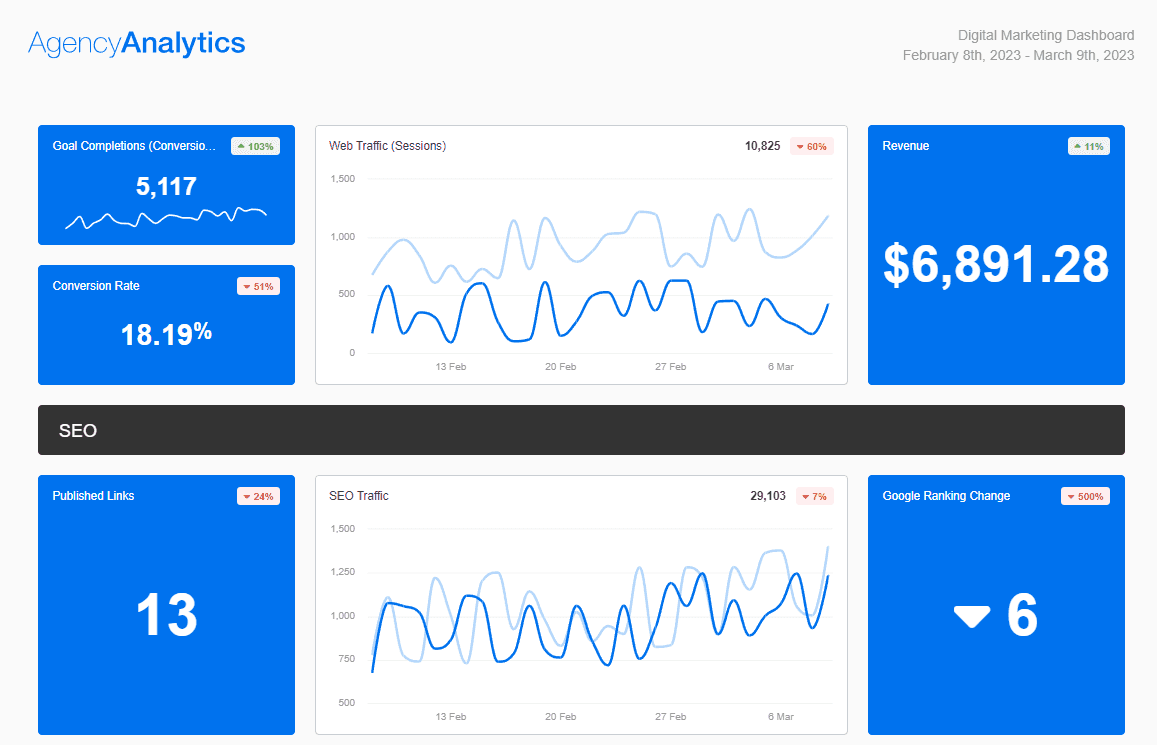
Try this exact marketing dashboard template in AgencyAnalytics. Start your free 14-day trial today.
Dashboards vs. Reports
While business dashboards and reports are undoubtedly similar, there are a few distinct differences between them. Let’s explore them below.
Similarities | Differences |
|---|---|
Provide snapshots of your clients’ data metrics | Dashboards are interactive and dynamic; reports are static |
Consolidate key metrics across multiple data sources | Dashboards offer real-time data updates, unlike reports which only include historical data |
There are both the pre-built marketing dashboard templates and report templates for ease of use | Dashboards require login access; reports are emailed or downloadable documents |
Wondering when to use each? It boils down to:
How granular your clients want to get with their campaign results
The level of autonomy clients want in accessing their own marketing data (they might need a Call Tracking dashboard to actively follow up on missed calls, for instance, or see all their reviews displayed to keep a finger on the pulse of their business’ customer service)
Which agency package your clients opted for (in case you might charge for real-time dashboard access)
How often your clients want to be kept in the loop (use a real time metrics dashboard for on-demand data access)
We use dashboards for weekly meetings and to create reports for our clients. They’re great because they allow the entire team to see the key performance indicators and data they need daily to make informed decisions.
Brian Ferritto, Partner at 42connect
Marketing Dashboard Examples and Templates
Wondering what are the uses of metrics dashboards? Here are a few top marketing dashboard template examples.
1. SEO Dashboard Template
Do you typically run SEO-related campaigns for your clients? Summarize the key metrics from your SEO campaigns using a well-designed SEO dashboard template, and showcase the long-term benefits of SEO to your clients.
By highlighting the metrics that matter most, you demonstrate how your efforts have improved their website's visibility, engagement, and overall business performance, paving the way for sustained growth and success.
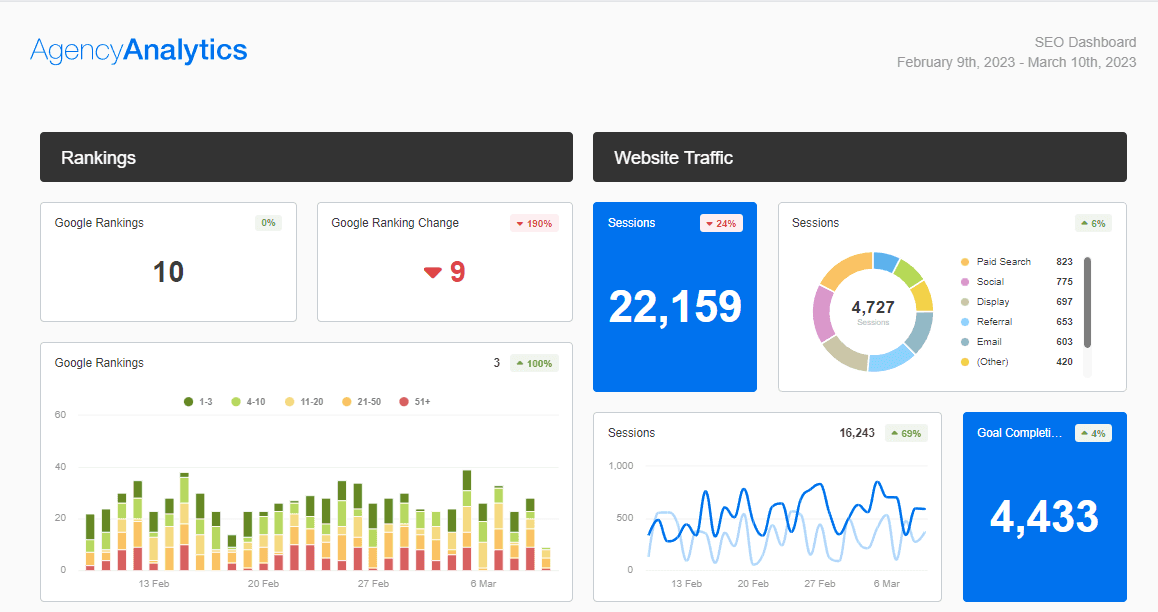
Keep on the pulse of your clients’ SEO efforts with ease. Pool insights across multiple SEO data sources on AgencyAnalytics–sign up for a free 14-day trial.
2. Social Media Dashboard Template
Got a lot of social media platforms to report on? Or a lot of important social media KPIs to track for each client? No need to sift through those numbers on Facebook Ads or Instagram. Use a social media dashboard template to package those insights in a visually appealing way.
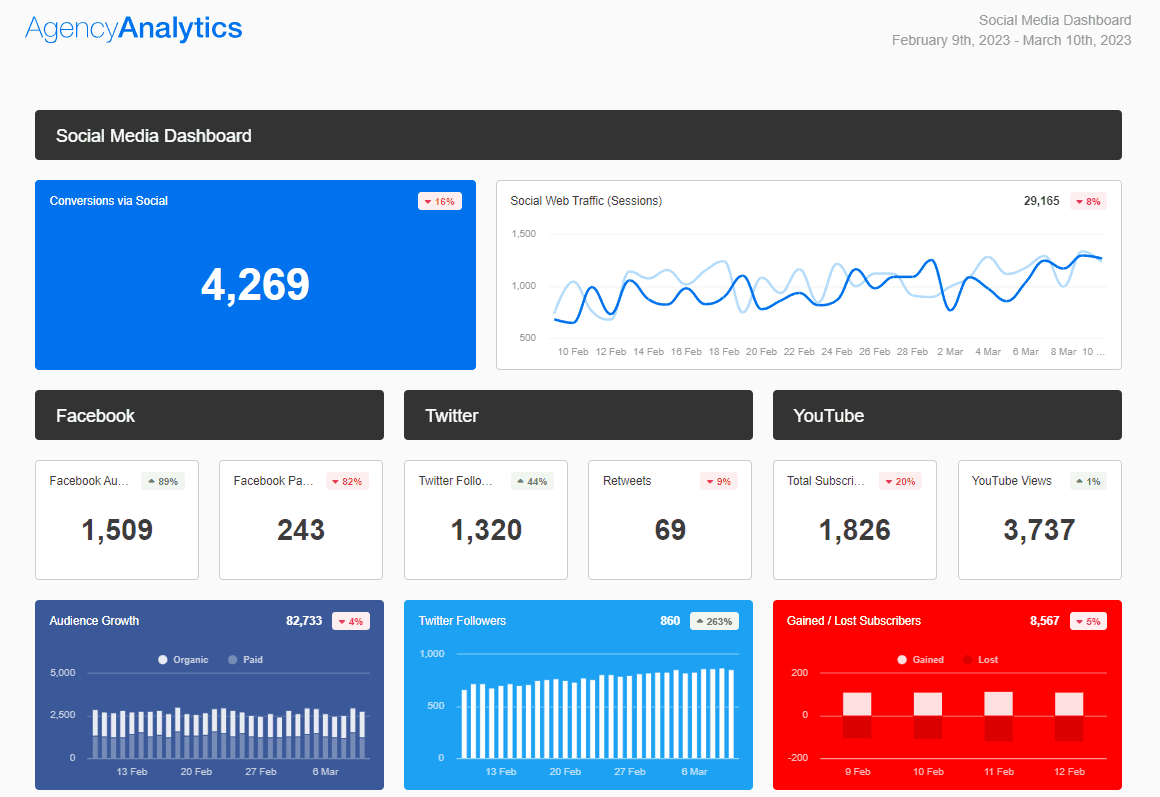
Still relying on manual screenshots for social media reporting? Use visually appealing dashboards on AgencyAnalytics instead–it’s free for 14 days.
3. PPC Dashboard Template
Paid advertising involves a significant investment from your clients. Show them exactly what they paid for by using a PPC dashboard template that captures return on ad spend (ROAS).
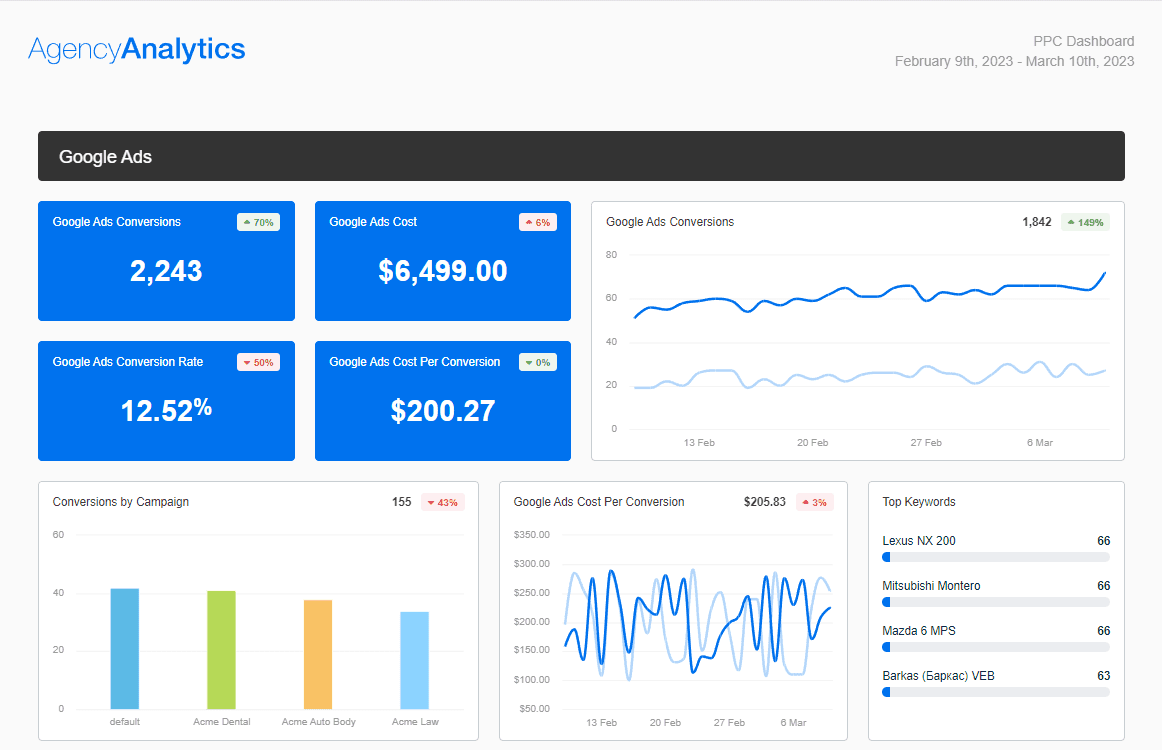
Use the AgencyAnalytics PPC dashboard to avoid client confusion about ad spend. Sign up for a free 14-day trial today!
Prefer a more customized approach? It’s easy to build a PPC dashboard (or any dashboard, really) and tailor it as you see fit. Stay tuned–we’ll explore the how-to later.
4. General Marketing Dashboard Template
Are you tracking metrics across a couple of data sources? Then a general marketing dashboard template may be your best bet.
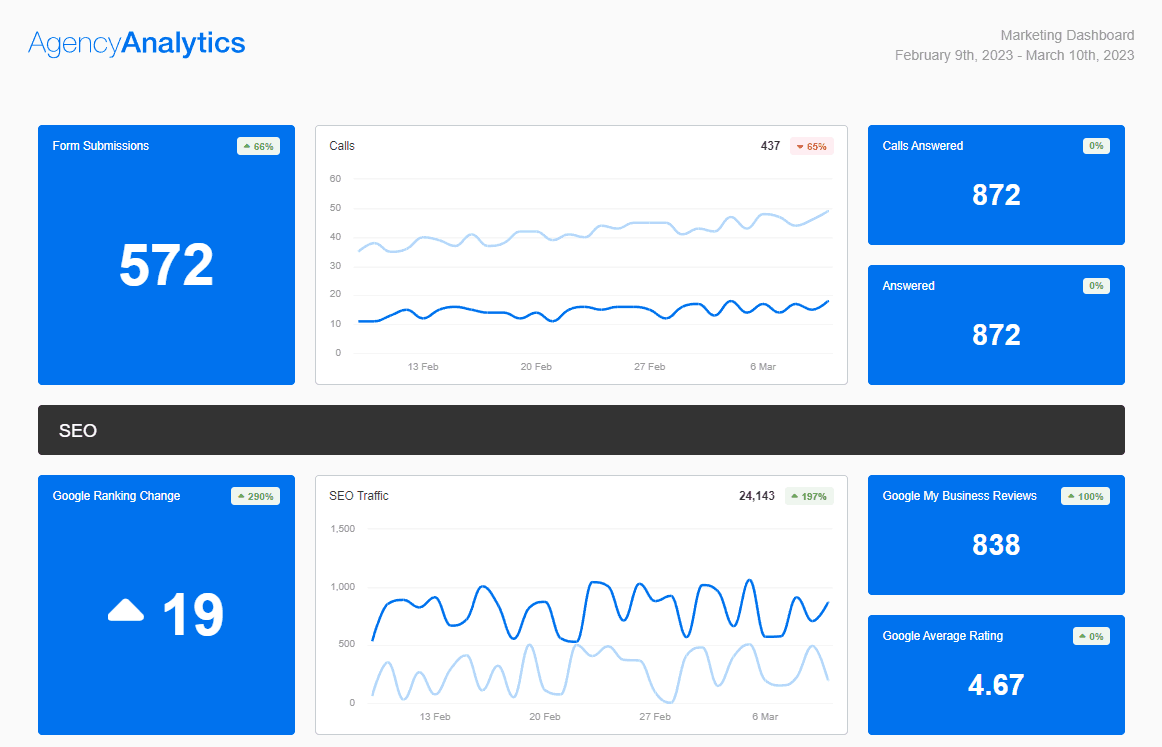
Consolidate metrics into a single marketing dashboard on AgencyAnalytics. Get started by signing up for a free 14-day trial!
5. Ecommerce Dashboard Template
Got clients that need to track eCommerce metrics? Easy-peasy: use a pre-built Ecommerce dashboard template. Have these metrics at your fingertips and report on insights like:
By monitoring the top eCommerce KPIs, your agency keeps a close eye on how activities are contributing to the client's bottom line.
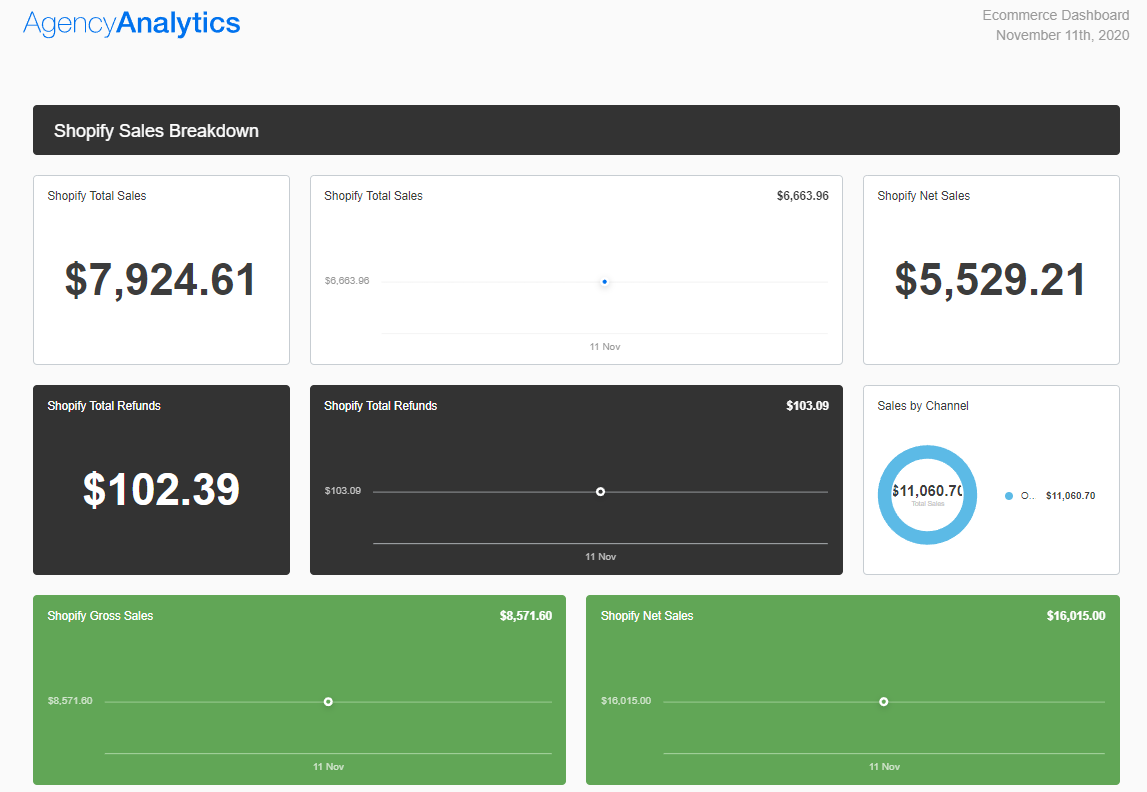
From Shopify to WooCommerce, an eCommerce dashboard streamlines revenue metrics in one place. Use this exact metrics dashboard template on AgencyAnalytics–it’s free for 14 days.
Read more: 12 Key Metrics to Track in Your Shopify Reports
Why Should You Use a Metrics Dashboard? 5 Key Benefits
While it may seem like an added step, a metrics dashboard is an incredibly useful tool for agencies like you–here’s why.
1. Monitor the Health of Your Clients’ Marketing Campaigns
Think of metrics as diagnostic tools for evaluating your clients’ marketing health.
Is there an abnormally high bounce rate in Google Analytics this month? Perhaps conversion rates are through the roof. Whatever the case, metrics are the gauges of marketing performance, and your clients need them to make sound decisions.
We have a metrics dashboard that we review during our weekly client meetings. This allows us to show how various efforts are working visually. Our meetings run smoother, we are able to talk through insights from marketing channels more easily. By spending less time on smaller tasks, we focus more on our clients' needs, recognize opportunities, and spend more time on execution and optimizations.
Tim Akers, Founder of Akers Digital
Luckily, a metrics dashboard is a convenient way to break down complex data into a more digestible format.
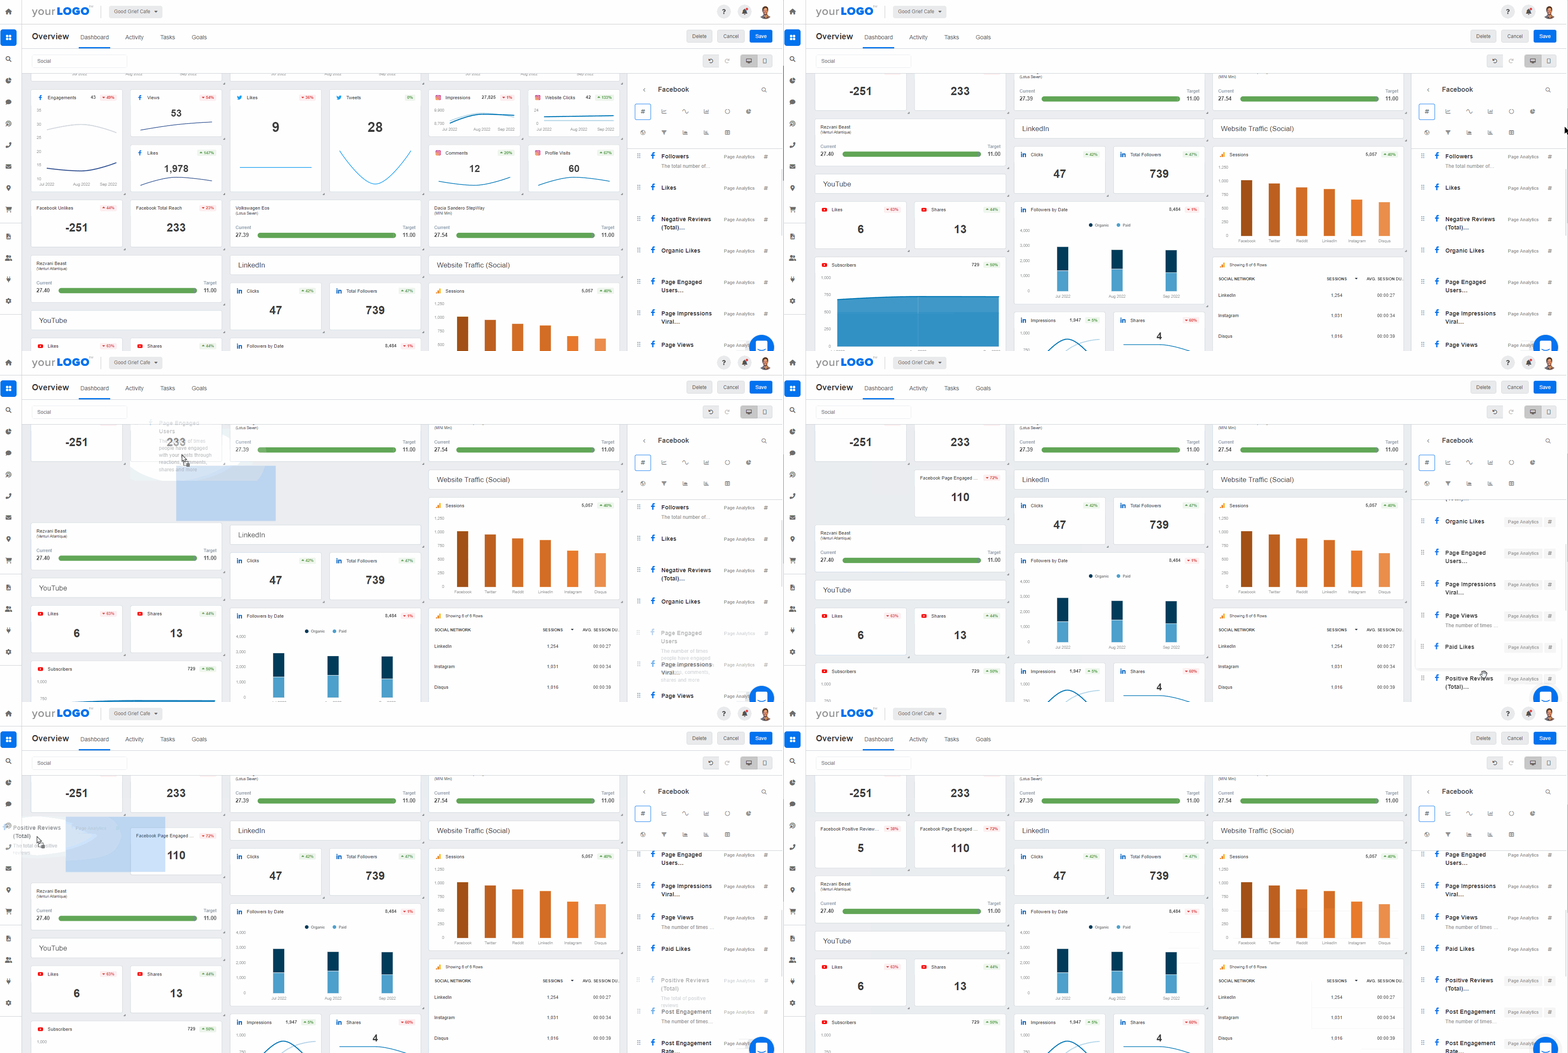
Diagnose marketing performance issues and understand the bigger picture. Choose from a range of metrics dashboards on AgencyAnalytics, free for 14 days.
2. Consolidate Insights from Multiple Data Sources
Marketing is multi-dimensional, and your clients’ campaigns are often intertwined and interdependent.
To understand the full impact of cross-campaign efforts, your agency needs a way to consolidate insights from multiple sources (Google Analytics, etc.). Did a viral social media post lead to increased website traffic? Showing that correlation is easy-peasy–put those insights side-by-side on a metrics dashboard.
A challenge we faced was finding ways to deliver results for our clients more efficiently and effectively. To solve this, we implemented tools like AgencyAnalytics to pull data from many sources. This allows us to provide our growing roster of clients with detailed reports that illustrate the bigger picture while spending less time doing it each month.
Adam Binder, Founder + CEO at Creative Click Media
3. Replicate Dashboards for Scalability and Faster Reporting
Who wants to create metrics dashboards from scratch? Nobody, that’s who (especially when you’ve got billable hours to maximize).
Dashboards can be copied to create a template for future client reports, and the data just feeds directly into the interface without any heavy lifting. Our clients absolutely love our reporting capabilities!
Adam Allen, CEO of LeaseMyMarketing
As Brian Ferritto, Partner at 42connect, puts it, “Whenever you have repeatable tasks that can be automated, you make the agency more efficient. Being more efficient means people have more time available to do other things, such as take on more billable work.”
After you’ve created a custom dashboard or used a pre-built dashboard template, create a copy with the click of a button. Not only will this save time during client onboarding, but it’s also a sustainable way to scale your agency.
There are a lot of metrics to choose from. So first, you need to invest the time to set up proper dashboards. But it’s super easy when you first get into it. Templates are a life savior because you can just duplicate them each time a new client comes along. That way, you won’t have to make a whole new metrics dashboard each time.
Mikael Sørensen, Head of Marketing at Adtention
4. Bring Metrics to Life With Data Visualizations
Metrics on their own are just that–numbers on a screen. If it’s an eyesore for your agency, imagine your clients!
Bring them to life through eye-catching data visualizations. It’s your agency’s best bet to share data-driven insights with greater ease of understanding.
AgencyAnalytics’ templates goes above and beyond what you can create in Google Sheets. It helps clients to visualize data at the click of a single button. If you aren't integrating all of your client data points, making use of data visualizations, and creating custom dashboards on AgencyAnalytics, you’re missing out!
Graham Lumley, Director of Growth Marketing at Blackhawk Digital Marketing
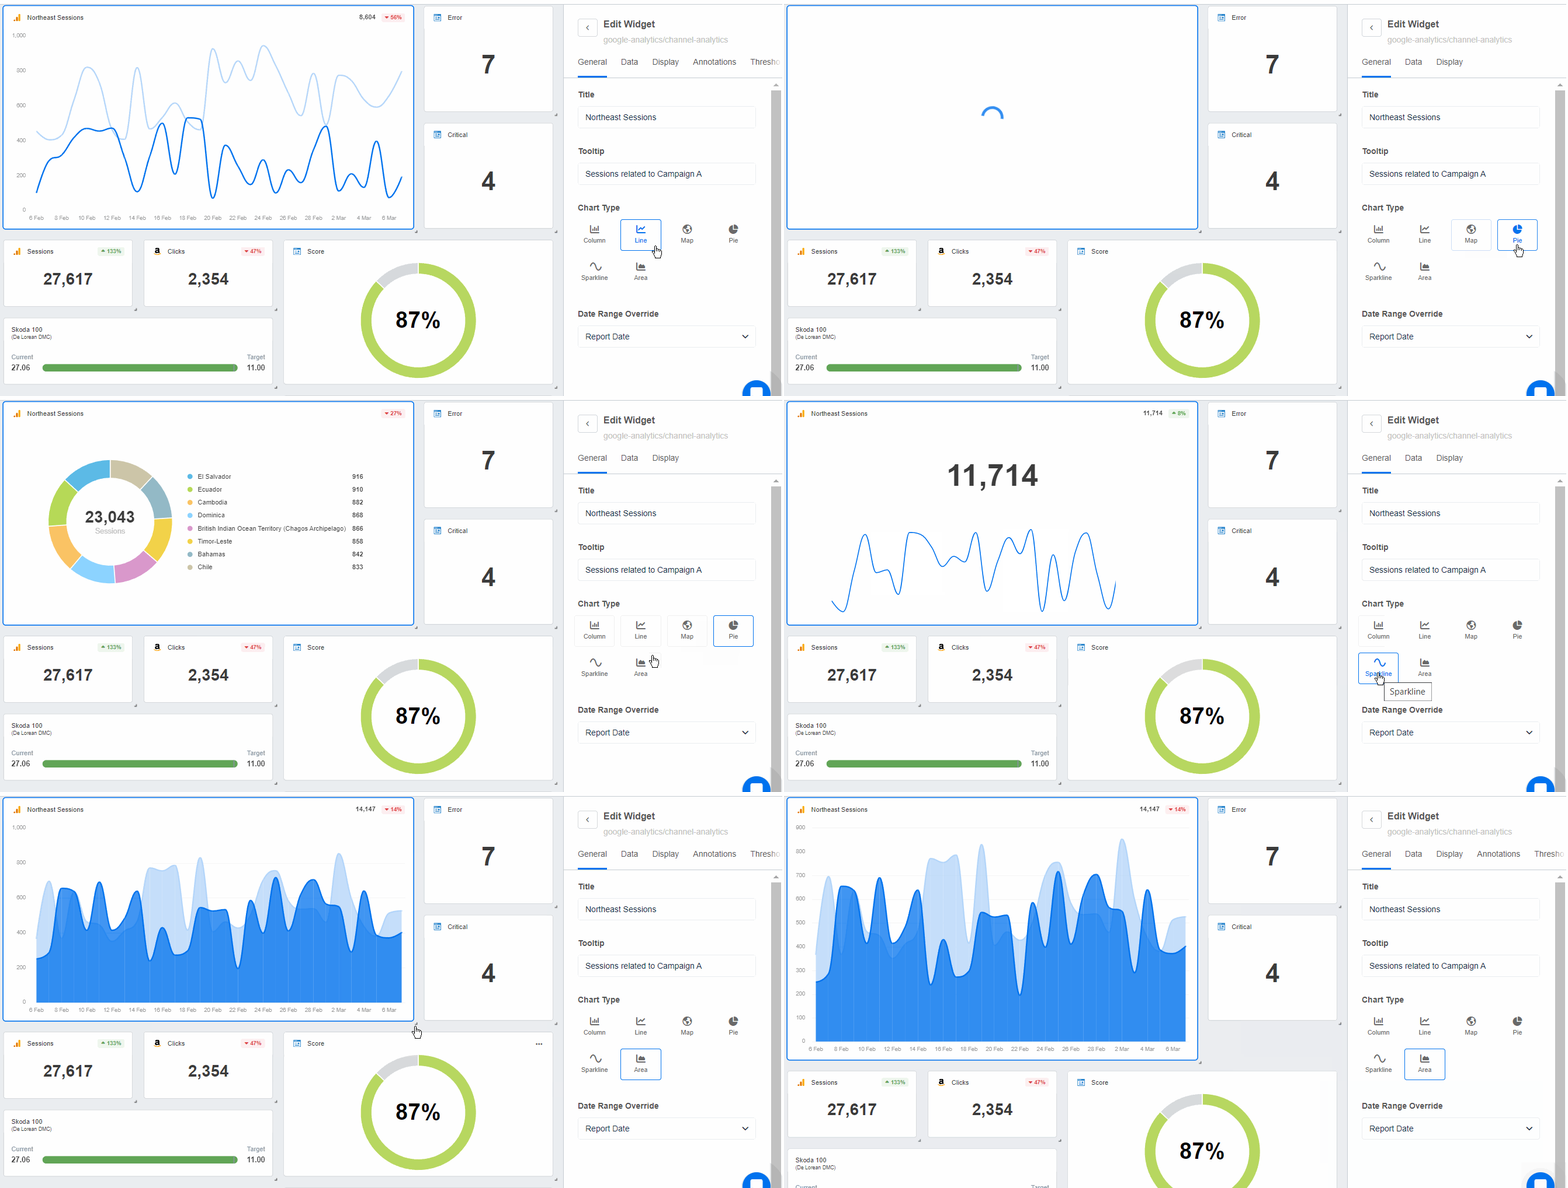
Make sense of your clients’ numbers and get your points across quickly. Choose from a range of captivating visuals that speak for themselves on AgencyAnalytics, free for 14 days.
5. Significantly Reduces the Chances of Human Errors
Manual reporting means increasing your chances of human errors (such as copy and paste errors).
As your agency grows, those errors have the potential to be variable and even catastrophic. Even if you make a few minor mistakes here and there, it adds up. If you’re already making manual errors for one client, imagine when there are 100 clients on your agency’s roster.
Forgetting to add that one zero at the end of a revenue metric could throw off a client’s future projections. And pasting the ‘number of impressions’ under the ‘number of sales’ metric may lead a client to believe there were 10,000 conversions (when in reality, there were 10).
Worse yet–this mistakes will throw off their sales process and cast doubt on your agency’s capabilities.
Why open a can of worms when you don’t have to? A metrics dashboard removes the nightmare of manual omission errors or other human oversights. No need to worry about your Marketing Analyst typing metrics or copying and pasting a million screenshots into a spreadsheet!
Maximize your staff’s time, improve efficiency, and make the most of your billable hours–it’s essential for your agency’s growth.

Don’t Report on Fluff: Stick To Actionable Insights
Not everything is worth reporting on, and not all metrics are built equally. Before you hit the gas on using dashboard software, keep these tips in mind.
Understand the Difference Between Metrics and KPIs
One of the worst things you can do is report back to the client some perceived huge win based on whatever metric it is you're using, only to hear back that they are not seeing any positive improvement on their end. Reporting on the proper metrics that actually move the client's needle is crucial.
Kurt Schell, President of Lithium Marketing
First things first–distinguish between KPIs and metrics. While they’re both numerical measures, some metrics may not always be relevant to your clients’ goals.

Remember, all KPIs are metrics, but not all metrics are KPIs. The last thing you want is a dashboard that’s full of vanity metrics and no real results.
Vanity metrics are insights that make you look good to others but do not help you understand your own performance metrics for future strategic planning. Actionable metrics offer you insight into changes you should make and strategies you should continue that will actually have a meaningful impact.
Evaluate What’s Important to Your Clients
Success means different things for different clients. To get started, ask your clients the following questions:
What are your overall business goals?
What do you hope to achieve from your marketing efforts?
Do you have a timeline for achieving your goals?
Based on their responses, come up with marketing campaigns that align with their long-term goals and explain which metrics are most applicable (and why).
There are basic key performance indicators such as spend, clicks, impressions, ranking, etc., but the real KPIs every client wants to know are leads and sales performance. Ultimately, what is their ROI from our efforts? When you can clearly demonstrate this month over month, it increases your client retention rate and keeps clients paying you month after month.
Jacob Hicks, Owner of Magnyfi
And remember to ensure that each key performance indicator is SMART (specific, measurable, attainable, relevant, and timely). That way, you'll set realistic goals and increase the chances of success.
How To Quickly and Easily Create a Metrics Dashboard With AgencyAnalytics
Recently onboarded a new client and looking to duplicate that handy marketing analytics dashboard, web analytics dashboard, or a digital marketing report template that includes all of the client's most important digital marketing analytics? Or, perhaps, you want to use a digital marketing reporting tool to build a dashboard from scratch.
Whatever the case, here’s a general step-by-step guide on how to do it on AgencyAnalytics.
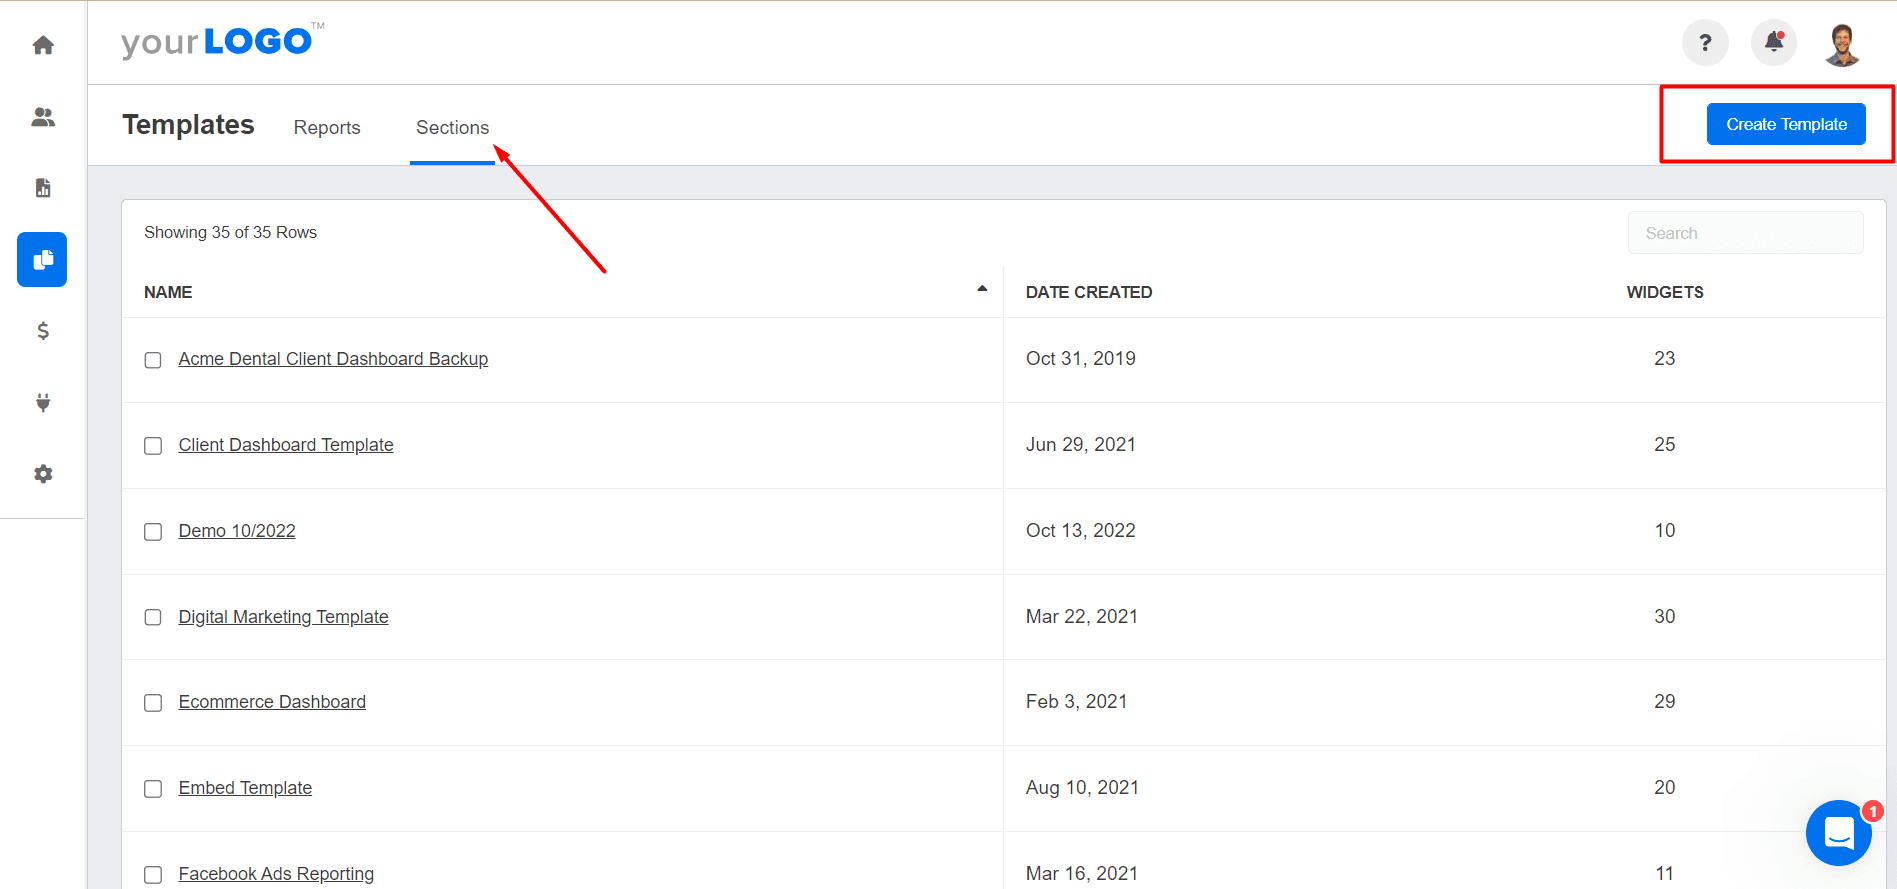
1. Go to your AgencyAnalytics account and click on ‘Templates’ on the left-hand menu.
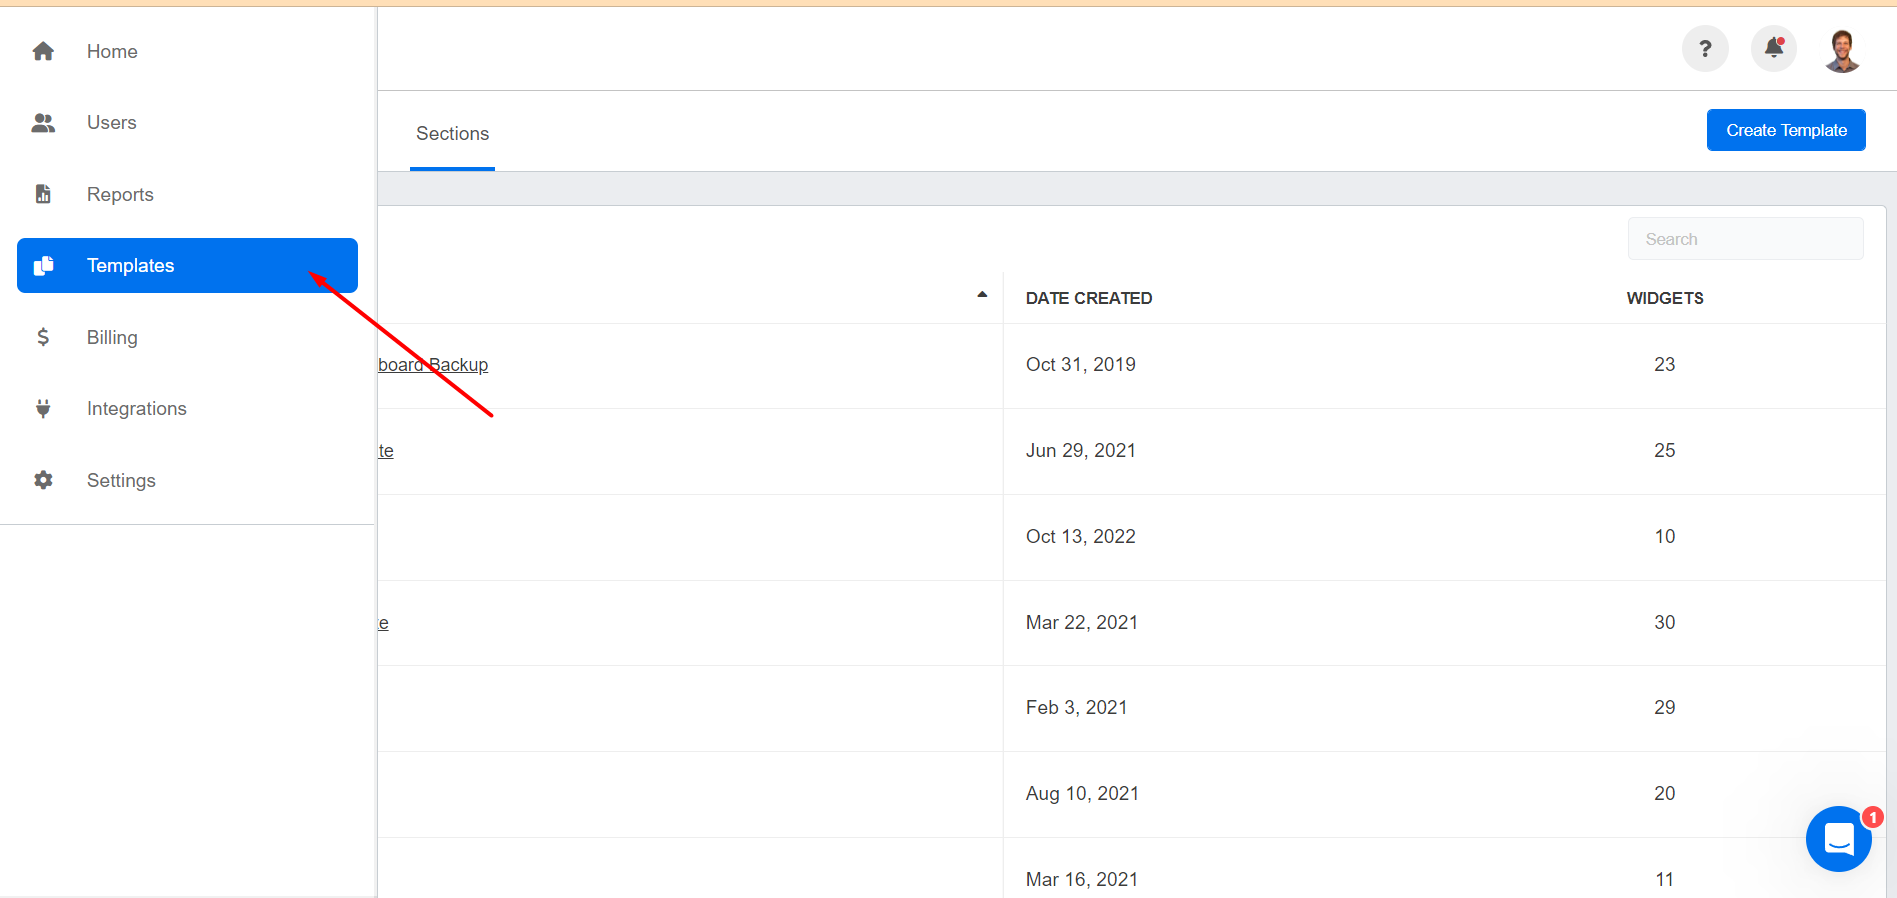
2. Next up, click on the ‘Sections’ option and the ‘Create Template’ button.
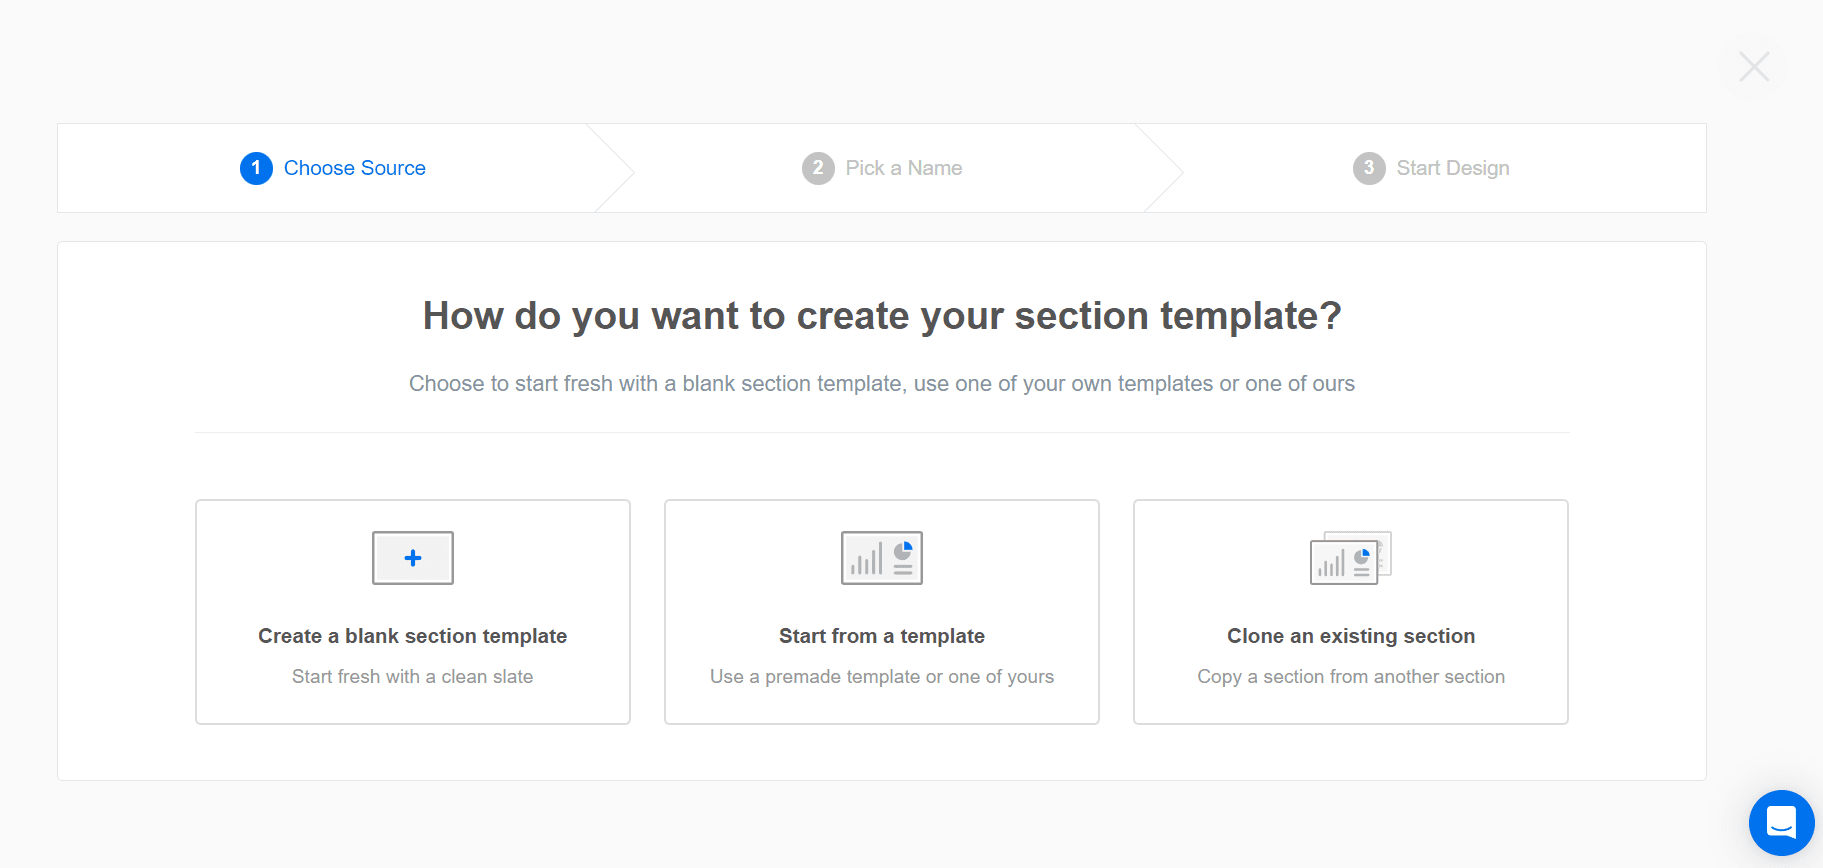
3. Choose from the following options:
Create your own metrics dashboard from scratch
Start with a pre-built AgencyAnalytics business dashboard or use one of your existing ones
Duplicate a specific section from an existing dashboard
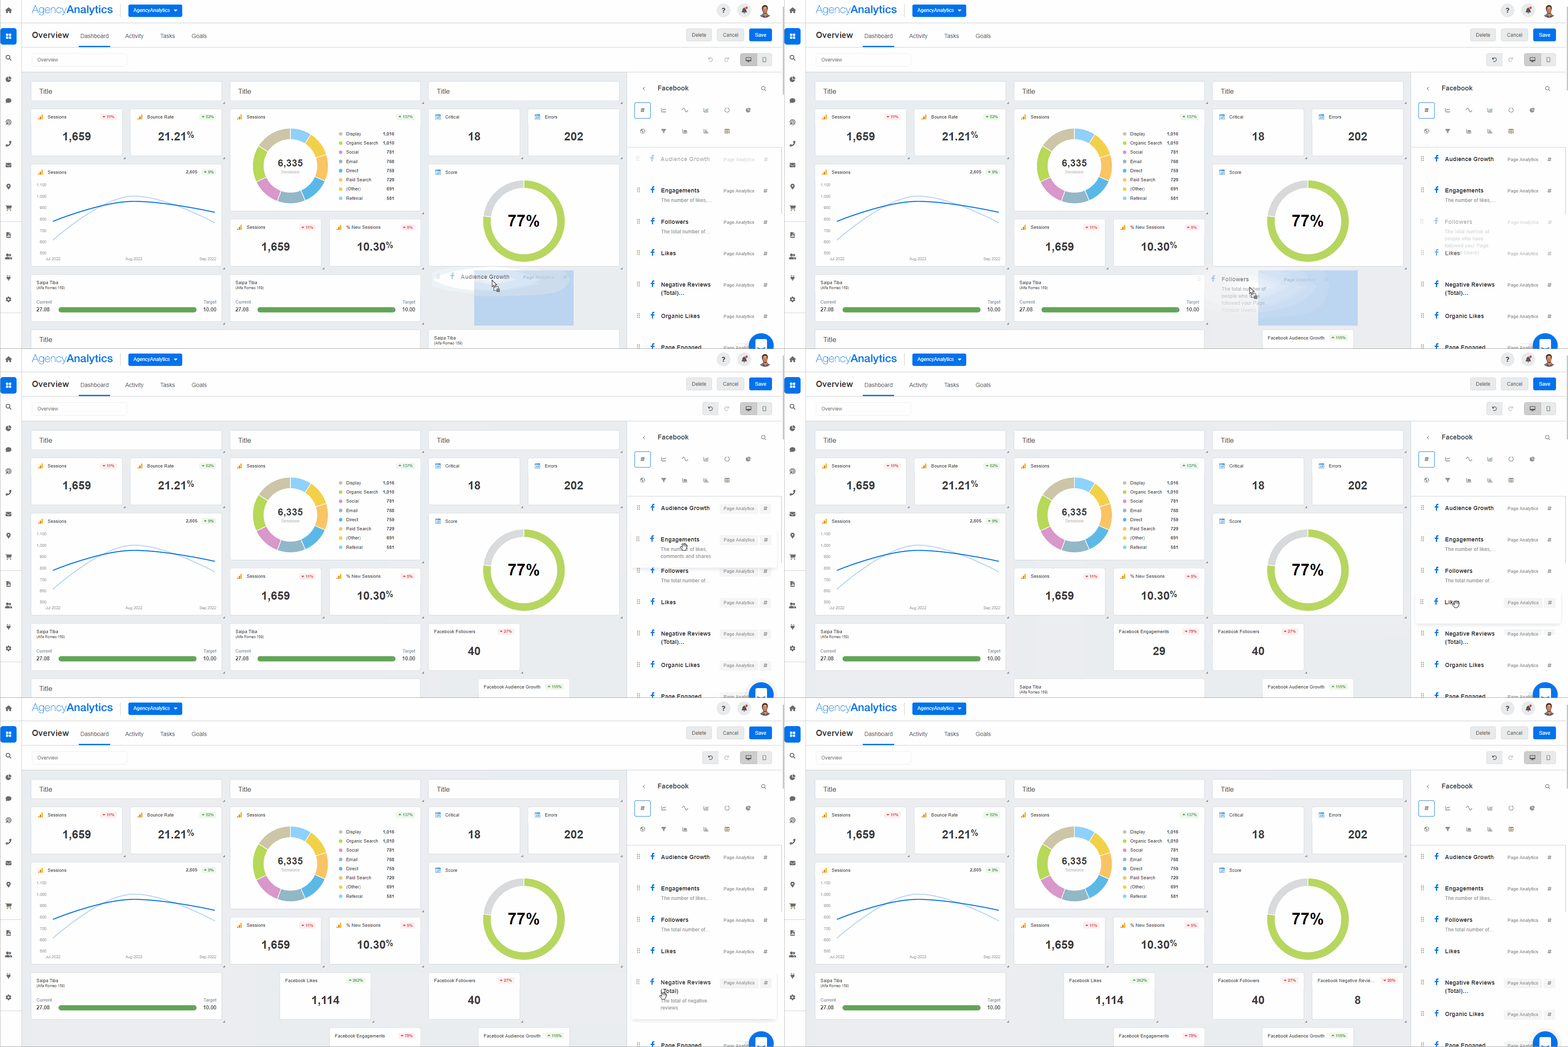
4. Customizing your performance metrics dashboard? Choose which widgets to include from the right-hand menu. It’s as easy as drag and drop!
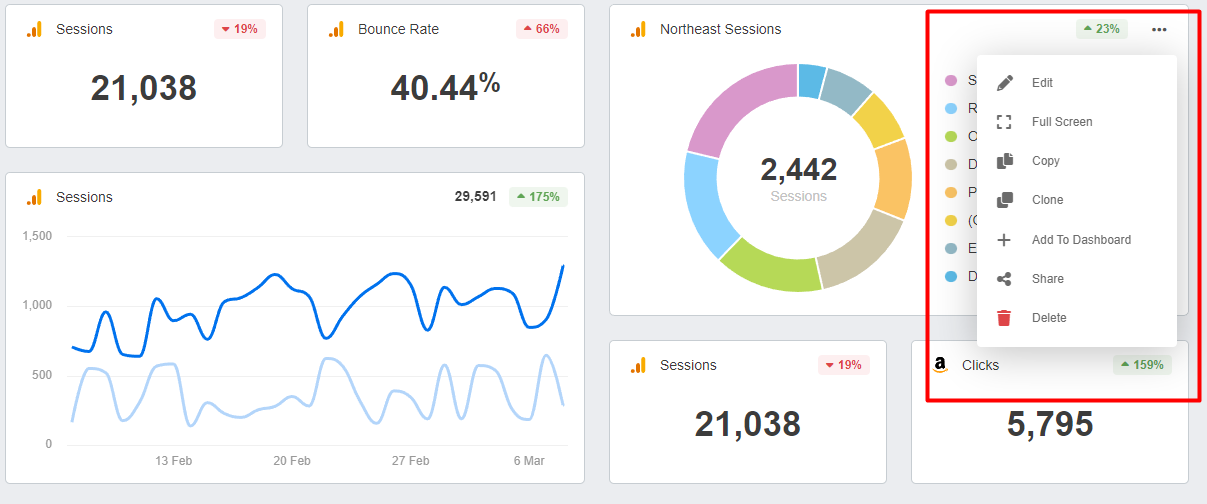
5. Duplicate, customize, and tweak widgets on your metrics dashboard as needed–it’s that simple.
3 AgencyAnalytics Features To Incorporate in Metrics Dashboards
It’s no secret–AgencyAnalytics was made for marketing agencies like you! To optimize your metrics dashboards, make use of the following features below.
1. Use Annotations To Add More Context and Meaning
It’s difficult to spot trends or correlations if you don’t take a data storytelling approach to metric tracking.
Was there a spike in conversion rates because of a boost in ad spend? Your clients may not be able to identify these happenings right away. To provide clarity, add annotations to their metrics dashboard and explain what’s really happening.
Don’t just show the metrics, show the WHY behind the metrics. Explain why is it important that we look at specific numbers each month and what they mean for the overall health of their marketing and growth of their company.
Jessica Weiss, Director of Marketing & Strategic Partnerships at One Firefly
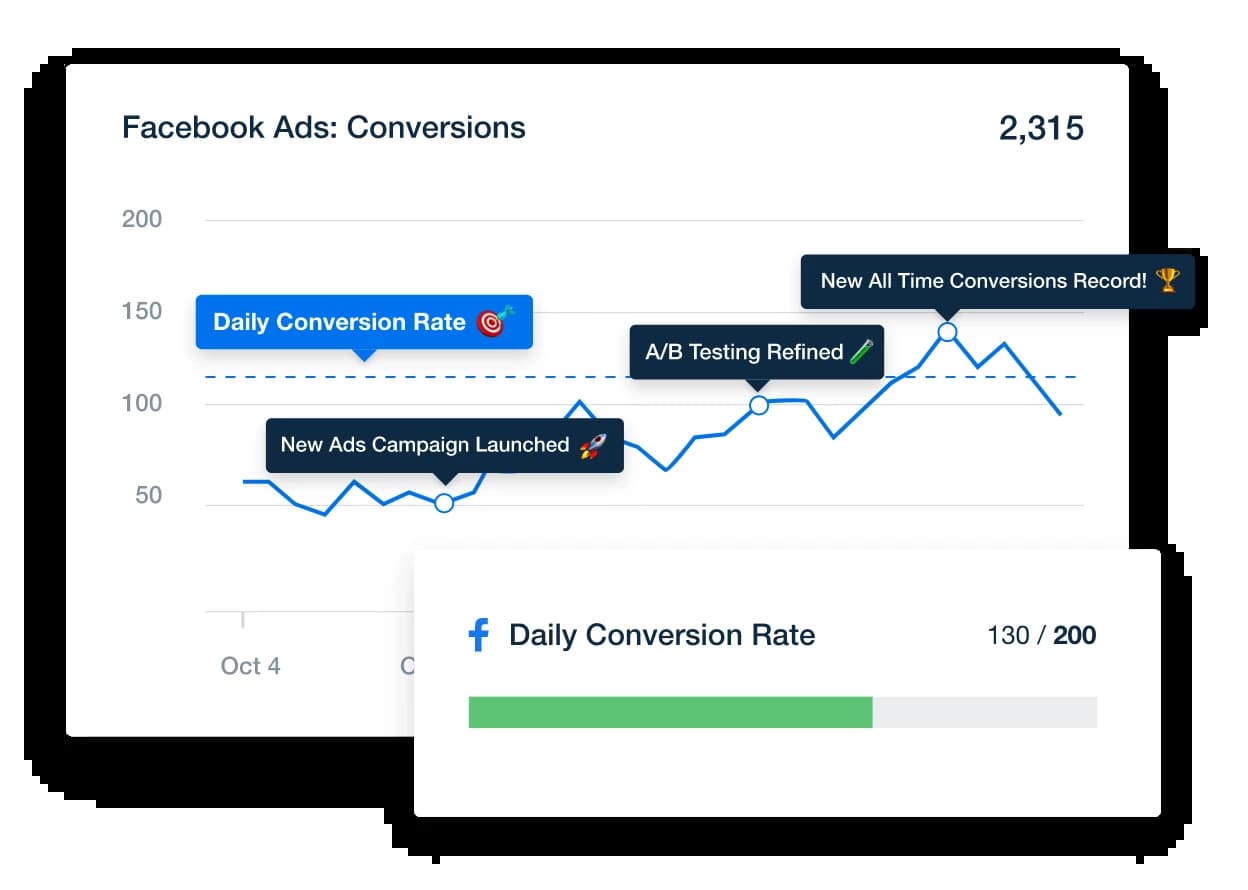
Go the extra mile by adding annotations to data points. Deliver easy-to-understand insights on AgencyAnalytics–it’s free for 14 days.
2. Add Visual Goal-tracking Progress Bars
An effective metrics dashboard means providing performance markers and progress updates. Are your clients on track to meet their targets? No need to make wild guesses. Get the most from your metrics dashboard by adding a progress bar to visually show how things are coming along.
Consider this added bonus: if your clients’ marketing campaigns need tweaks, goal-tracking lets you identify any issues early enough before they really become issues.
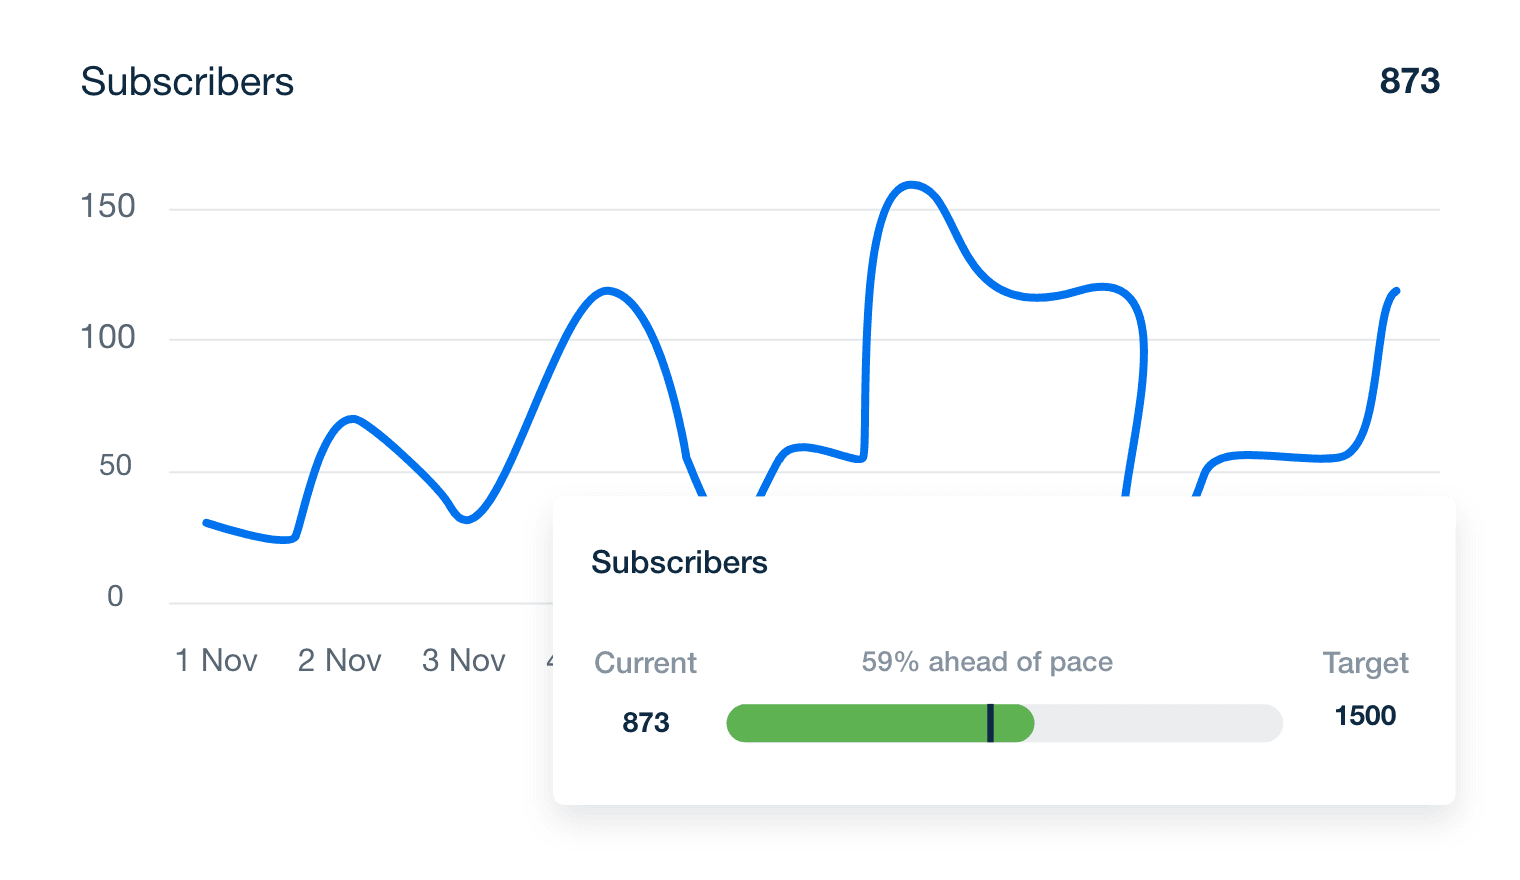
Create custom goals that reflect your clients’ unique business objectives on AgencyAnalytics. Sign up for a free 14-day trial today!
3. Go Beyond Generalizations With Custom Metrics
Sometimes, generic metrics just aren’t enough. Your clients may have a unique way of calculating metrics or defining what success looks like.
For example, say you’ve got a retail client with multiple locations. Perhaps they’re running a nationwide campaign and need to see a consolidated marketing metric.
No need to whip out a manual spreadsheet and come up with complex formulas. Use the custom metrics feature to report on insights that actually matter to your clients.
Client dashboards and custom metrics are extremely valuable. We save a lot of time each month by sharing a metrics dashboard where our clients can regularly check in and see status updates from our team. The ability to add custom metrics also makes things easier for us to aggregate KPIs across different channels.
Bryan Lozano, Vice President of Operations at Ad-Apt
Wondering how to create a custom metric on AgencyAnalytics? Check out the video below!
Should You Grant Your Clients Login Access?
If you’re hesitant about providing dashboard access, here are a few reasons why it’s something to consider.
Manage What’s Shared by Assigning User Permissions
Control the data your clients have access to. User permissions reduce the chances of sharing irrelevant data on their business dashboard or overwhelming them with too many numbers.
There's a big emphasis on reporting in the marketing industry in order to show value and progress. But one of the worst things you can do is report back to the client some perceived huge win based on whatever metric it is you're using, only to hear back that they are not seeing any positive improvement on their end.
Kurt Schell, President of Lithium Marketing
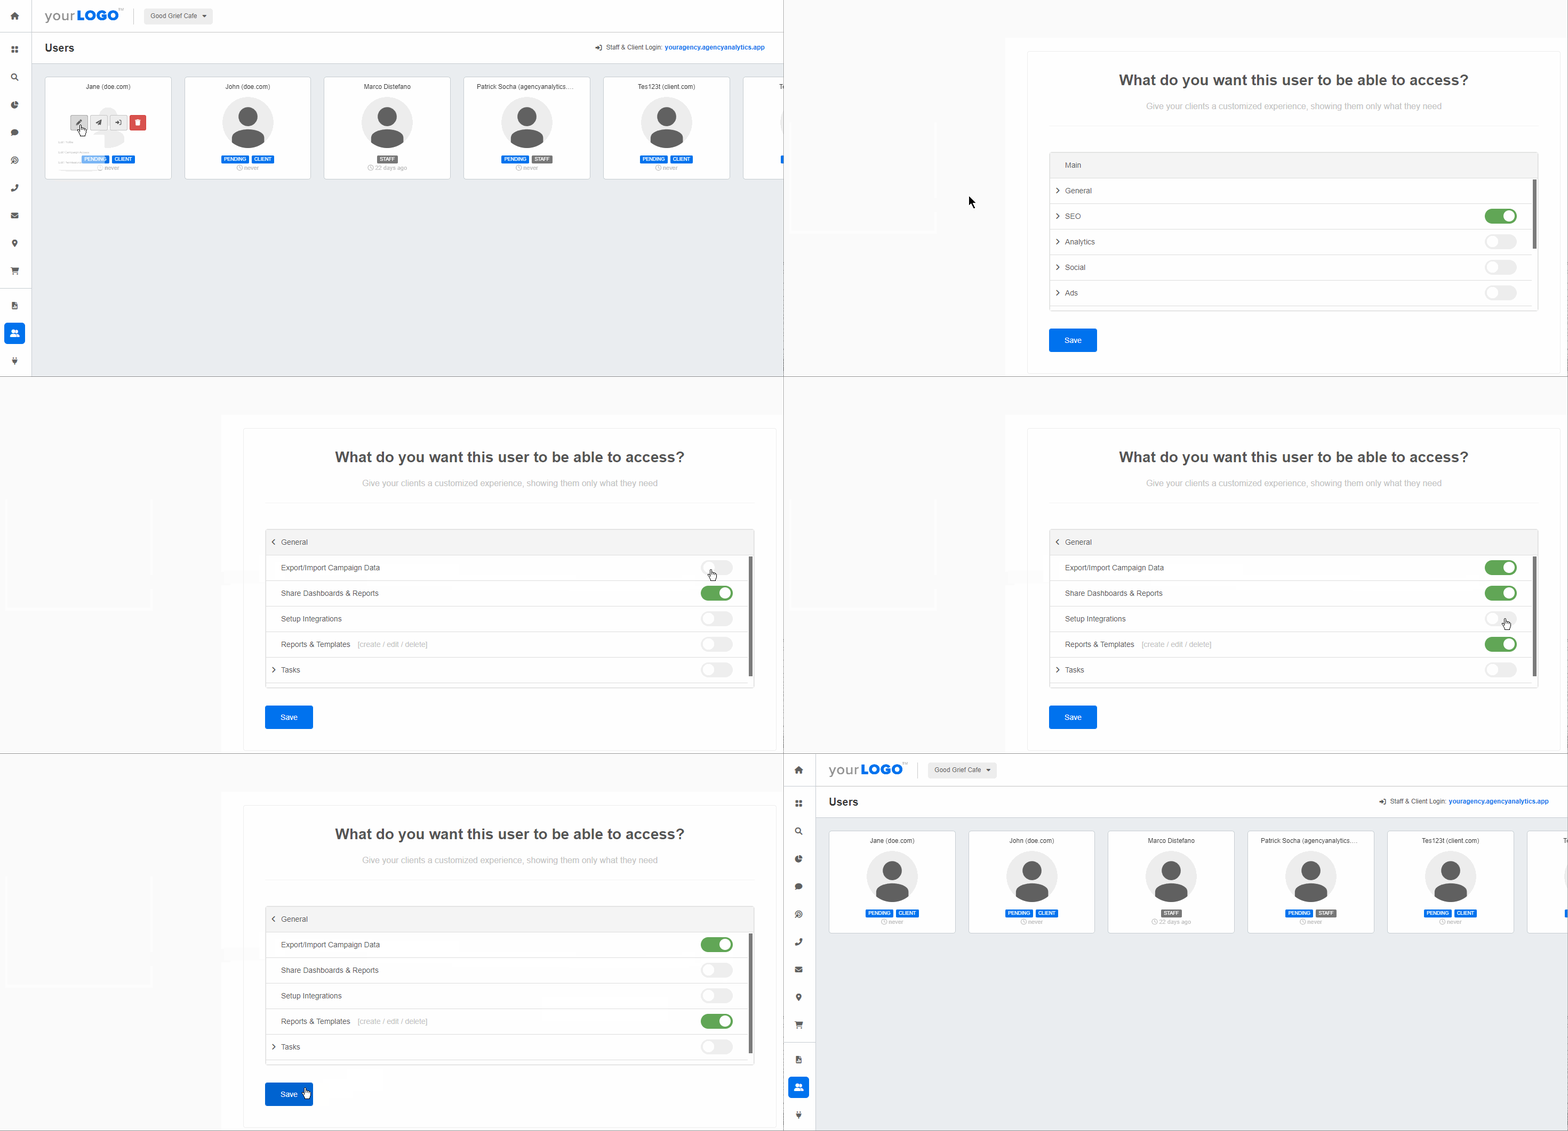
Don’t overwhelm your clients with irrelevant data. Set user permissions when granting client login access–try it on AgencyAnalytics, free for 14 days.
Client Dashboard Access Increases Transparency and Builds Trust
Giving your clients access to their KPI dashboards means complete transparency and even exceeding client expectations. Better yet–there’ll be no question about business performance or how things progress over time.
We don't send reports as we encourage our clients to access their AgencyAnalytics metrics dashboard for a full level of transparency from a reporting level. Often, reports can be skewed, so we don't send reports and grant them login access instead.
David Friedman, Technical SEO Manager at PaperStreet Web Design
The result? Your clients will have complete autonomy over their data insights, saving your agency time from follow-up calls or emails. Build a foundation of trust from the get-go, and it’ll increase client loyalty in the process.
We operate on trust, and transparency is required for trust. Providing a login means we have nothing to hide–because we don't! And we want to be partners with our clients and in their success.
Lorianna Sprague, Vice President of Marketing at Trusted Search Marketing
Transform Numbers Into Insights With a Metrics Dashboard
Clients come to your agency for advice and solutions.
While relying on manual reporting in the earlies is relatively manageable, it’s not a sustainable solution for long-term data-tracking.
Don’t compromise your agency’s growth potential or waste billable hours–add metrics dashboards to your suite of time-saving tools.
In summary, use a metrics dashboard to:
Visually show what’s happening with your clients’ multiple marketing efforts
Automate data retrieval to cut down on manual work
Scale your agency through quick and easy replication of dashboards
Make informed recommendations by tracking key insights and in-depth data analysis
Metrics dashboards on AgencyAnalytics aren’t just aesthetically pleasing–they show real results and may even lead to new business opportunities.
The simplicity AgencyAnalytics provides is a huge benefit not only for our existing clients but for our ability to sign on new accounts. When we pull up an AgencyAnalytics dashboard during the sales process, 100% of our leads immediately see the value this reporting can bring to their business. It helps us organize data and seal the deal several times per month!
Graham Lumley, Director of Marketing at Blackhawk Digital Marketing
Cut through the noise of complex data, ensure your metrics reflect client interests, and amaze them time and time again with your success. Start with a pre-built marketing report template, and then weave data visualizations into narratives that truly connect.
Invest in your agency’s success, and don’t waste another minute on outdated manual reporting!
Use a customizable Google Analytics Report Template or a professional Social Media Report Template to automatically create and send client reports in minutes. Try AgencyAnalytics free for 14 days!

Written by
Faryal Khan is a multidisciplinary creative with 10+ years of experience in marketing and communications. Drawing on her background in statistics and psychology, she fuses storytelling with data to craft narratives that both inform and inspire.
Read more posts by Faryal KhanSee how 7,000+ marketing agencies help clients win
Free 14-day trial. No credit card required.


