How To Build a PPC Reporting Dashboard to Track Performance

How to Build a PPC Reporting Dashboard

QUICK SUMMARY:

Marketing agencies that build a PPC reporting dashboard get an overview of crucial campaign metrics (for every client) in a single view. With just a few clicks, they can quickly adjust and improve pay-per-click strategies in real-time with key insights from Google Analytics to optimize ad spend effectively.

If you’re managing paid ads for clients across multiple platforms, tracking the performance of the entire PPC budget can often be overwhelming and time-consuming.

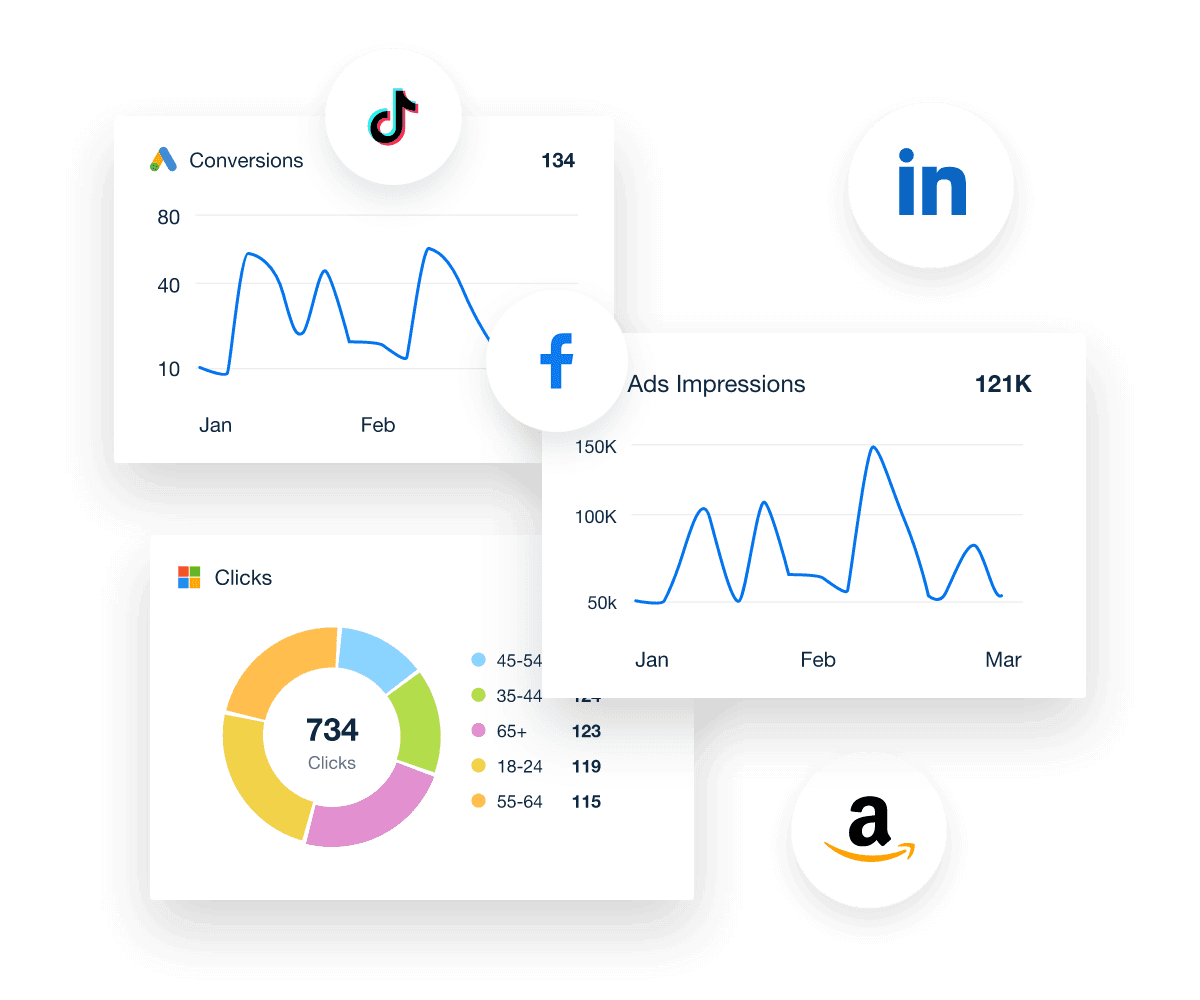
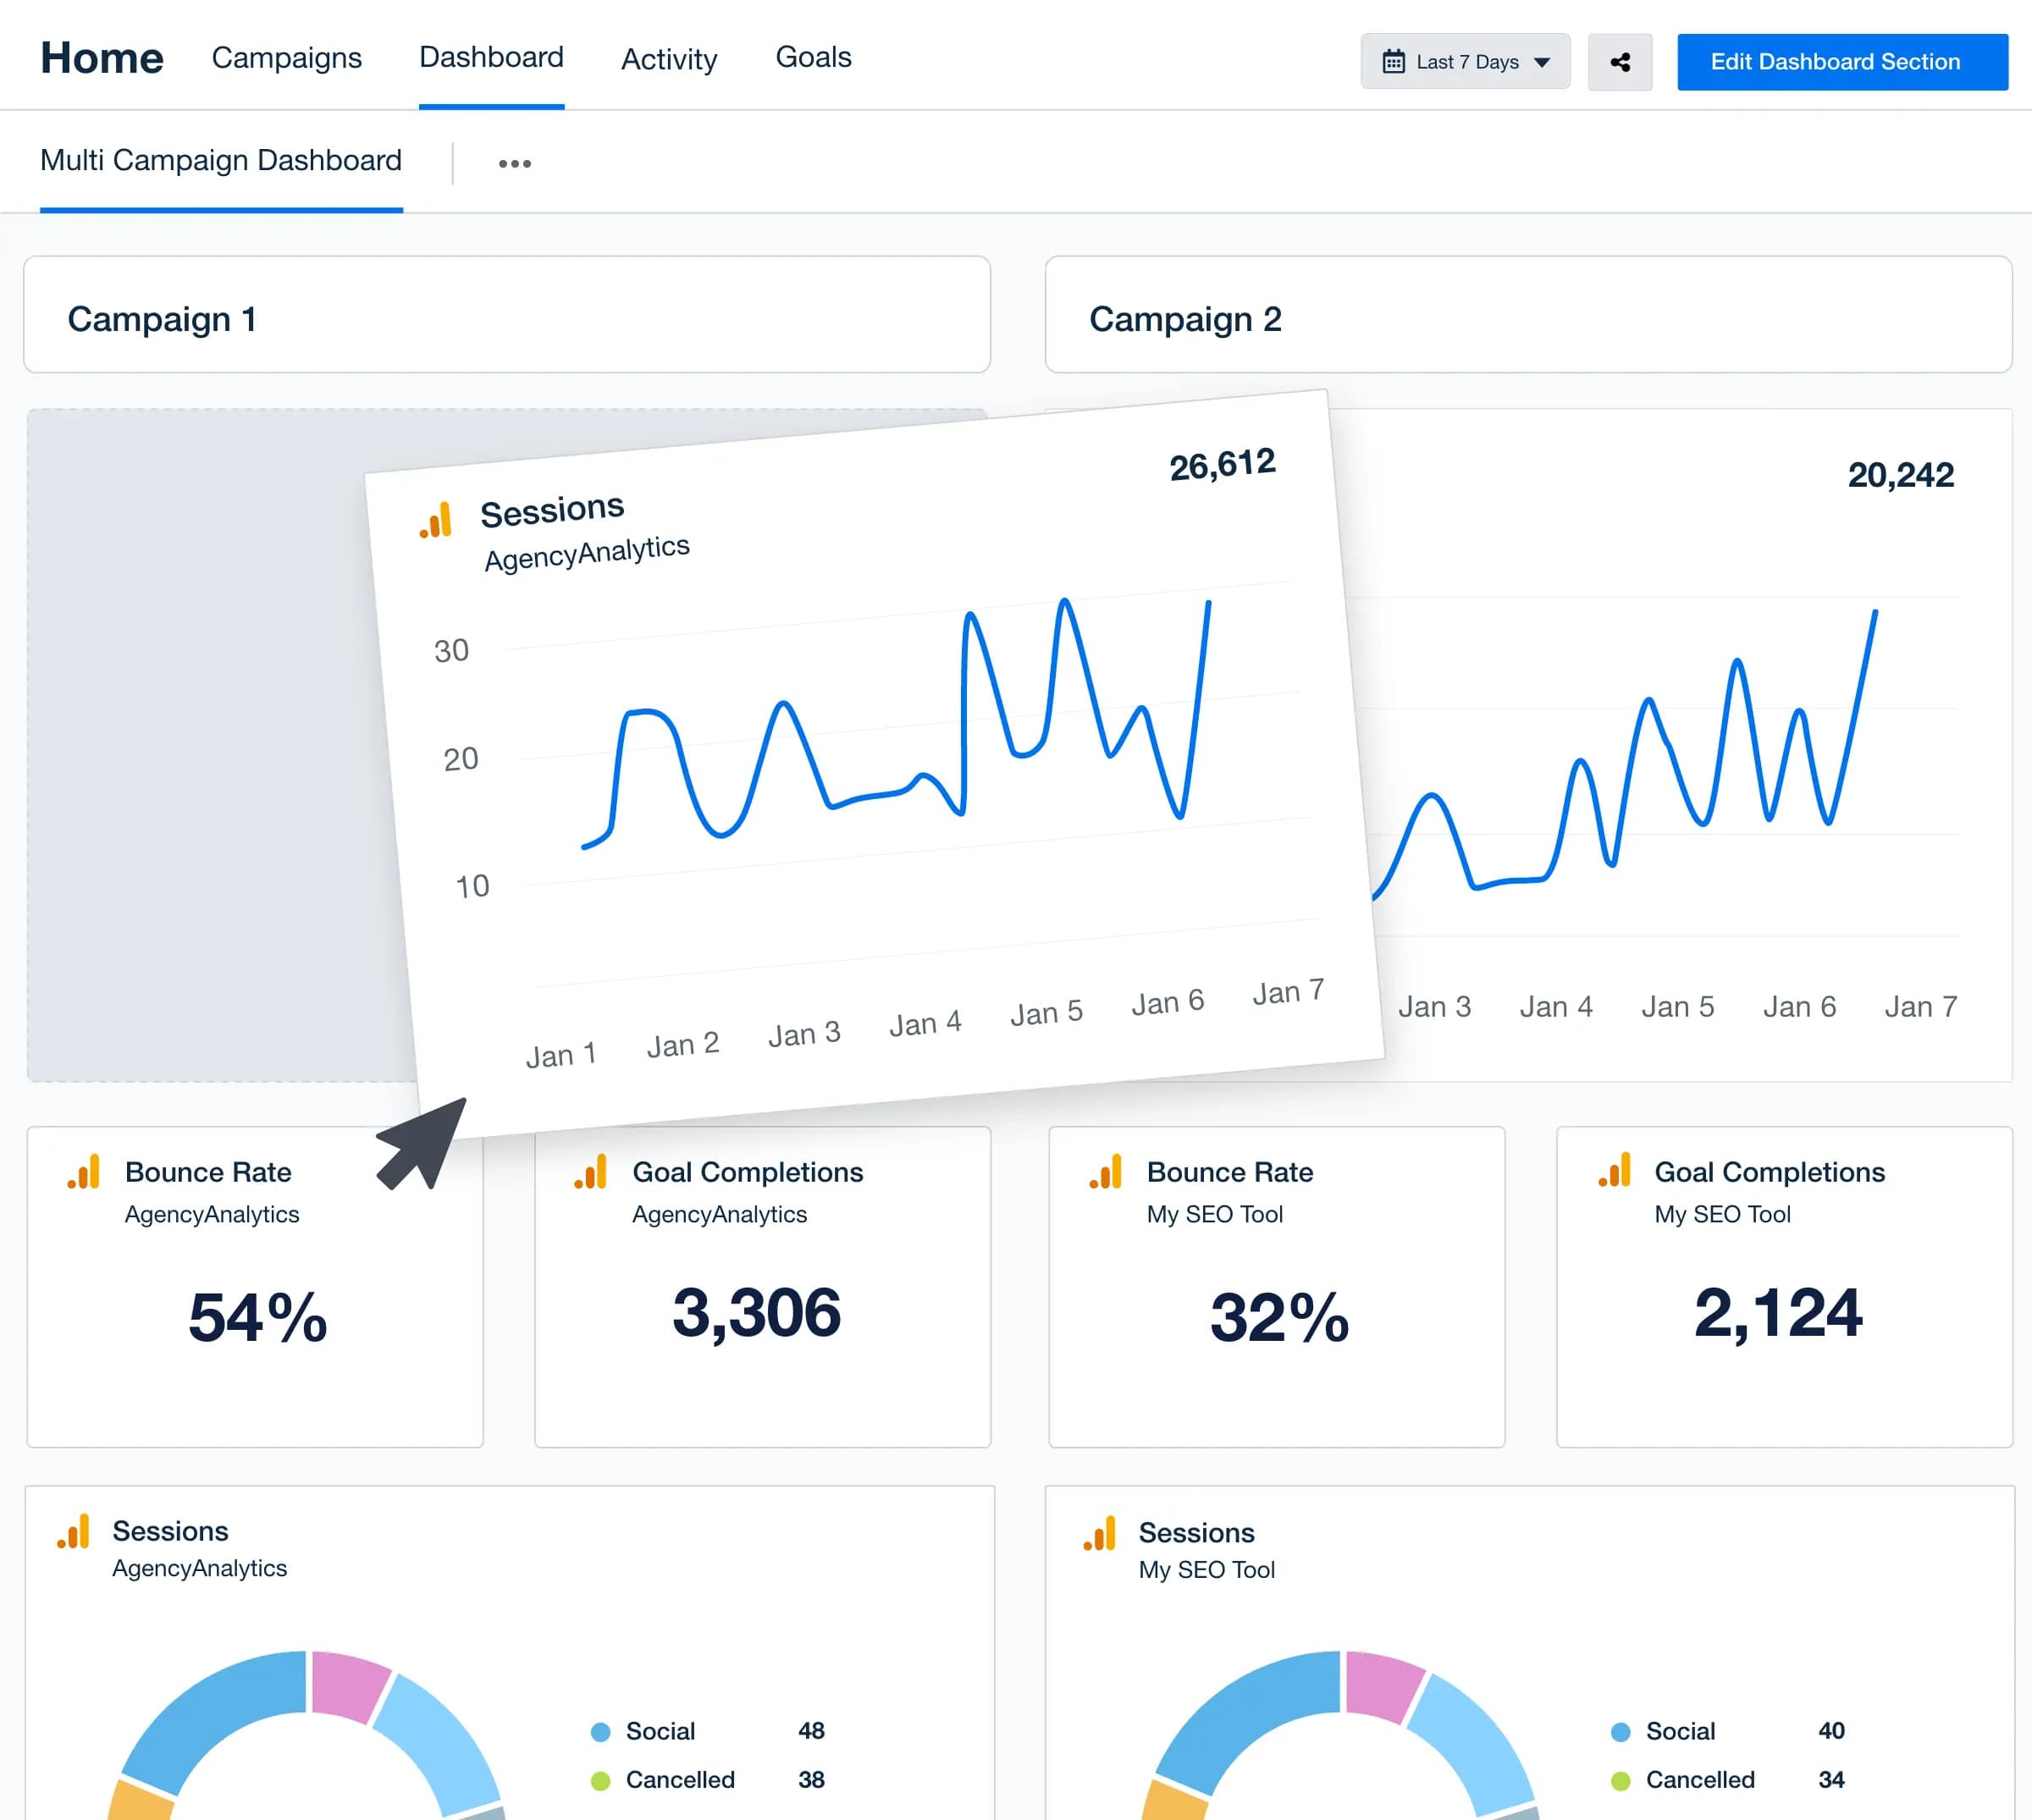
Aside from monitoring the performance of each individual ad campaign, reporting on these results to clients in an efficient way can be a struggle for marketers. To solve this, a PPC reporting dashboard automatically pulls data from various ad platforms such as and into a unified view.

Track your PPC campaigns from a visual dashboard and pull in all your clients’ campaign with the dashboard

The idea is to provide you and your clients with a single place to monitor the performance of all PPC campaigns without having to switch between multiple platforms.

Presenting PPC data in a cohesive and professional way can be a challenge when pulling information from multiple platforms, including Google Ads, Facebook Ads, LinkedIn Ads, and more. Each platform utilizes its own metrics and formatting, making it difficult to present campaign performance in a cohesive way. This mix-and-match of data points often leads to misinterpretations and hinder your agency’s ability to effectively analyze campaign performance across different channels.

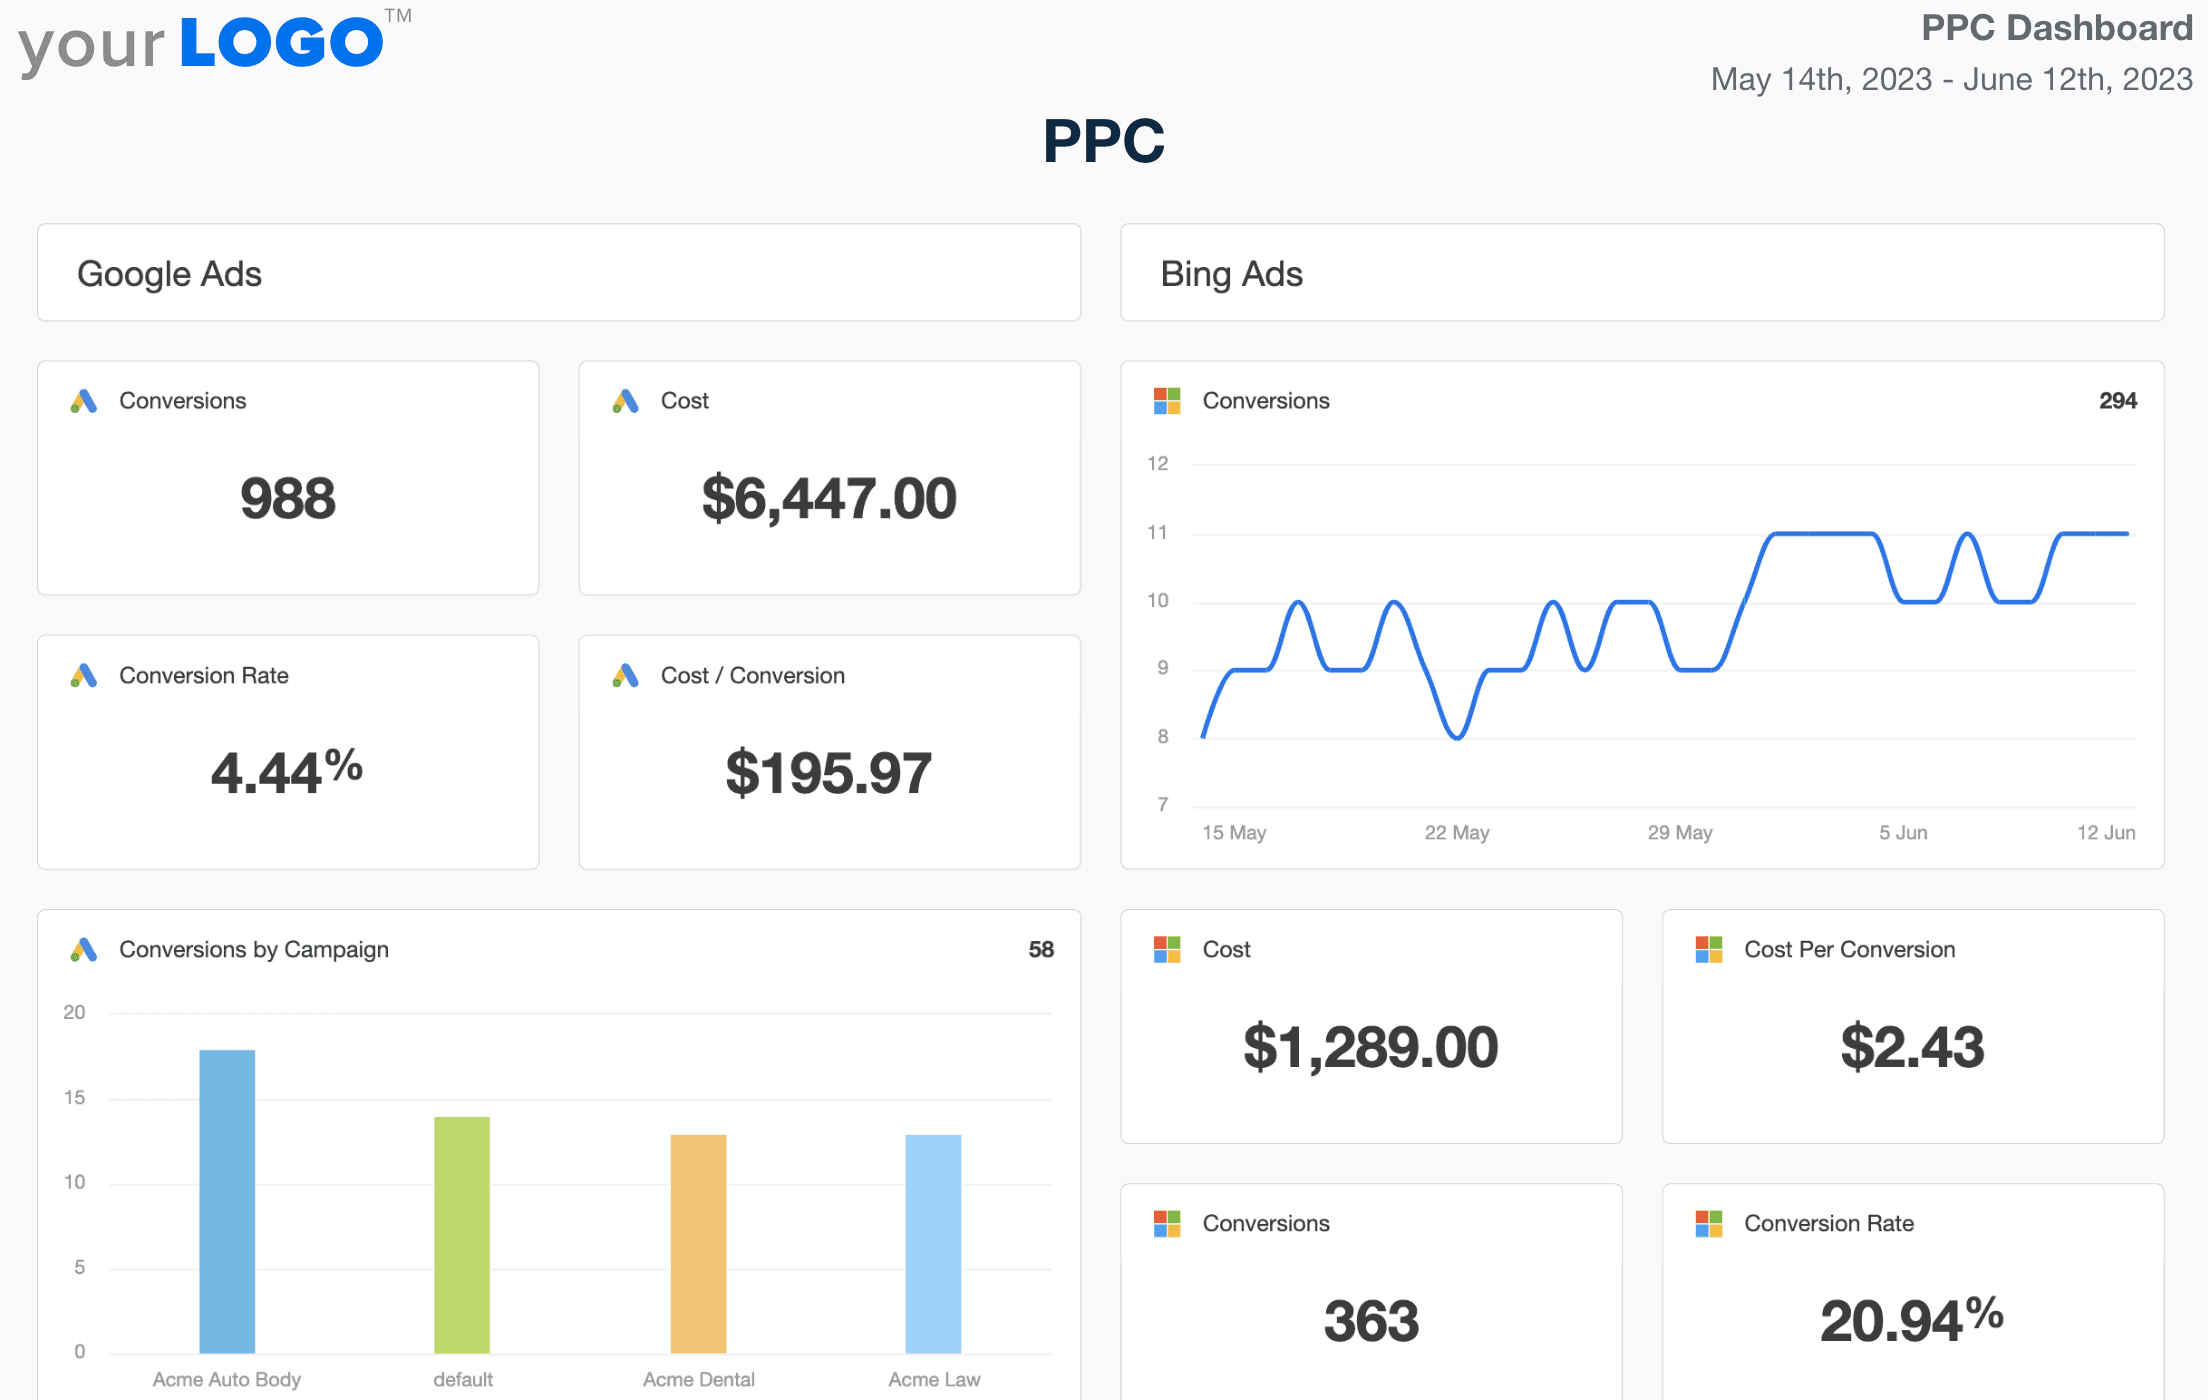
Having a unified PPC dashboard template provides a clear view of your PPC campaigns, making it easier to access valuable insight into your most profitable ads, campaigns, and platforms. For example, you can quickly compare overall ad costs, conversion rates, and return on ad spend (ROAS) for each channel.

In this guide, we’ll discuss exactly how to set up a PPC reporting dashboard template for clients—including how to use annotations and goals to tell a story with your data, how to add a markup for your PPC services, and more.

We’ll be looking at a live PPC reporting dashboard in this article, although keep in mind you can also choose to send a static report on a periodic basis to clients with our PPC report template. As well as specific Facebook Ads Report templates, Google Ads report templates, along with many others to supplement your insights.

Let’s get started.

Step-by-Step: How to Build a PPC Reporting Dashboard

In this section, we’ll look at a step-by-step process of how to set up PPC dashboards using our prebuilt template.

In addition to a single dashboard for multiple ad platforms, we also have digital marketing dashboard templates for each of the over 80 built-in platform integrations, including Facebook Ads dashboard and Google Ads dashboard.

AgencyAnalytics also offers dozens of pre-built marketing dashboard templates that you can use to cover all aspects of your agency’s offerings. Here are just a few of the most popular marketing dashboards:

Save Time on Reports and Gain More Time for Strategy
Automate Client Reporting and Free Up Hours Every Month
Start Your 14-Day Free Trial

1. Create a PPC Campaign Dashboard

In AgencyAnalytics, the first step of setting up a dashboard is always to create a new campaign for your client. In general, one campaign equals one client or URL, which is then used to monitor social media accounts, track PPC ads, and more.

Start by Creating a PPC Campaign Reporting Dashboard

2. Choose Your PPC Integrations (and Google Analytics)

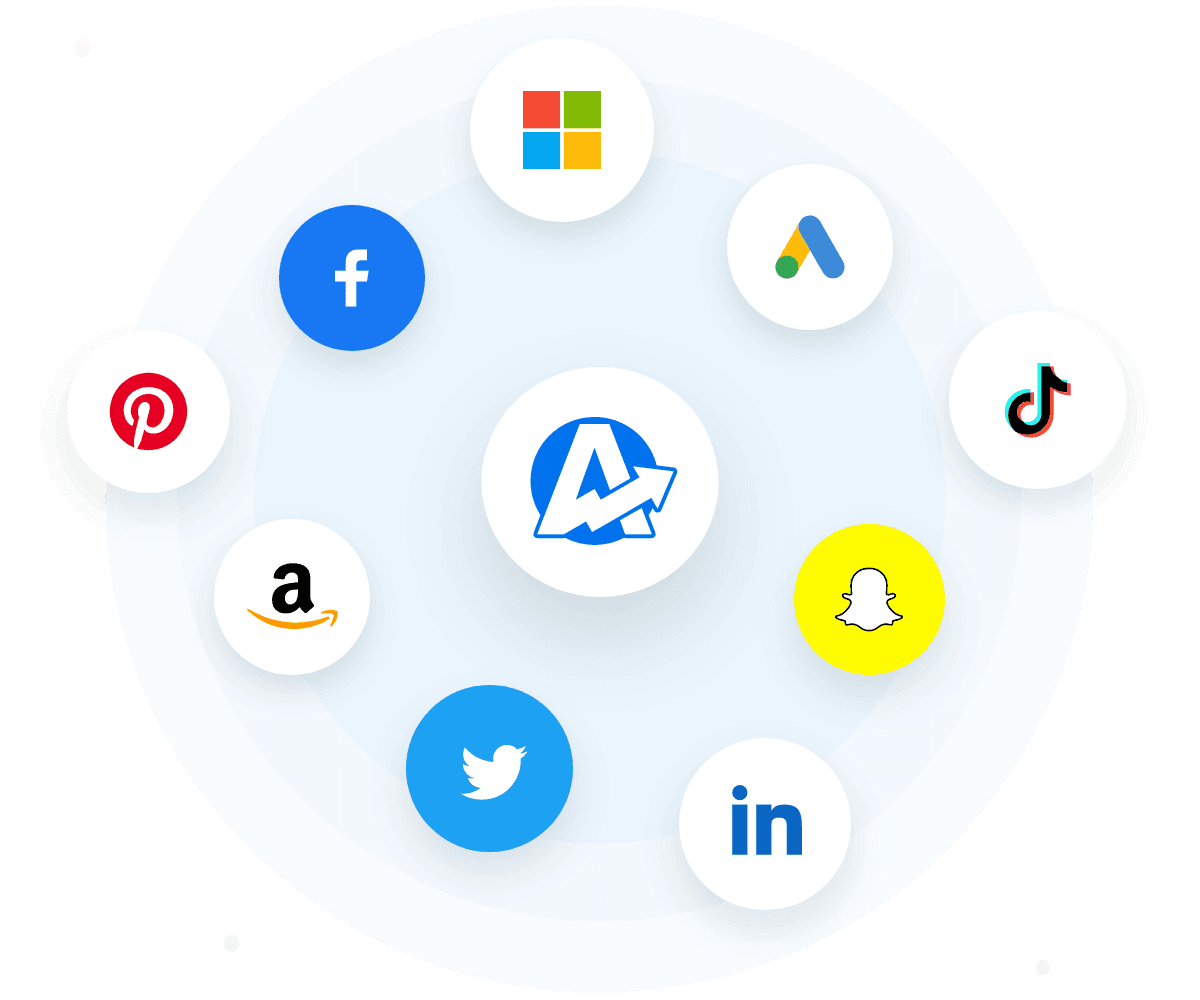
After you’ve created a campaign for your client, the next step is to connect their PPC integrations. An integration will then automatically pull all the relevant data from the platform. Aside from the advertising integrations shown below, we currently have 80 integrations to choose from.

PPC Reporting Dashboard Integrations

Don't forget to connect the Google Analytics reporting integration to easily track what happens AFTER the PPC click!

3. Add a New Dashboard

After connecting your client's integrations, the next step is to create a new dashboard dedicated to PPC. As you can see below, you can create a new dashboard from within the campaign in the “Dashboard” section.

Add a New Dashboard to a Client Campaign

4. Choose Between a PPC Template or Create a Custom Dashboard

The next step is to choose between starting with a template, cloning an existing PPC dashboard, or starting from scratch and creating a custom dashboard. For this example, we’ll start with our PPC template.

PPC Dashboard Builder Workflow

From there, you can choose which dashboard template you’d like to use—you can find a full list of our dashboard templates that cover the full spectrum of digital marketing.

6. Customize Widgets in the Dashboard

Even if you’re using our PPC template, you can easily customize the dashboard widgets to showcase specific PPC marketing data by clicking on “Edit Dashboard”, which allows you to delete, rearrange, resize, or customize the widget titles:

How to Edit Your Client's PPC Dashboard

7. Add Annotations & Goals

Now that the dashboard is created and customized, let’s review a few more advanced features such as adding annotations and goals to your PPC charts. Annotations allow you to show when significant changes were made to the account such as new campaign launches or budget changes, whereas goals allow you to indicate account targets, such as a target CPA.

Facebook Ads Annotations Example

In order to add annotations to a widget, simply click on the ellipsis "..." in the upper right-hand corner of the widget and click “Edit”:

8. Add a PPC Markup for Your Services

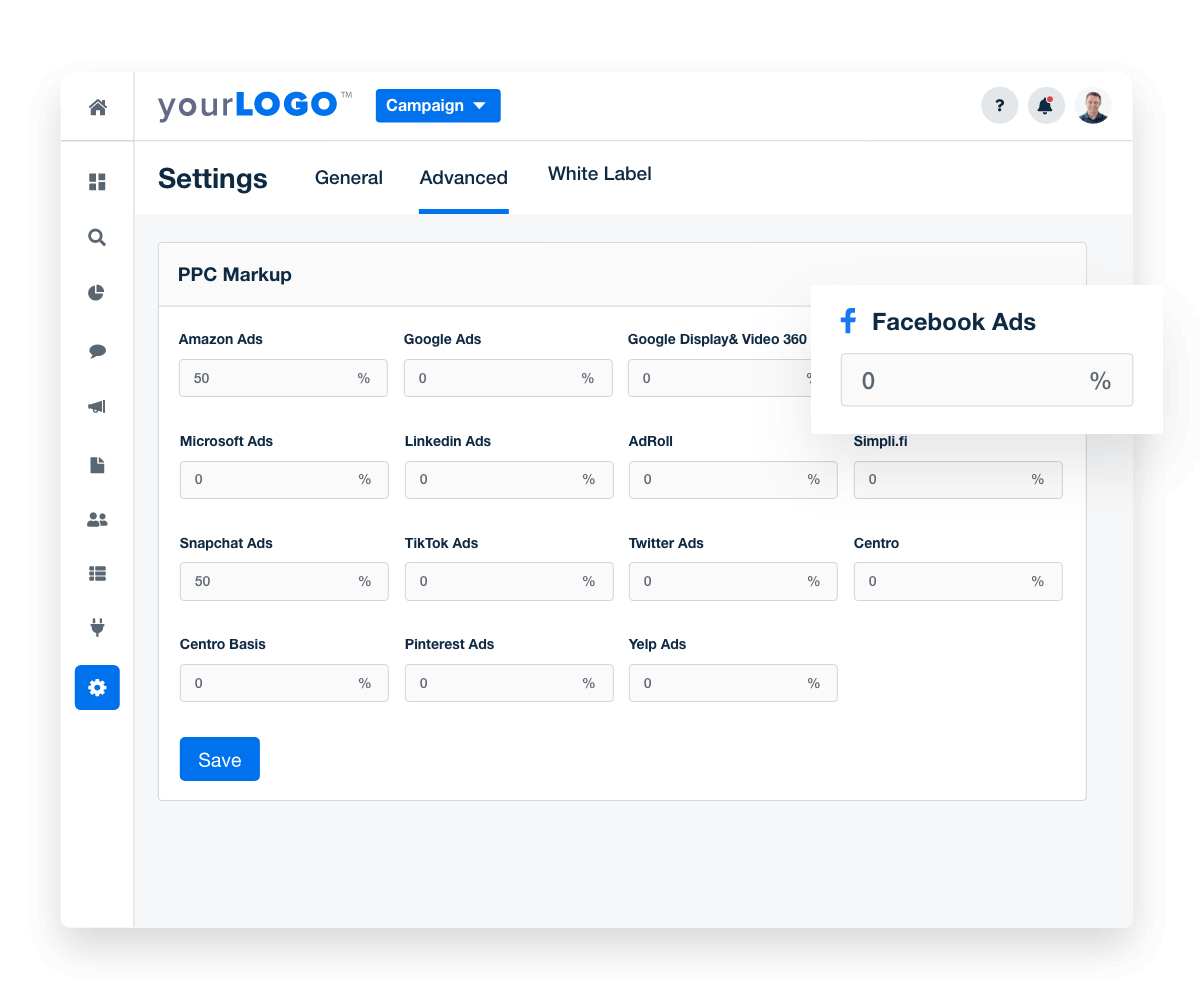
If you’re charging clients a percentage of total spend, you may only want to display ad costs to clients after the markup for your services to avoid questions and misunderstanding. In order to add a markup to your dashboard, you can simply go to Settings -> Advanced and add the percentage for each individual platform that you’re managing.

A screenshot of PPC markup tools

9. White Label the PPC Reporting Dashboard

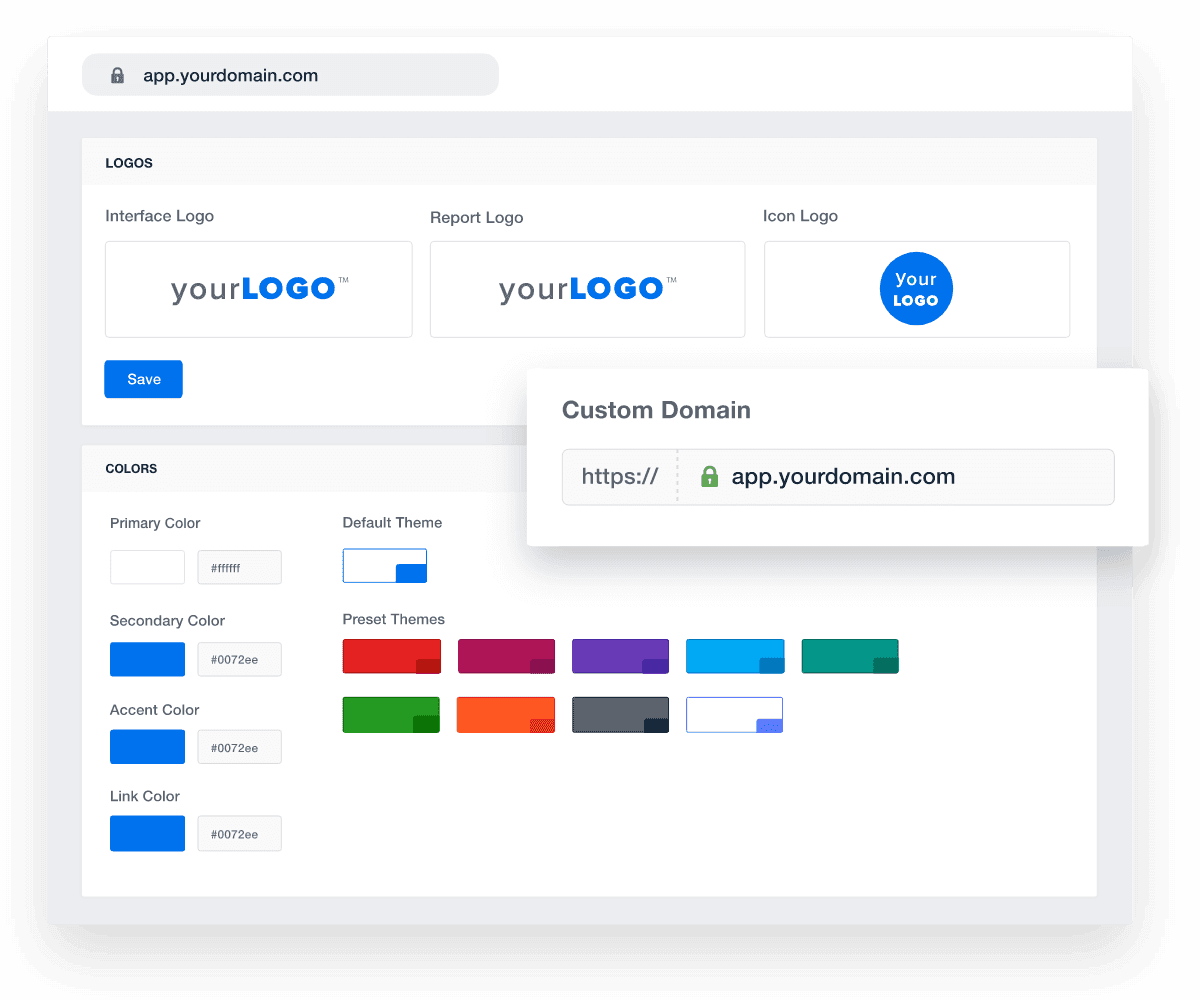
The final step before sharing a dashboard with clients is to white label it with your agency’s branding. This includes uploading your logo, adding your color scheme, and hosting it on your own domain.

Add Your Own Branding To Your Customizable SEO Reporting Software

10. Share the Dashboard with Clients

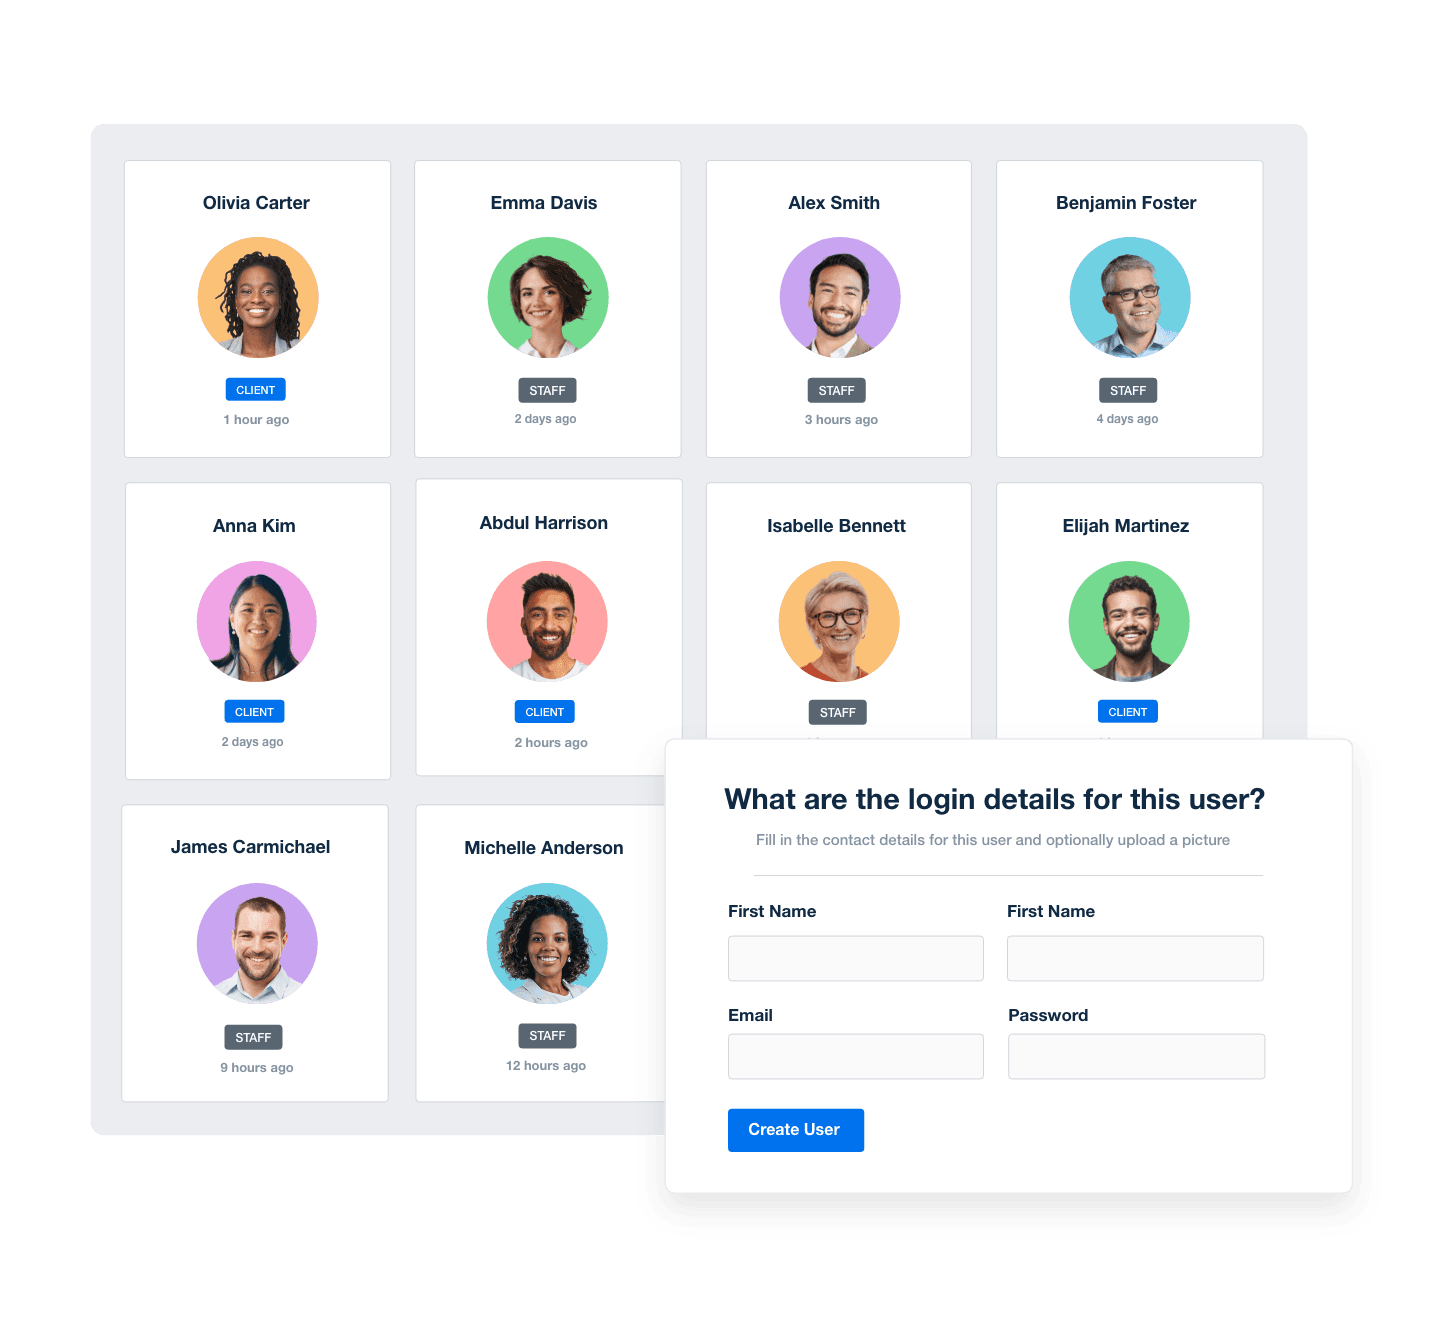
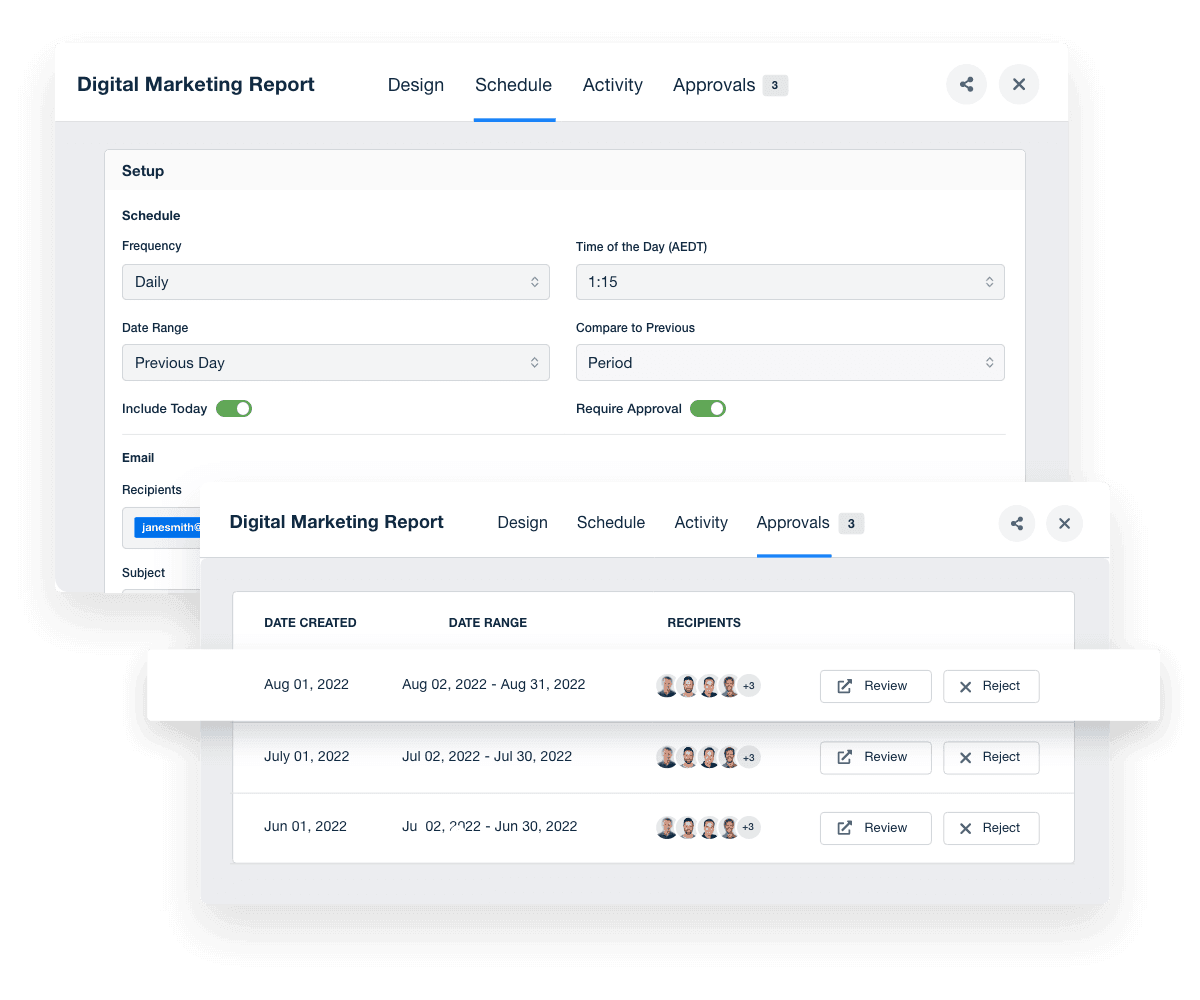
Finally, there are several options to share the dashboard with clients. First, you can choose to add the client as a user and assign them permissions about what they can see. You can also choose to download a PDF PPC report, create a shareable link, or send it by email directly in the dashboard:

How to Turn Your PPC Dashboard Into a PDF Report
Build Custom Marketing Dashboards in Minutes
Save Time, Impress Clients, and Deliver Results
Find Out What Custom Dashboards Can Do

9 PPC Metrics to Track Performance

Now that we’ve reviewed how to set up and customize a dashboard, let’s look at a few key metrics you should include in PPC reports and how they relate to the overall campaign performance of your PPC spend.

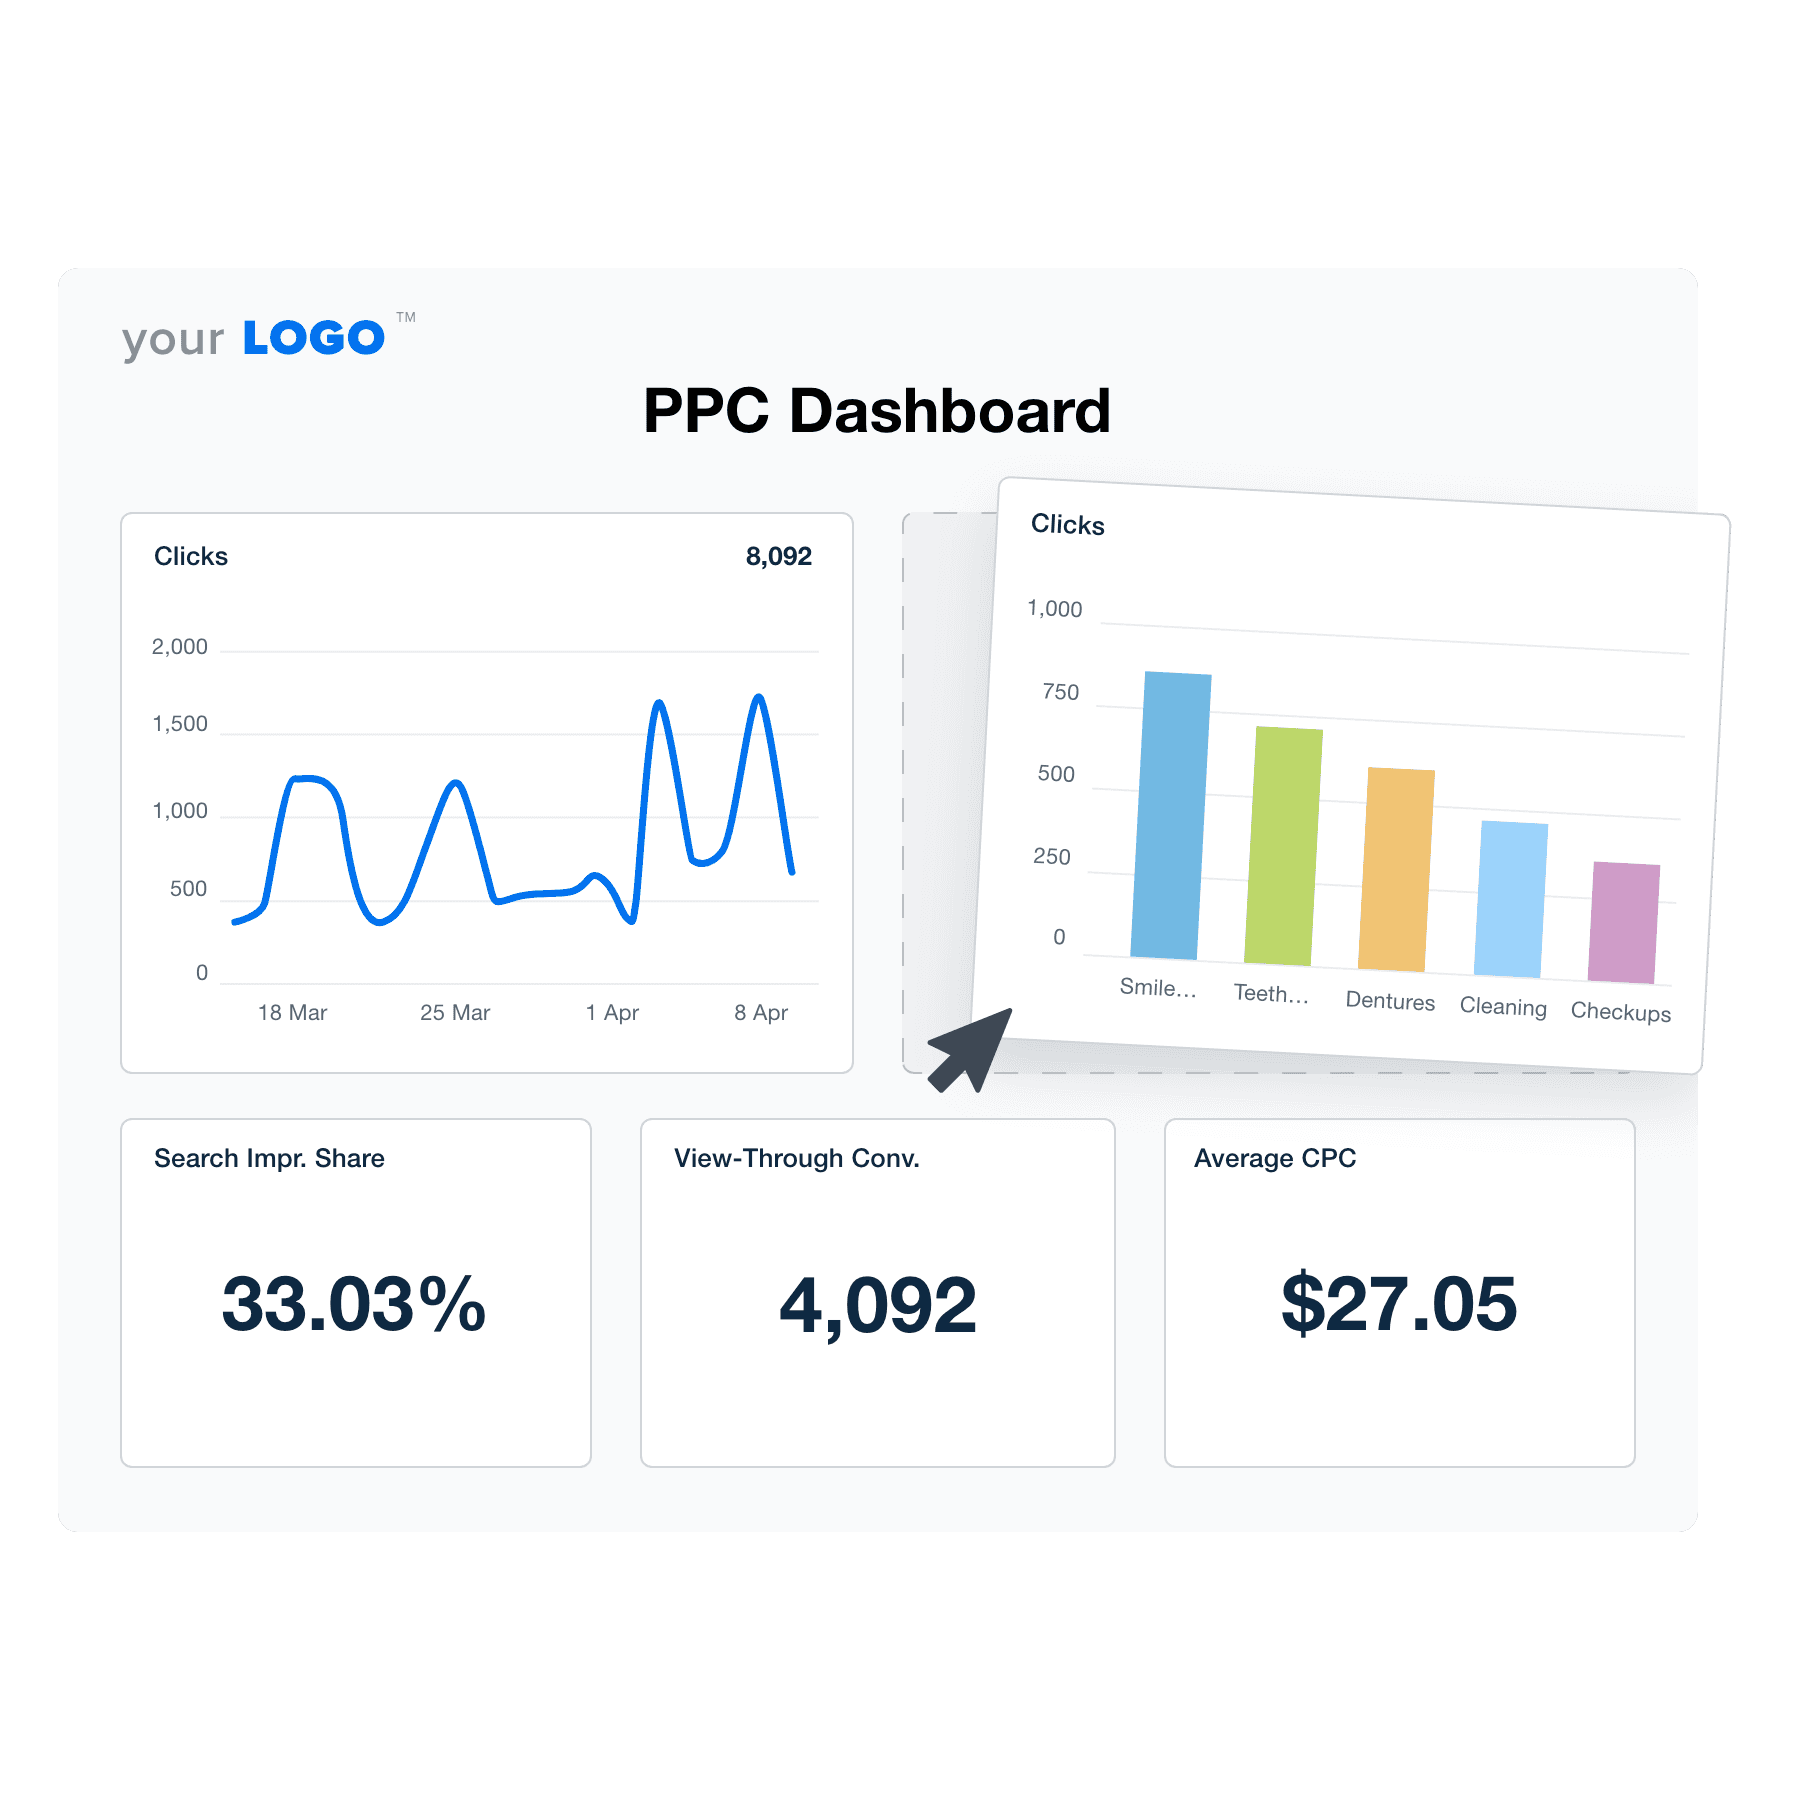
PPC Dashboard Template Example

Impressions

Impressions refer to the total number of times your ads have been viewed, either in search results or the display network. If your goal is to increase brand awareness, impressions can be an important metric to measure success. 

Clicks

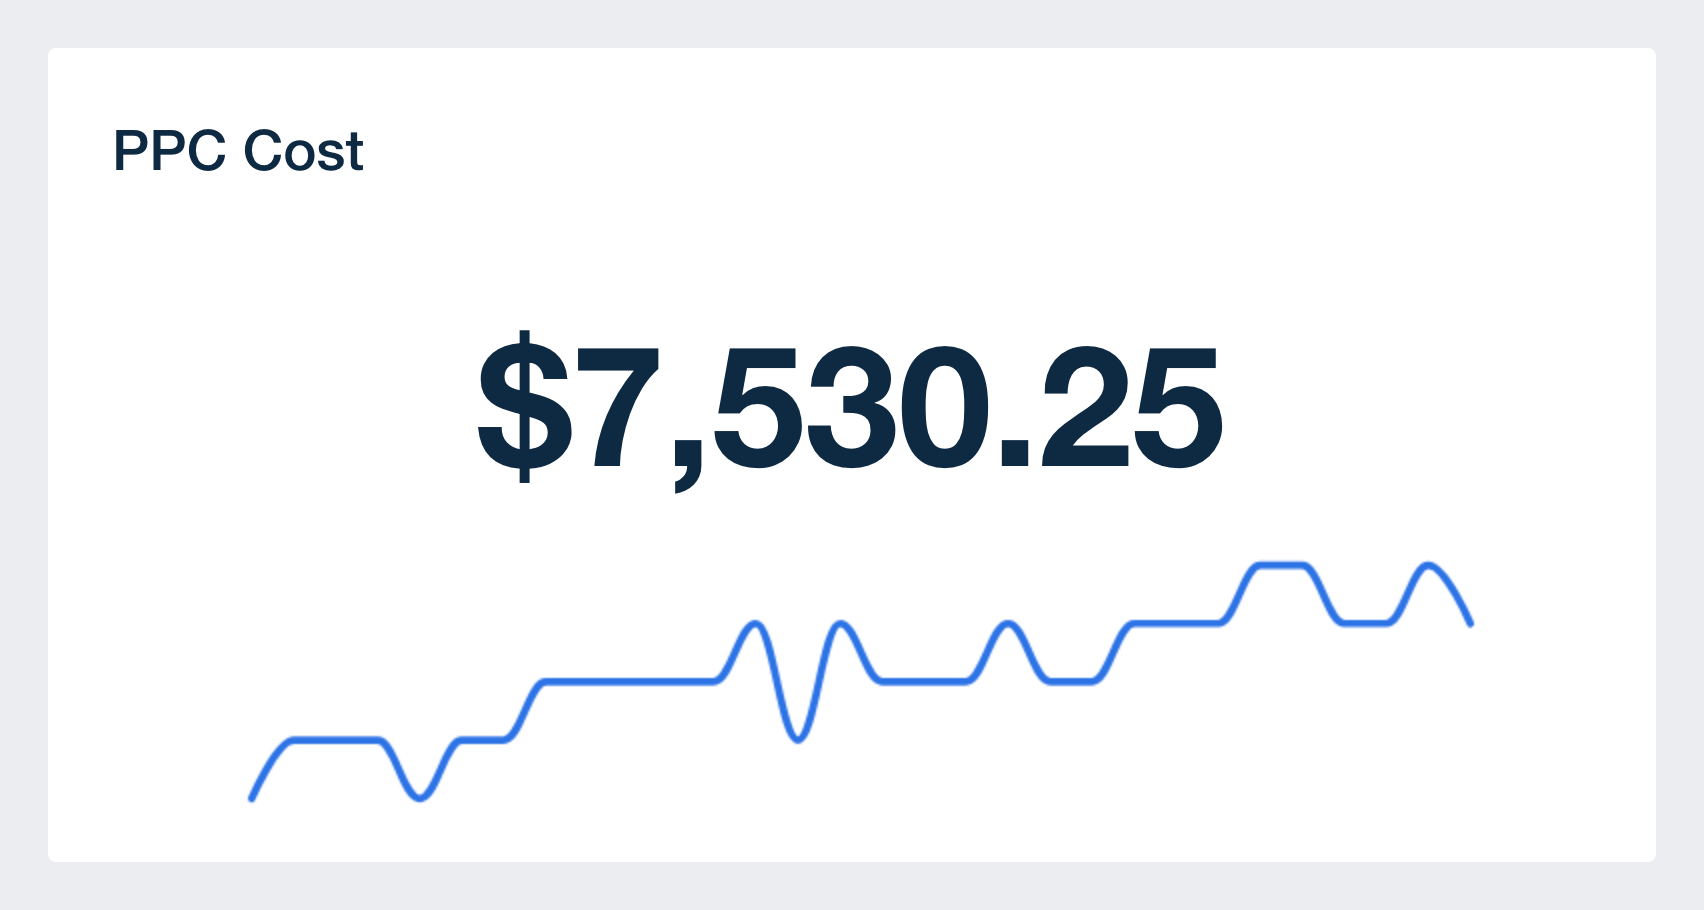
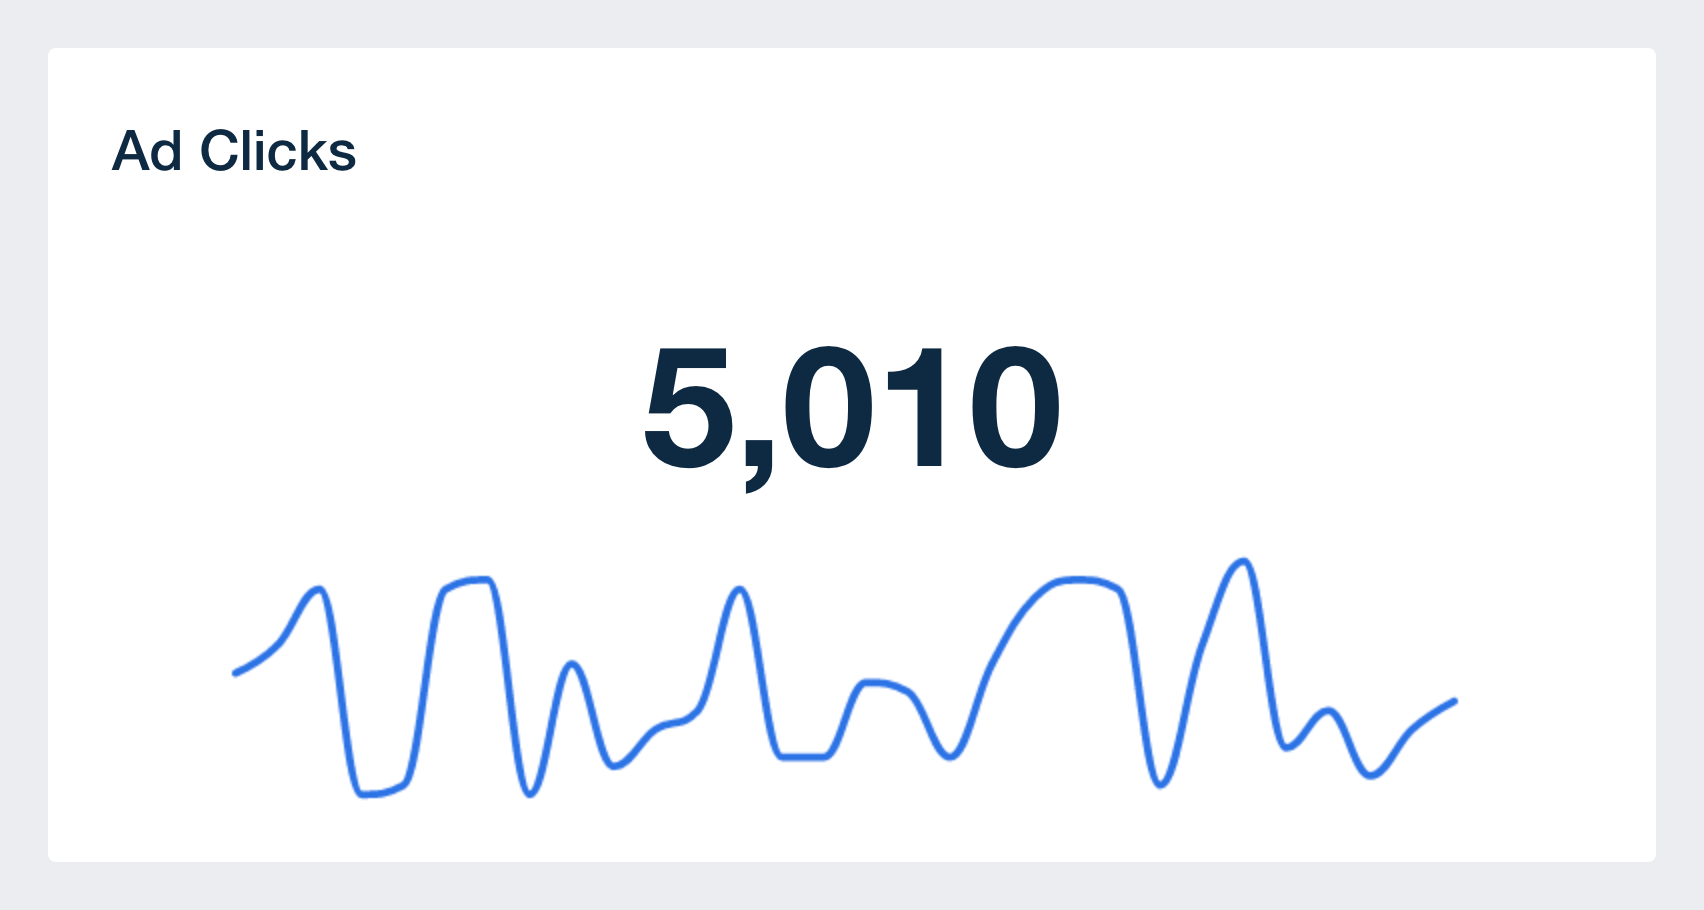
Monitoring clicks are particularly important to track at the launch of a new ad campaign, as you often want to let ads run for a minimum number of clicks before determining if the campaign is worth keeping or pausing.

CPC (Cost Per Click)

Even though you typically want to let a PPC campaign run until its reached a certain number of clicks to monitor its performance, CPC can provide an early indication that a campaign needs to be paused or optimized it’s abnormally high. Keep in mind, however, that a high CPC may not always be a cause for concern as the lead quality may also be higher, and ultimately still provide a profitable ROAS.

Click-Through Rate (CTR)

Tracking impressions tells you how many views you’re getting at the top-of-funnel, although you also want to know how well your ads are converting people from the awareness stage to consideration. Monitoring CTR does just that by providing an indication of how effective your ad copy and ad creative are at converting views into clicks, and ultimately conversions.

Reach and Frequency

Reach and frequency are two more PPC metrics that are often ignored by advertisers, although they provide crucial information about when it may be time to pause an ad. In contrast to impressions which tracks every ad view, reach tracks the number of actual people that have viewed the ad, regardless of how many times they see it. 

Frequency, on the other hand, refers to the number of times each user has seen an ad and is calculated as impressions divided by reach. Monitoring your frequency is extremely valuable as a high frequency means that the same person is seeing the ad over and over again without converting. Ultimately, a high frequency means that it may be time to change up your ad copy, creative, or targeting.

Facebook PPC Ads Dashboard Example

Conversions

Aside from tracking conversions at the account-wide level, conversions should also be monitored based at the ad set and individual ad level. If you’re using Google Ads integration and reporting, for example, you can break down Google Ads conversions by account, campaign, and the top keywords driving those conversions.

PPC Dashboard Template Example

 Conversion Rate

Conversion rate is another important comparative KPI that tells you how effective your ads are at driving the desired action. Conversion rate can also be broken down more granularly at the ad set level, which provides an indication of targeting quality, and at the individual ad level, which provides useful information about the quality of ad copy and creative.

Return on Ad Spend (ROAS)

Finally, if we had to specify a single most important PPC metric to track it would be return on ad spend. ROAS is defined as the amount of revenue generated from each dollar invested into paid ads and allows you to compare the profitability of each ad campaign.

Facebook Ads Reporting Widget Examples

Clearly communicate your agency’s success in driving revenue and ROI with a customizable Campaign Performance Report Template. Try AgencyAnalytics free for 14 days!

Summary: Tracking Your PPC Performance

Given the wealth of data and insights hidden in each advertising platform, having a dedicated PPC reporting dashboard goes a long way in terms of staying on top of your client's data.

Whether you're looking for a dedicated Google Ads dashboard, or a reporting tool that covers the full spectrum of PPC ad campaigns, AgencyAnalytics has you covered!

Being able to access and monitor data from multiple ad platforms in custom dashboards makes it easier to determine which strategies are working for the client cross-platform.

Google Ads Performance SEM Dashboard Data Example

If you're managing ads on multiple platforms, PPC reporting dashboards enable agencies to not only save time in their reporting cycle, but also to provide clients with real-time access to their data on their own schedule. If you're ready to get started with a PPC dashboard, and start tracking and reporting on your data in minutes.

Receive Agency Growth Tips, Delivered to Your Inbox

Peter Foy Headshot

Written by

Peter Foy

Peter Foy is a content marketer with a focus on SaaS companies. Based in Toronto, when he’s not writing he’s usually studying data science and machine learning.

Read more posts by Peter Foy ›

Get Started for Free

Try AgencyAnalytics risk-free for 14 days. No credit card required.
AgencyAnalytics Dashboard Preview