Table of Contents
Table of Contents
- What Is Bounce Rate in Google Analytics?
- Average GA4 Bounce Rate for 2025
- Why Was Bounce Rate Removed and Then Brought Back in GA4?
- Pros and Cons of Tracking Bounce Rate
- Engagement Rate vs. Bounce Rate: How Do They Compare?
- How to Track Bounce Rate in GA4
- Using Bounce Rate and Engagement Rate in Your Client Reporting
7,000+ agencies have ditched manual reports. You can too.
Free 14-Day TrialQUICK SUMMARY:
Google Analytics 4 introduces a re-imagined concept of bounce rate — now reflecting how long users engage, the actions they take, and how many pages or screens they view, rather than simply 'did they click another page or not'. This shift offers deeper insights into user engagement, crucial for refining digital strategies.
At its core, GA4 tracks engaged sessions (sessions lasting at least 10 seconds, or with 2+ page/screen views, or a conversion event). The bounce rate is simply the percentage of sessions not meeting those criteria. This shift gives agencies deeper insight into how users truly interact, helping refine digital strategies with better context.
To calculate bounce rate in GA4, divide the number of non-engaged sessions by the total number of sessions and multiply by 100 to get a percentage.
Initially, GA4 reports didn’t even include bounce rate, but after a lot of backlash, Google eventually relented and brought it back. However, the bounce rate we ended up with in GA4 is quite different from the bounce rate you’re used to in UA.
In this article, we’ll go over how to find the bounce rate in Google Analytics 4, how the bounce rate has changed, and which new metrics you need to know in order to properly track the bounce rate in GA4.
What Is Bounce Rate in Google Analytics?
The definition of bounce rate depends on which version of Google Analytics you’re used to. So let’s quickly compare how Google defined bounce rate in the now-defunct Universal Analytics vs. Google Analytics 4.
Bounce Rate in Universal Analytics
If you were using Universal Analytics (sometimes referred to as Google Analytics 3 or GA3), this is how Google defined the bounce rate:
Bounce rate is single-page sessions divided by all sessions or the percentage of all sessions on your site in which users viewed only a single page and triggered only a single request to the Analytics server.
In other words, if someone visits your client’s website and only looks at a single page before leaving, that is considered a “bounce” in UA.
Bounce Rate Definition in Google Analytics 4
Meanwhile, the bounce rate in GA4 is slightly different. Here’s how Google defines it: Bounce rate is the percentage of sessions that were not engaged sessions. If you’re wondering what an “engaged session” is, here’s the definition in Google’s own words: An engaged session is a session that lasts 10 seconds or longer, has 1 or more conversion events, or has 2 or more page or screen views.
Now, let’s put all of that together:
Google defines bounce rate in GA4 as the percentage of sessions that:
Were less than 10 seconds long,
Had zero conversion events, or
Had less than 2 page or screen views.
If the session meets ALL of those three criteria, then it’s considered a bounce. The bounce rate in GA4 is calculated by dividing the number of non-engaged sessions by the total number of sessions and then multiplying by 100 to get a percentage.
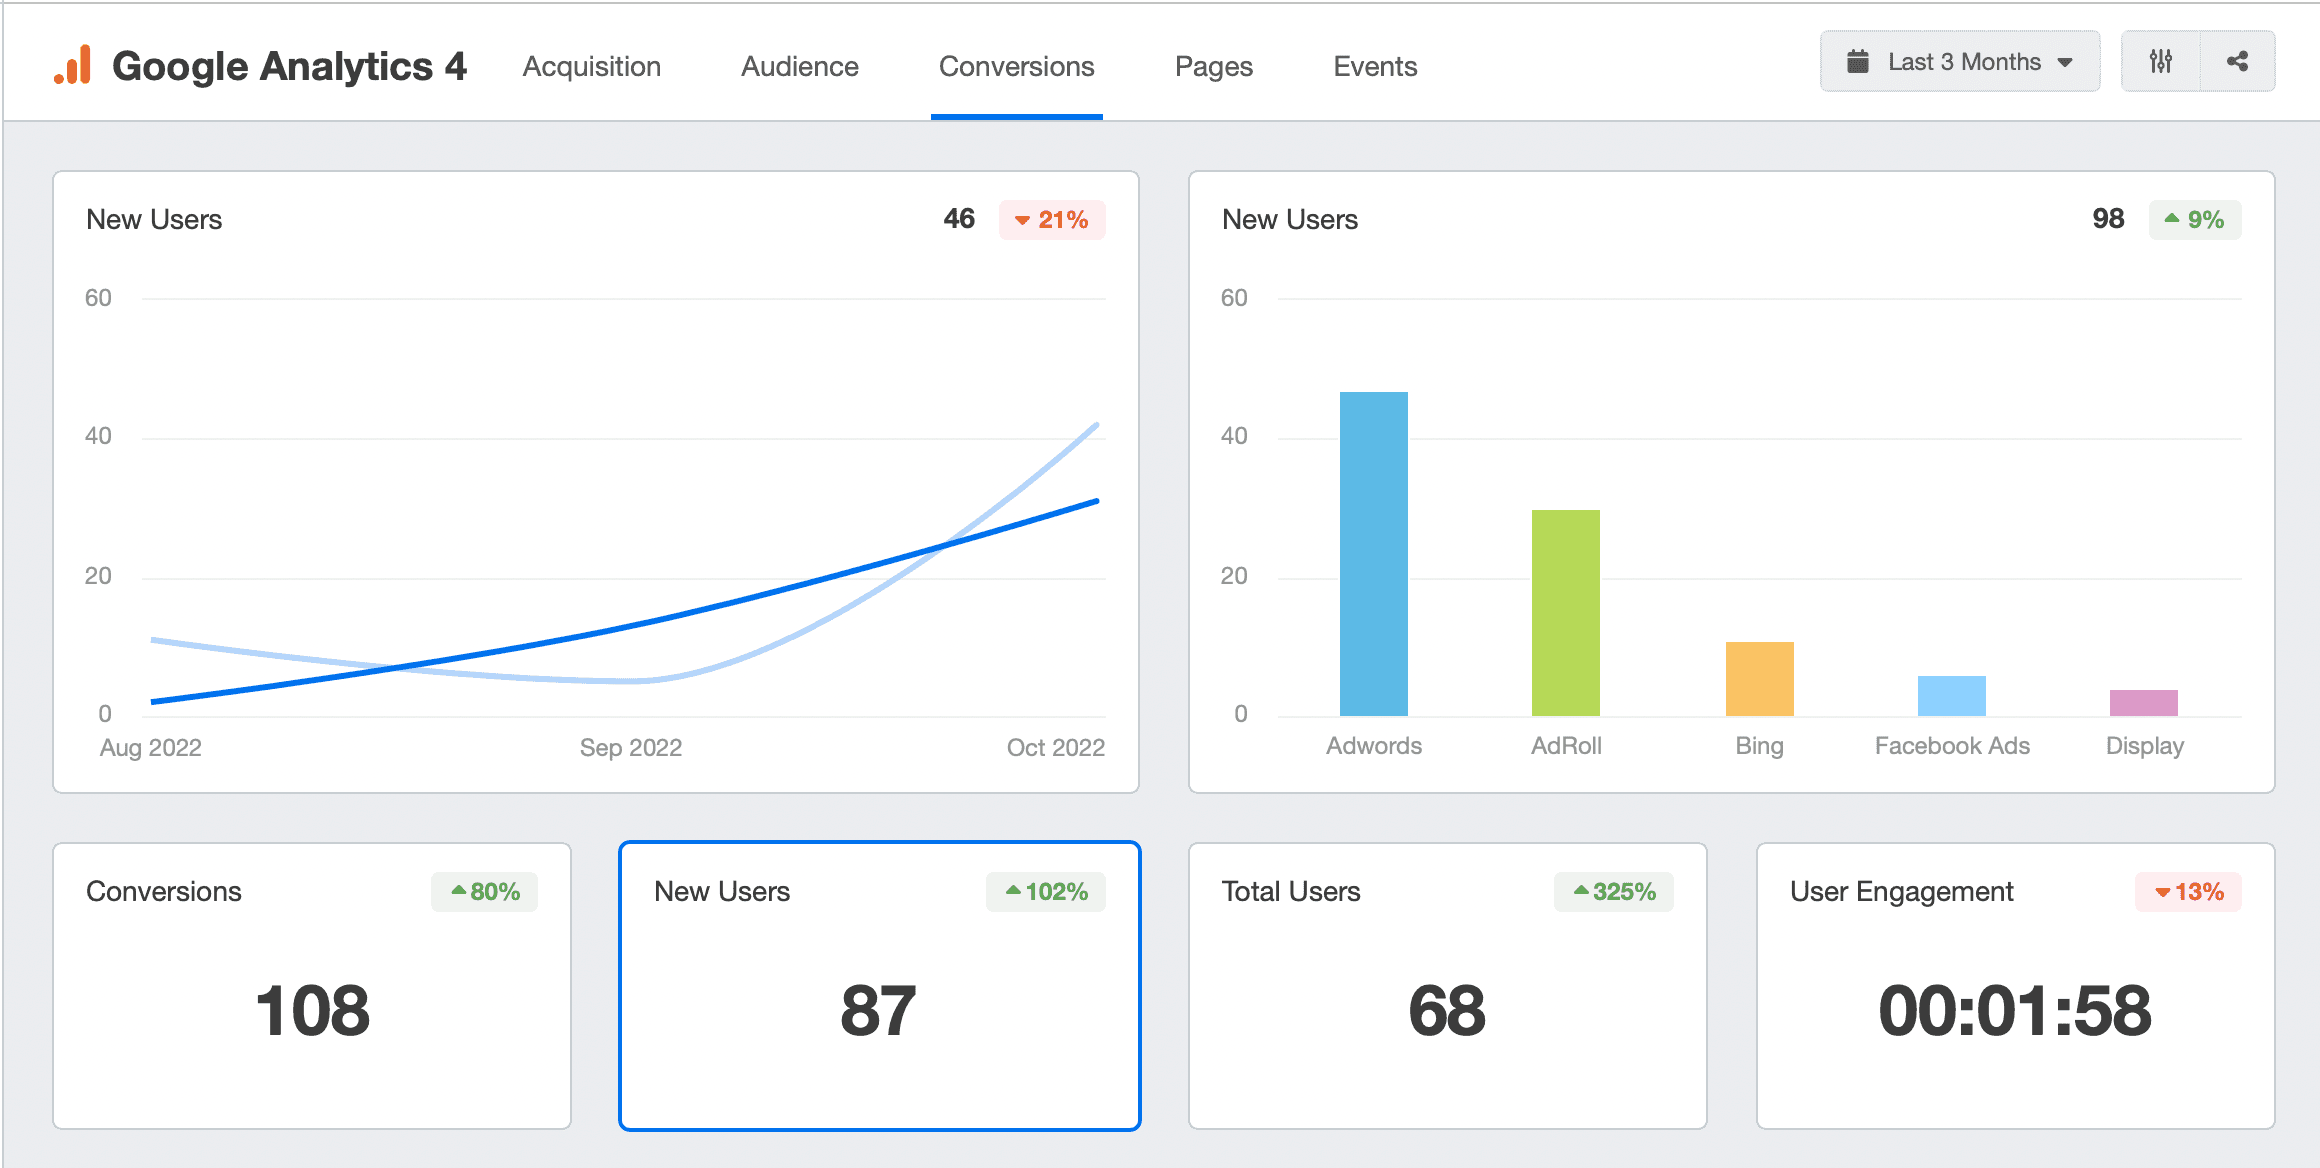
A Google Analytics 4 dashboard in AgencyAnalytics automatically visualizes each of your clients' KPIs. Try it free for 14 days!
Comparing Bounce Rate in UA vs. GA4 – What’s Changed?
To recap, the bounce rate in Universal Analytics was focused on single-page sessions, while in GA4, it’s all about engaged sessions.
Bounce Rate in Universal Analytics | Bounce Rate in Google Analytics 4 |
|---|---|
Single-page sessions divided by all sessions, or the % of all sessions on your site in which users viewed only a single page and triggered only a single request to the Analytics server. | The percentage of sessions that were less than 10 seconds long/had 0 conversion events/had less than 2 page or screen views. |
This also means that the bounce rate in GA4 is closely tied to engagement, to the point where the bounce rate is actually the inverse of the engagement rate.
You might have noticed that the definition of bounce rate in Universal Analytics is a lot simpler than its definition in Google Analytics 4. When the UA definition counted single-page sessions as a bounce, it was a reflection of the times, but a lot has changed since Universal Analytics premiered back in 2012.
The new definition of bounce rate in GA4 updates this metric for a more complex age of infinite scrolling on landing pages and single-page applications while also allowing marketers to better capture how users truly interact and engage with your client’s websites. The changes in calculating bounce rates in GA4 focus on engagement sessions and the need to customize engagement definitions for different types of websites.
What To Tell Your Clients
Although the bounce rate metric will remain, the data points have changed.
Your clients may have noticed a significant shift in the bounce rate numbers in their client reports in GA4 vs the outdated UA data, so it’s important that they understand that this difference is based on how that metric is being tracked and not based on a change in user behavior.
AgencyAnalytics, for instance, automates your data-retrieval process by putting your clients’ real-time metrics into intuitive dashboards like this one.
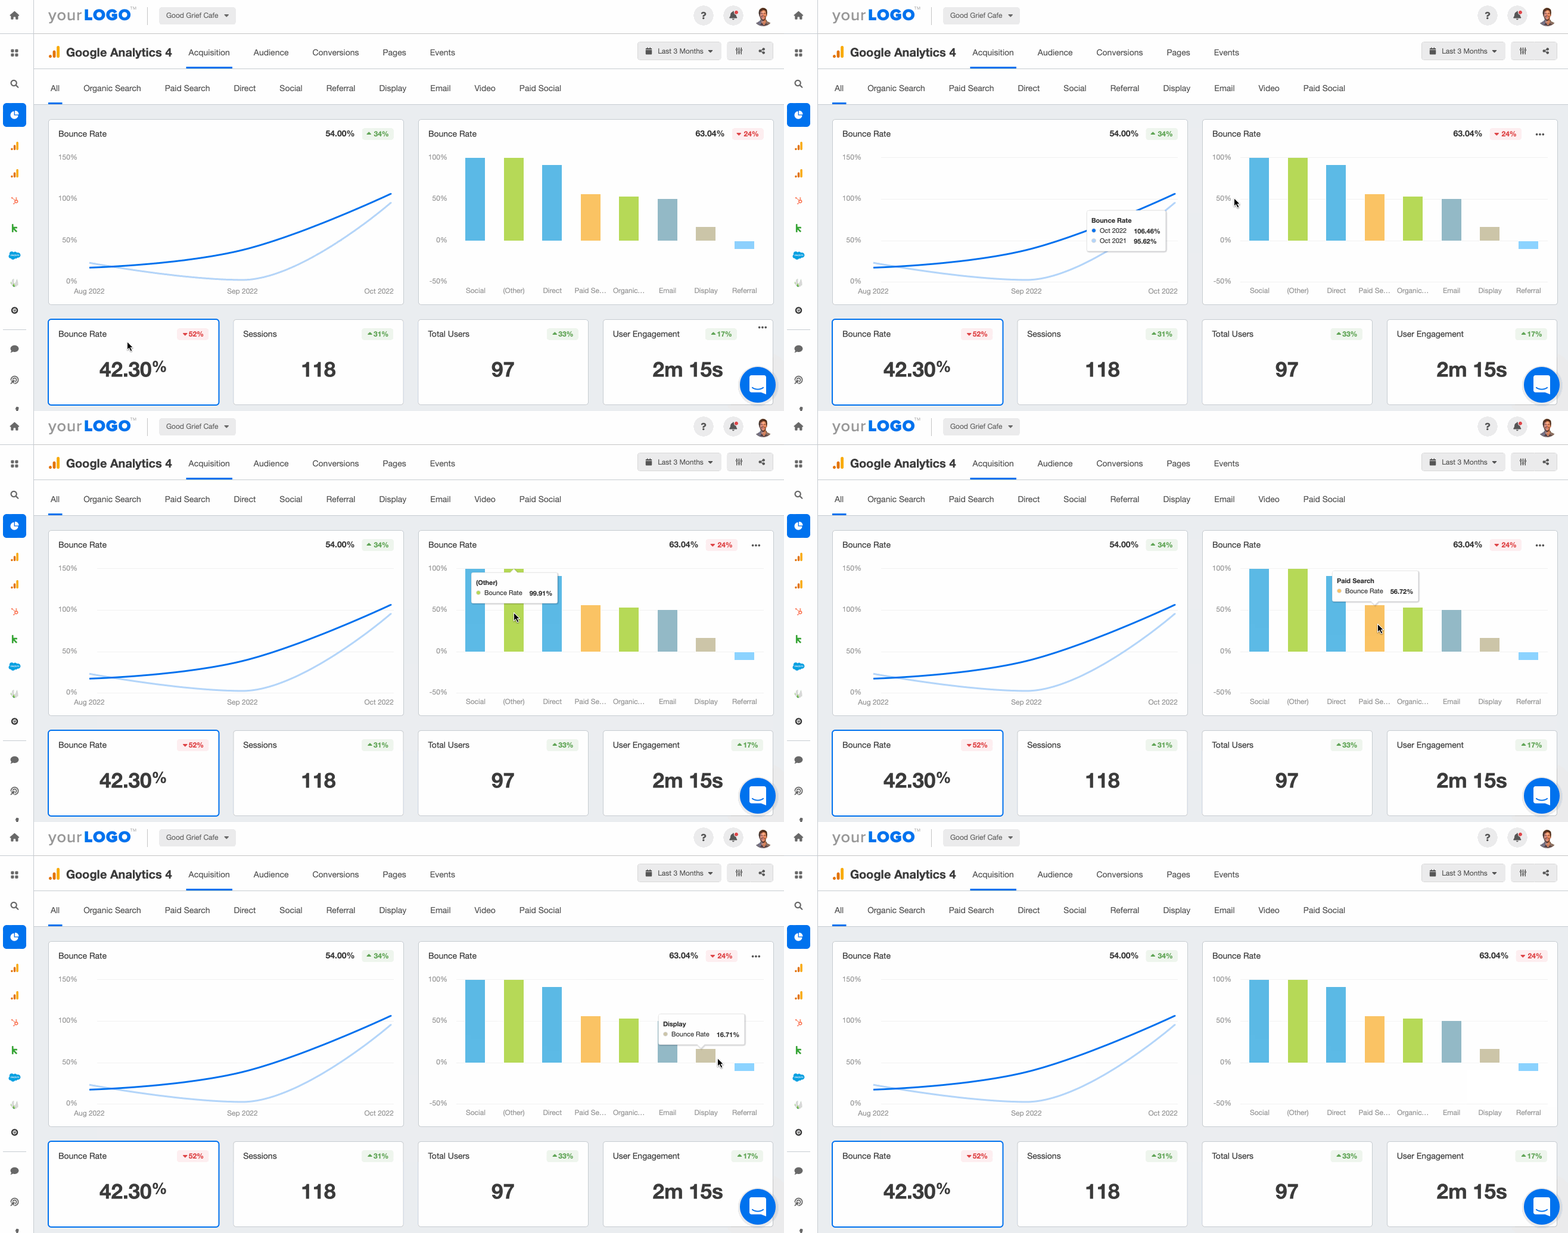
Track all your clients’ key metrics using a GA4 dashboard. Try it free for 14 days!
Average GA4 Bounce Rate for 2025
Understanding bounce rates across industries provides valuable insights into user behavior and landing page performance.
Based on proprietary data from over 150,000 marketing campaigns tracked by our agency-reporting platform, the median GA4 bounce rate across all industries sits at approximately 45.9%. As more agencies shift to GA4’s event-based model, early data indicates the median bounce rate may be creeping up toward the low-50s. Watch for the next quarterly update to see how your clients compare, or track the up-to-date numbers using the AgencyAnalytics industry benchmarking tool.
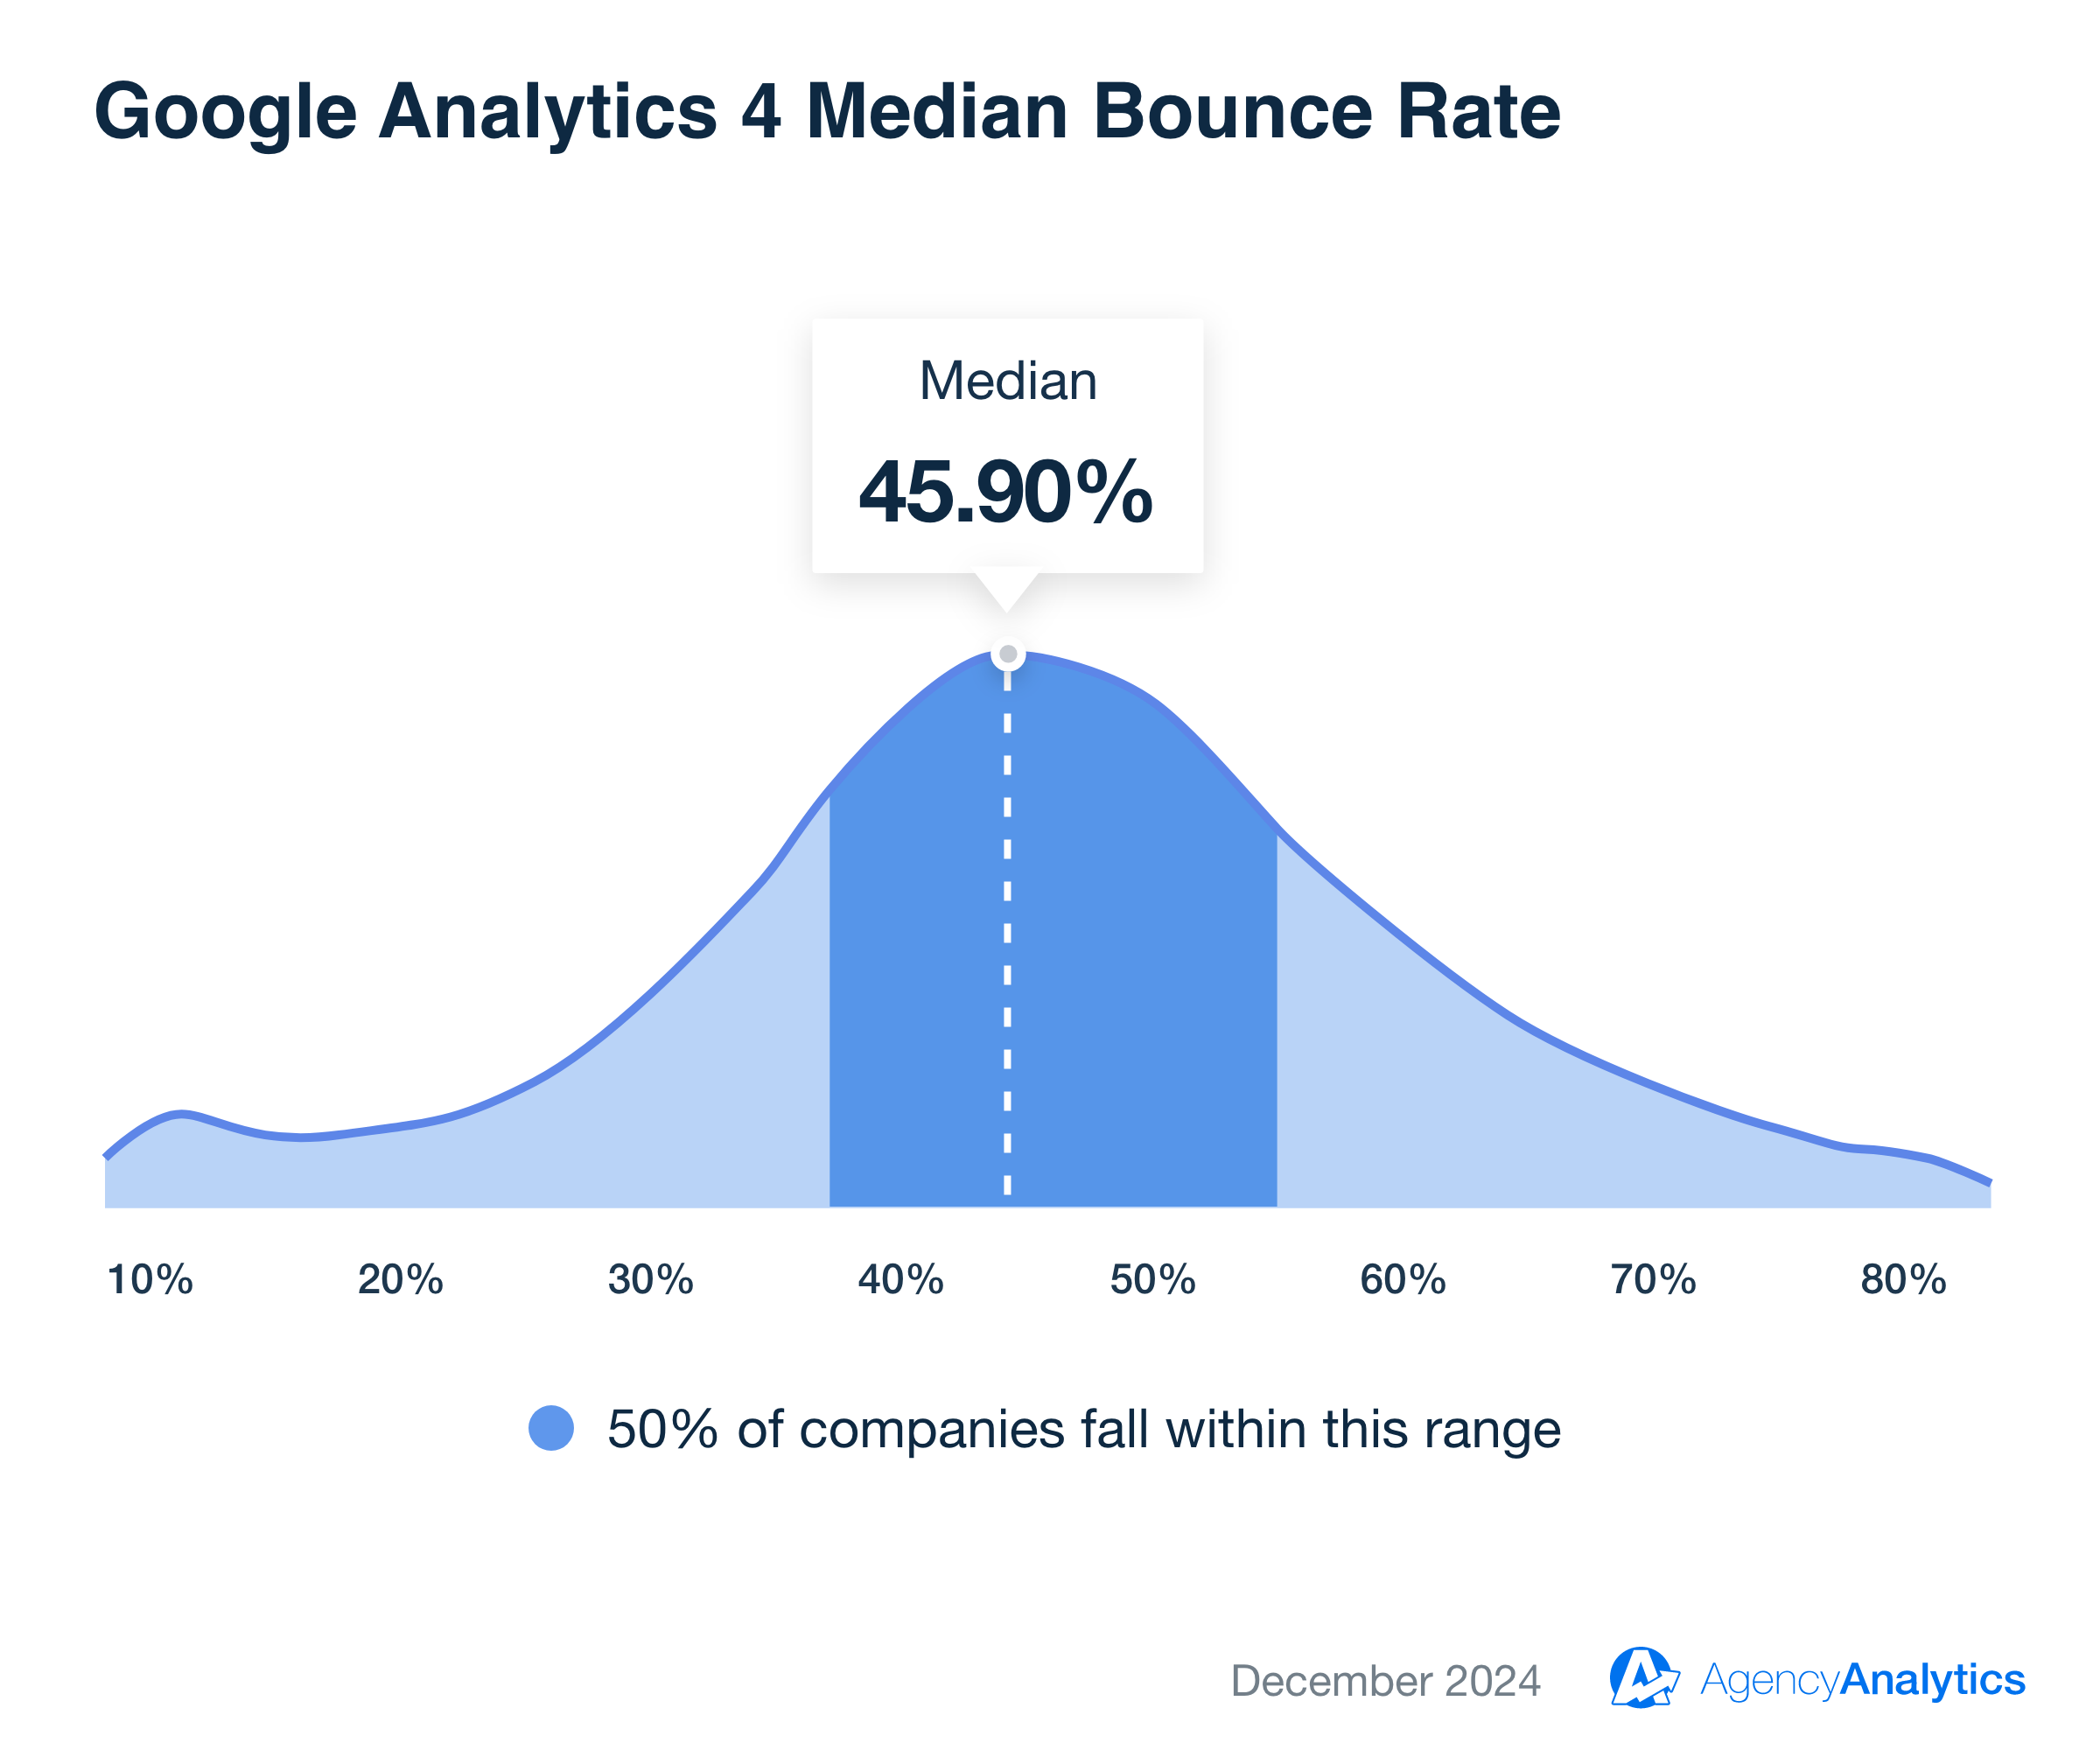
This data is based on the over 150,000 marketing campaigns run by the 7,000+ marketing agencies using the AgencyAnalytics platform to simplify their client reporting.
Although the overarching median is a value data point, it’s important to remember that bounce rates vary significantly depending on the client’s business and the audience, as seen in the table below.
Bounce rates in GA4 reflect a complex mix of user intent, content relevance, and interactive design. Industries with transactional or exploratory goals, such as travel or real estate, tend to have lower bounce rates due to inherently engaging content. Conversely, industries like advertising and marketing may naturally see higher bounce rates because many user visits are brief and intent-driven.
For example, advertising and marketing websites often experience higher bounce rates due to intent-driven visits that either satisfy the user’s need quickly or fail to offer a compelling reason to stay longer. A user visit might classify as a bounced session if the landing page lacks clear next steps or interactive elements.
On the flip side, travel websites often see the lowest bounce rates, as users typically engage deeply with itinerary planning and booking tools. Analyzing these trends offers insights into creating more interactive and engaging landing pages for other industries.
Median GA4 Bounce Rate by Industry
Understanding how bounce rate trends differ across industries helps your agency identify what’s normal for your clients’ niche—and what might signal a deeper engagement issue or optimization opportunity.
Industry | Median GA4 Bounce Rate (August 2025) |
|---|---|
Advertising & Marketing | 61.43% |
Business Services | 60.26% |
Dental Services | 56.65% |
Retail (Apparel & Fashion) | 45.35% |
Food & Beverage | 49.72% |
Real Estate | 50.79% |
Health & Fitness | 53.01% |
Education | 52.80% |
Finance & Insurance | 58.59% |
Attorneys & Legal Services | 59.61% |
Home Improvement | 54.37% |
Automotive Parts & Services | 57.99% |
Travel | 43.85% |
Median GA4 Bounce Rate by Country
Regional differences in bounce rate reveal how user behavior and engagement patterns vary by market, helping agencies localize strategy, refine content, and benchmark international performance more accurately.
Country | Median GA4 Bounce Rate (August 2025) |
|---|---|
United States | 56.15% |
Canada | 51.82% |
Australia | 51.86% |
United Kingdom | 49.16% |
Germany | 35.99% |
India | 53.22% |
Brazil | 49.84% |
South Africa | 48.94% |
Netherlands | 39.62% |
Mexico | 46.73% |
France | 45.28% |
Spain | 50.10% |
Denmark | 39.29% |
Benchmarks are derived from aggregated performance data across 150,000+ campaigns tracked on the AgencyAnalytics platform. Figures represent medians for August 2025.
Bounce Rate Examples: Blog Articles and Infinite Scroll
Imagine someone clicks on your client’s blog article and finds the article so interesting and informative that they end up reading the entire thing, spending seven minutes (or more) on the page before exiting.
Under Universal Analytics’ old definition of bounce rate, that session would have been considered a bounce since they didn’t click to another page or otherwise interact with the page at all. But counting that as a bounce doesn’t paint an accurate picture of average session duration or user engagement.
Meanwhile, under GA4’s new bounce rate definition, that same exact session would count as an “engaged session” (because the visitor spent over 10 seconds on the page), which means it wouldn’t count as a bounce, making the GA4 bounce rate calculation a more accurate measure of engagement.
Another example would be the infinite scroll on apps like Instagram, Facebook, and Reddit. If you endlessly scrolled for (what feels like) hours on Instagram without clicking on anything, Universal Analytics would count that as a bounce, whereas in GA4, that would be counted as an engaged session, and therefore it wouldn’t qualify as a bounce.
Why Was Bounce Rate Removed and Then Brought Back in GA4?
There are plenty of reasons why Google decided to phase out the old bounce rate when it first launched GA4, from a perceived lack of relevancy to the popularity of single-page applications (SPA).
But one thing Google failed to consider is that old habits die hard. Bounce rate has been around since the beginning of Google Analytics, which means there was more than a decade for marketers and agencies to become attached to the bounce rate, or at the very least, to always include it in their Google Analytics report template because their clients expected it.
It’s worth noting that GA4’s model continues to evolve. Google now uses an event-driven data architecture (rather than strictly session-based), which means the way “engaged” and “non-engaged” sessions are calculated can shift slightly as you adjust conversion definitions or implement custom events. In other words: when your team changes how engagement is tracked, your bounce rate may shift — not because user behavior changed, but because the data model did.
But in an age of single-page applications, the old definition of bounce rate isn’t useful anymore, but to understand why we need to look at what SPAs are and how they work.
What Are Single-page Applications?
Usually, when you’re on a website and click a link, your web browser loads a completely new page every single time. Depending on the website, a webpage can take anywhere from 0-30 seconds to load.
SPAs, on the other hand, are much faster because every click doesn’t load a new page. Instead, the current webpage is rewritten in real-time in response to user actions, making for a faster experience that’s more akin to what you’d expect on a mobile app.
Even if you’ve never heard of SPAs before, you probably use them every single day because they include giants like Gmail, Netflix, Instagram, Twitter, Google Maps, and Facebook.
For example, let’s say you’re on the web app for Gmail. Notice when you’re switching between your different mailboxes, the experience is almost seamless because the page doesn’t have to reload or refresh?
That’s the main benefit of SPAs.
Do Single-page Applications Make Bounce Rate Irrelevant?
Google certainly thought bounce rate was irrelevant, and it has a point. When the bounce rate was in UA, it was defined as the percentage of single-page sessions, but under that old definition, every single session on a single-page application would be considered a bounce.
Overall website bounce rate is probably the biggest vanity metric. Clients can get fixated on it. This could lead you to spend time on tasks that aren't helping the campaign's primary goal.
- Paul Morris, Managing Director, Superb Digital
So what’s the point in measuring the bounce rate if every single session is considered a bounce? This is one of the main reasons why Google changed the definition of bounce rate to be focused around engaged sessions instead of single-page sessions when it brought it back for GA4.
Should Engagement Rate Replace Bounce Rate?
Google hoped that engagement rate in GA4 would replace the old bounce rate because it believed engagement rate was a better way to measure how engaging your client’s website or app is. Although that sentiment didn’t play well with many marketing agencies.
Even though it's really not an accurate metric from a real-world perspective, I will miss bounce rate. Call me sentimental.
- Rick Hogan, CEO & Co-Founder, Bleevit
Many experts recommend focusing on engagement rate rather than bounce rates to get a better measure of user interaction.
When it was brought back due to popular demand, it was redefined in terms of engaged sessions. While it may be confusing for those who are used to Universal Analytics, it’s a lot easier to calculate the bounce rate in GA4 because it’s simply the inverse of the engagement rate.
For example, if your client’s website has an engagement rate of 40%, that means the bounce rate is 60%. Easy, right?
Should Bounce Rate Be Kept as a KPI?
One of the reasons why bounce rate is so misunderstood is that it’s not as easy as other metrics to determine whether it’s good or bad.
You might automatically think that a high bounce rate is bad and a low bounce rate is good, but it’s not that simple. You’ll often need a bit more context to figure that out, which makes it not as effective as other KPIs where you can tell at a glance.
For example, a user may be on the page for a very short time, just long enough to grab the phone number. Traditional views my see that as a bounce, but the user did exactly what you wanted them to do, which was pick up the phone. (Side Note: Using Google Analytics 4 call tracking is one way to identify those patterns).
This ambiguity can lead to misunderstandings, which is only compounded by the fact that Google changed the definition of bounce rate between UA and GA4, so be prepared to do some explaining (whether it’s to your agency teammates or your clients) if they aren’t up to speed and you decide to keep the bounce rate as an important metric for your client reporting.
Pros and Cons of Tracking Bounce Rate
Tracking bounce rate in GA4 is still a good idea to give an overall view of how users engage with your client’s websites, but it shouldn’t serve as the be-all and end-all metric.
You should still keep a few caveats in mind because even though GA4’s updated definition of bounce rate makes it more accurate and relevant for measuring engagement, there are still times when it can give you the wrong impression.
Like what if someone is on their laptop and clicks on your client’s webpage, only to get distracted by a text message on their phone, which they spend 20 seconds responding to before getting back to their laptop and closing your client’s page?
Since the 20 seconds spent on-page is more than the 10-second threshold, GA4 would NOT consider this a bounce, even though it technically was since that user didn’t actively engage with the website because they got distracted.
Because the default “10-second” threshold for an engaged session is still a baseline, agencies may choose to adjust their own definition of “engaged” (e.g., raising it to 30 seconds or adding a scroll event) to better reflect real user behavior. If your settings change, your bounce rate will reflect that alteration — so be transparent with clients about “what counts” as engagement.
The best approach is to view it as a general indicator of user engagement, and if you notice any big changes, it’s worth investigating further to find out why and improve the bounce rate.
At the same time, there are other important things to track like your conversion metrics, engagement rate, and time spent on site, that can give you a better idea of the bigger picture and add more context to the bounce rate.
Considering the bigger picture is critical to making decisions and developing your strategy, and relying solely on bounce rate for engagement would give you a distorted, tunnel-vision-like view
Engagement Rate vs. Bounce Rate: How Do They Compare?
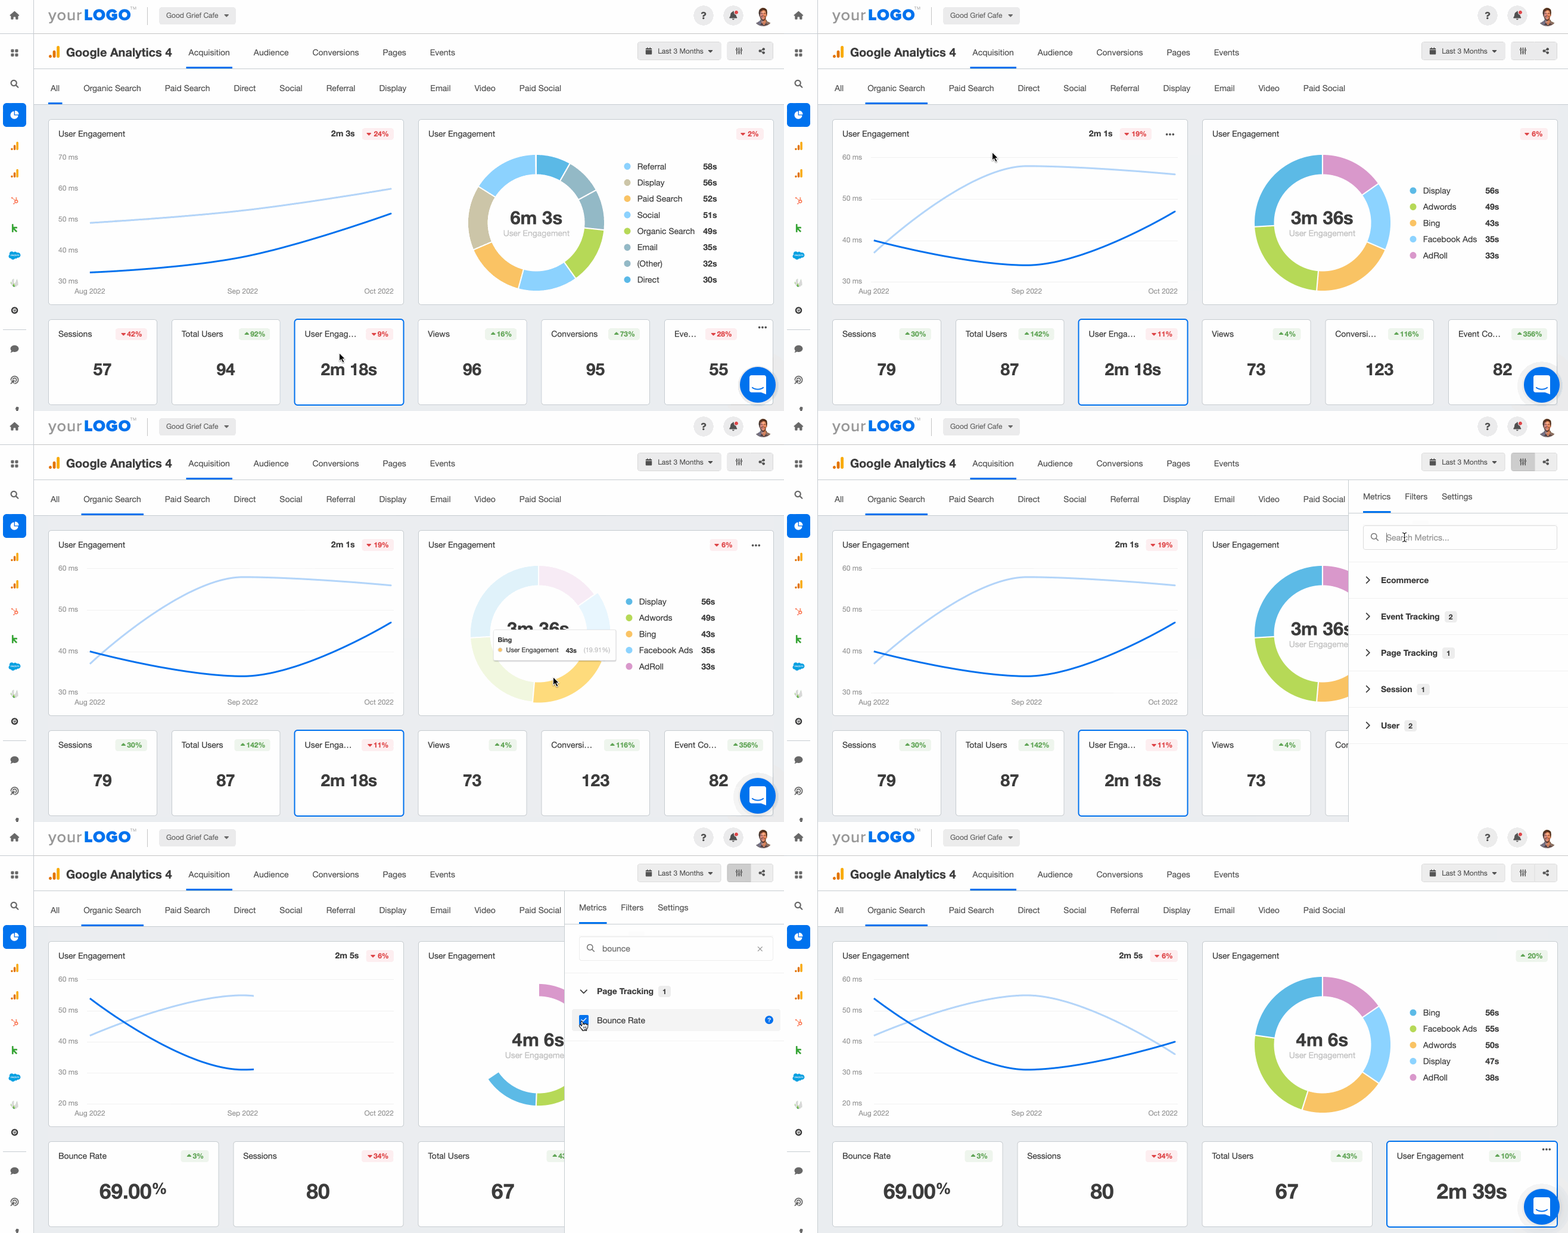
Switching between bounce rate and engagement rate is easy with automated reporting software. Try this dashboard free for 14 days!
As mentioned earlier, bounce rate is the inverse of engagement rate in Google Analytics 4. So if your clients have an engagement rate of 40%, that means the bounce rate is 60%.
Pretty simple, right?
Remember: In GA4, Engagement Rate + Bounce Rate = 100% (for the same session set). This makes bounce rate literally the inverse of engagement rate — a useful rule for quickly interpreting one if you’re only reporting the other.
But that leads us to the next question.
How to Track Bounce Rate in GA4
GA4 already tracks many different metrics and events by default and it also allows you to create and track your own custom events as well.
Remember earlier when we learned that the bounce rate in GA4 is the percentage of sessions that:
Were less than 10 seconds long,
Had zero conversion events, and
Had less than 2 page or screen views
The first and third criteria are relatively straightforward, but the middle one about conversion events is where things get more interesting. That’s because Google Analytics 4 allows us to define our own conversion events.
For example, you could set scroll depth as a conversion event for your client’s blog page, so if someone scrolls down to the bottom of an article, it will be automatically considered an engaged session and you can track custom conversion events like that using Google Tag Manager.
🔍 2025 feature update: GA4 now offers built-in custom definitions for “engaged sessions” below Admin → Data Streams → Enhanced Measurement → Adjust timer for engaged sessions. Agencies should review this setting at least quarterly, especially when they launch new content formats (e.g., long-form video) or adapt to new UX designs.
Where Do You Find Engagement Rate and Bounce Rate in GA4?
You can find engagement rate and bounce rate in both reports and explorations (this is a feature that allows you to dig deeper into the data than standard reports), although you’ll have to do some customizing in order to display the two metrics.
But don’t worry, it’s easy enough, and we’ll show you how.
So let’s say you wanted to add engagement rate and bounce rate for the next time you create Google Analytics client reports.
Here’s how to do it, according to Google:
On the top right of the report, click Customize report
In the REPORT DATA section, click Metrics
Select the Engagement rate and Bounce rate metrics
Click Apply
Click Save > Save changes to current report > Save
You’ll probably be relieved to hear that this process can be used to add the two metrics to most reports, although it may be redundant to display both metrics since they’re simply the inverse of each other.
As long as you know one of them, it’s easy to figure out what the other is.
Using Bounce Rate and Engagement Rate in Your Client Reporting
Once you’ve got your clients’ Google Analytics 4 accounts set up to track bounce rate and custom conversions, you’ll need a streamlined way to track all of this data–in real time. Otherwise, you’ll be spending hours clicking between client accounts come reporting time.
And always present bounce rate in context—alongside engagement rate, conversion metrics, and average engagement time—to give a more complete picture of user behavior and site performance.
AgencyAnalytics integrates with GA4 to make this easy!
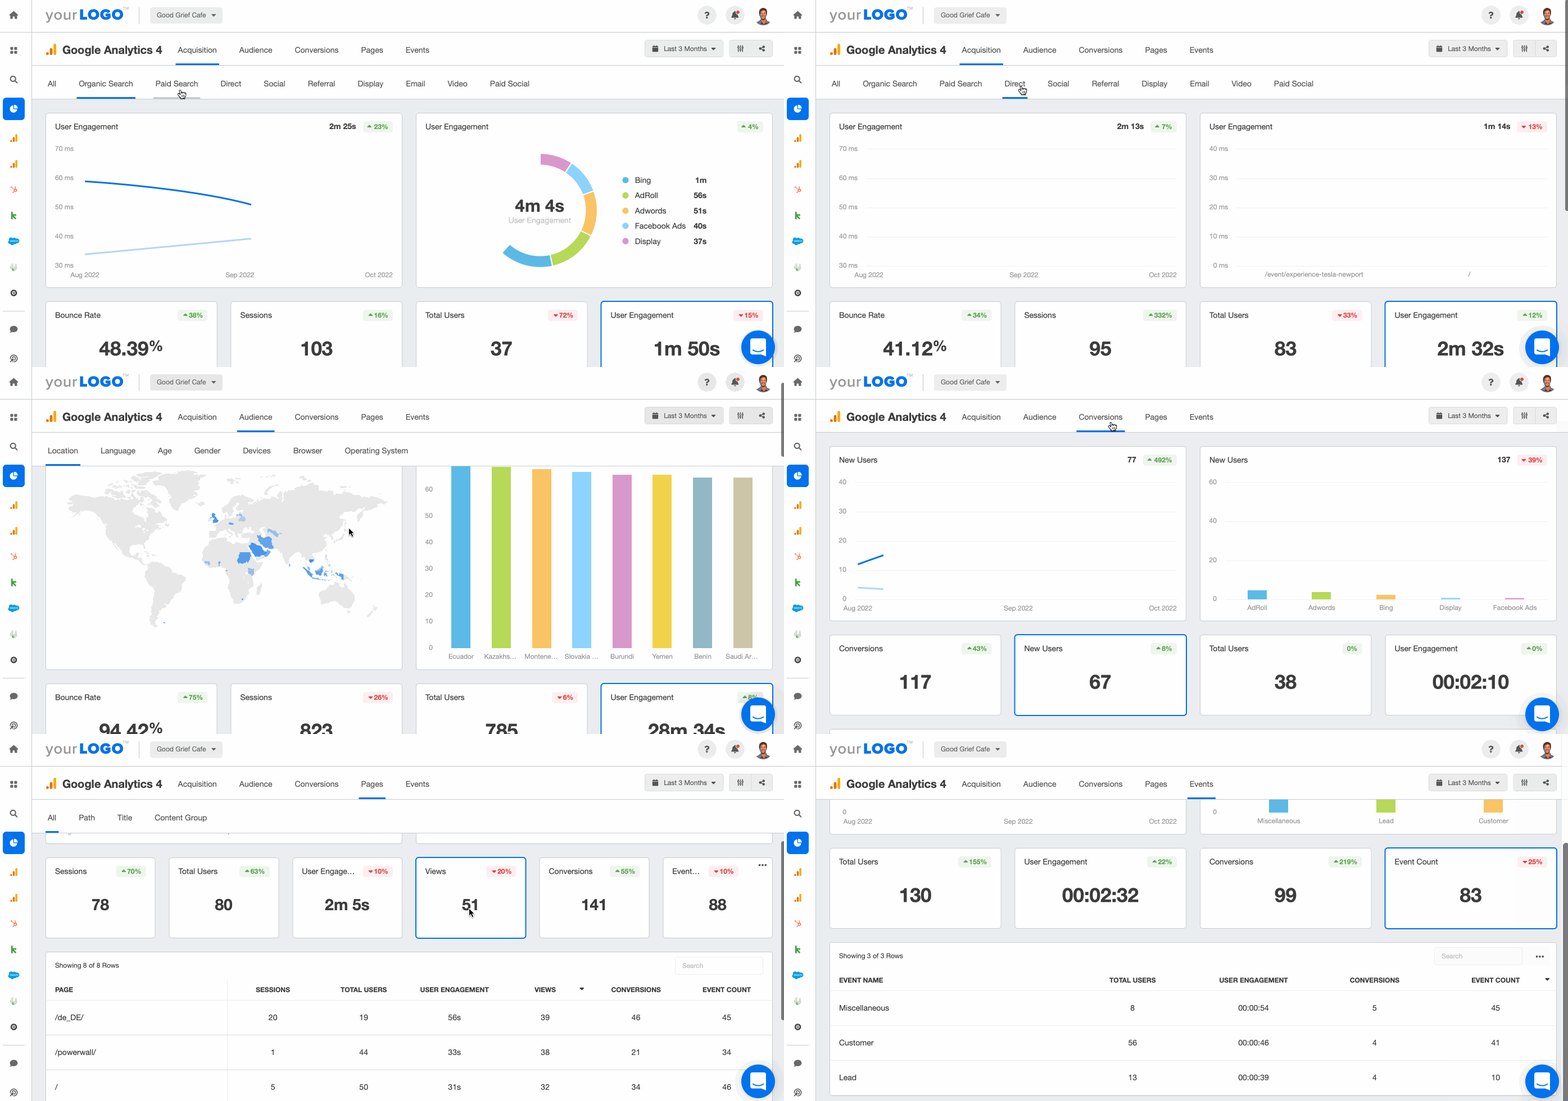
Track all your clients’ Google Analytics KPIs in intuitive dashboards that automatically update with real-time metrics. Save hours on client reporting with AgencyAnalytics. Try it free for 14 days!

Written by
Michael is a Vancouver-based writer with over a decades’ experience in digital marketing. He specializes in distilling complex topics into relatable and engaging content.
Read more posts by Michael OkadaSee how 7,000+ marketing agencies help clients win
Free 14-day trial. No credit card required.


