Engaged Sessions
User Engagement
Identifies highly engaged users by measuring meaningful interactions.
Content Effectiveness
Evaluates which content keeps users engaged and active.
Campaign Performance
Assesses the impact of marketing campaigns on user engagement.
Site Optimization
Helps optimize site elements to enhance user interaction.
Why Engaged Sessions Matter
Tracking Engaged Sessions is critical for understanding user engagement on a website. This metric indicates how effectively the site captures user interest, directly impacting Conversion Rates. High engagement metric numbers suggest valuable and engaging content, leading to better user retention and higher conversion events.
Engaged Sessions also provide insights into user behavior, aiding in optimizing marketing campaigns and website design. This metric is key for demonstrating the effectiveness of digital marketing efforts to stakeholders and clients.
Stop Wasting Time on Manual Reports... Get Insights Faster With AgencyAnalytics
How Engaged Sessions Relate To Other KPIs
Engaged Sessions correlate with KPIs like Bounce Rate, Average Session Duration, and Conversion Rate. A low Bounce Rate often coincides with a high number of Engaged Sessions, indicating effective content and user experience. Tracking Average Session Duration alongside Engaged Sessions provides insights into how deeply users interact with the site. Engaged sessions influence Conversion Rates, as users who spend more time and interact more are likely to complete conversion events.
Engaged Sessions also provide context for interpreting metrics like Click-Through Rates (CTR) and Pageviews. For example, a high CTR with low Engaged Sessions might indicate misleading or irrelevant ad content. Understanding these relationships helps in painting a comprehensive picture of digital campaign performance.
Key Factors That Impact Engaged Sessions
Website content quality significantly impacts Engaged Sessions. High-quality, relevant content encourages users to stay longer and interact more. Another factor is website usability; an intuitive design and smooth navigation enhance user experience, reducing session timeout and increasing engagement.
User experience (UX) design is another critical factor. Intuitive navigation and visually appealing layouts enhance engagement. Lastly, targeted marketing efforts that align with user interests and behaviors ensure that the right audience finds the content, increasing the likelihood of engagement.

KPIs allow us, as an agency, to demonstrate our value to the client. Ultimately, what is their ROI from our efforts? When you can clearly demonstrate this month over month, it increases your retention rate and keeps clients paying you month after month.
How To Calculate Engaged Session Rate
Calculate Engaged Sessions by tracking the number of active sessions where a user stays on the site for at least 10 seconds, generates two or more pageviews, or completes a conversion event. Engaged Sessions divided by Total Sessions provides a clear view to what percentage of visitors engage with the website's content.
Engaged Session Rate Formula Example
What Is a Good Engaged Sessions Rate?
A good Engaged Sessions rate typically exceeds 50% of total sessions, indicating that most users find the content valuable enough to interact meaningfully. This engagement rate suggests that the website effectively captures and retains user interest, leading to longer visit durations, more page views, and an increased likelihood of conversion.
What Is a Bad Engaged Sessions Rate?
A bad engaged sessions rate falls below 30% of total sessions, indicating that less than a third of users engage meaningfully with the content. This low engagement level suggests irrelevant content, poor user experience, or marketing strategies that don’t attract the right audience, leading to shorter visit durations, fewer page views, and lower conversions.
How To Set Engaged Sessions Benchmarks and Goals
Agencies should analyze historical data to set benchmarks. Reviewing other engagement metrics, session counts, and average session duration helps establish realistic targets based on previous performance trends.
Back-calculate the required Engaged Sessions to achieve specific revenue targets. For instance, if a certain Conversion Rate leads to a desired revenue, determine how many Engaged Sessions are needed to reach that Conversion Rate, factoring in the average engagement time and Bounce Rate.
Dig deeper into Engaged Sessions by examining:
Traffic Acquisition Report: Identify which traffic sources generate user acquisition and the most engaged web sessions.
Campaign Source: Evaluate the effectiveness of different marketing campaigns in driving engagement.
Session Number: Analyze the frequency of Engaged Sessions over multiple user visits.
Engagement Overview: Review comprehensive engagement metrics, including session data, user behavior, and session timeout settings.
Goals for Engaged Sessions should align with overall business objectives. If the aim is to increase the user engagement rate metric by 20%, adjust strategies to improve session counts, session timeout settings, and overall engagement rates. Regularly monitor progress through Google Analytics, using exploration reports to track changes and make necessary adjustments.
Median GA4 Engagement Rate for SMB Campaigns
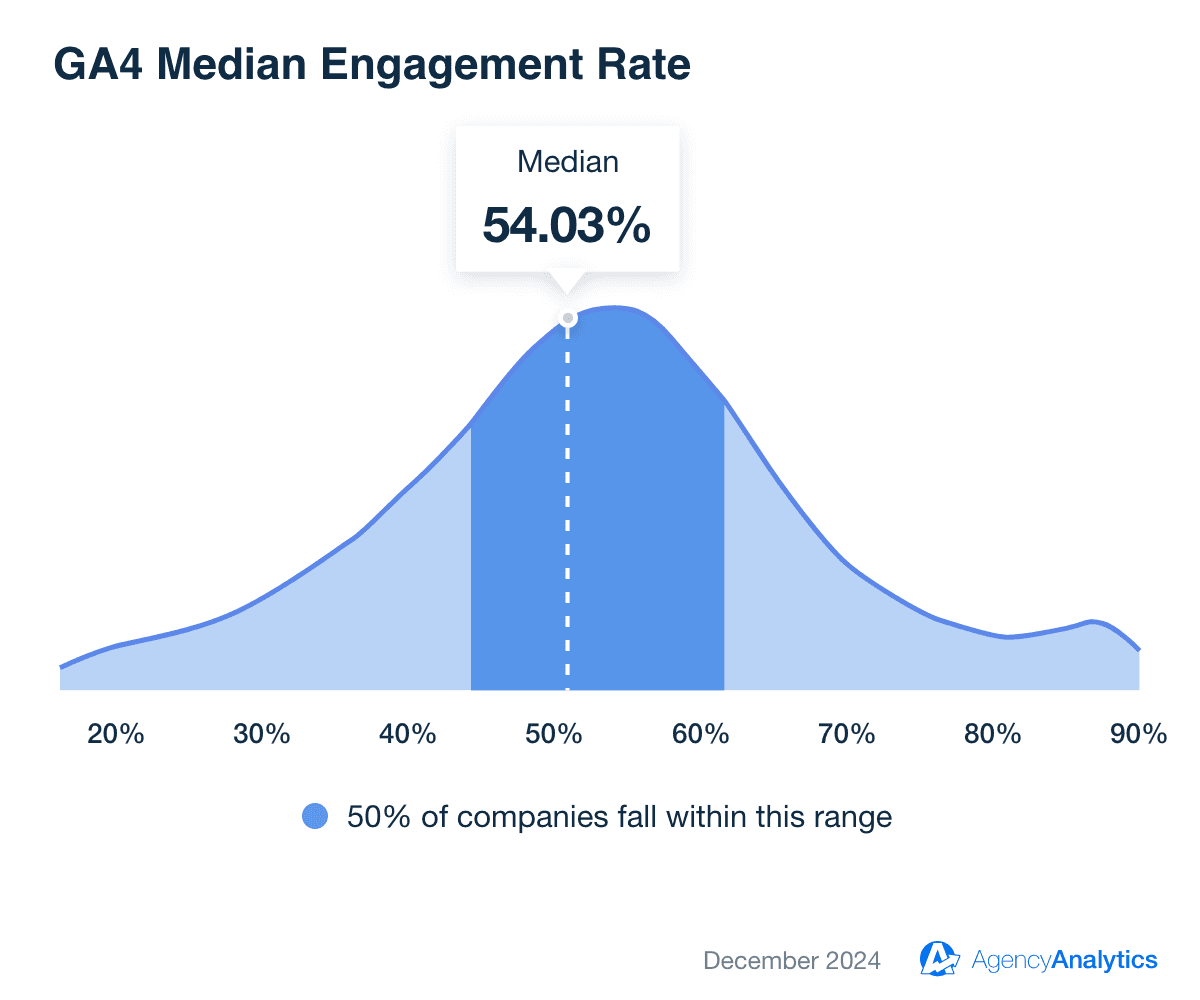
The median GA4 Engagement Rate currently sits at 54.03%, based on performance benchmarks from over {{campaign-count}} campaigns managed by {{customer-count}}+ marketing agencies. This figure reflects the typical range for SMBs, where engagement rates often depend on factors like website design, content relevance, and user intent.
Understanding how an Engagement Rate compares to industry standards helps agencies identify opportunities to optimize website content, improve user experiences, and boost overall engagement with targeted audiences.
Access detailed performance benchmarks and see how campaigns measure up. Get started with a 14-day free trial.
Why Engaged Sessions Matter to Clients
Engaged Sessions per user provide insights into the success of marketing efforts, showing which campaigns drive quality traffic. High engagement rates suggest that users find the content valuable, which improves brand perception and customer satisfaction. Analyzing session data, including session counts and engagement metrics, helps clients optimize their strategies, ensuring higher returns on their marketing investments.
Monitoring Engaged Sessions and related engagement data allows clients to identify areas for improvement in user experience. Clients will make data-driven decisions to enhance navigation, content, and overall website performance by understanding user behavior through session metrics and engagement rate metrics. This analysis, supported by session timeout settings and average session duration, ensures that the website effectively retains and converts users.

Why Engaged Sessions Matter to Agencies
Engaged Sessions provide key insights into user behavior and engagement metrics, allowing agencies to refine their strategies and improve performance. Monitoring session data, including session count, engagement rate metrics, and other engagement data, helps agencies identify successful tactics and areas needing improvement. This data-driven approach ensures that marketing campaigns are tailored to maximize user interaction and engagement, enhancing the overall effectiveness of their marketing efforts.
Showcasing Engaged Sessions in client reports reinforces the value and ROI generated by the agency’s work. By presenting detailed engagement metrics, agencies demonstrate their impact on user engagement and conversion events. This transparency builds client trust and satisfaction, highlighting the agency's expertise in driving meaningful engagement and successful marketing outcomes.

Best Practices When Analyzing and Reporting on Engaged Sessions
Conducting a thorough analysis of Engaged Sessions helps create more effective digital marketing strategies. By examining how users interact with a website, marketers gain valuable insights into what captures and retains the audience’s attention.
Ensure Data Accuracy
Check the accuracy of data collected from different sources (e.g., Google Analytics 4) to ensure reliable insights. Cross-check data from various tools to spot discrepancies, ensuring the foundation for decision-making is solid.
Analyze Over Time
Look at engagement trends over different periods to spot patterns and understand long-term user behavior. Historical data reveals recurring trends, seasonal changes, and the effects of specific campaigns, helping with future predictions and goal-setting.
Compare Across Channels and Campaigns
Collect data from multiple traffic sources—search engines, social media, or email campaigns—and marketing channels to see how they contribute to Engaged Sessions. Compare engagement from different marketing campaigns to determine which ones get the most interaction.
Put in Context
Engaged session metrics should be considered in the context of overall site performance and other key metrics. Comparing Engaged Sessions with Bounce Rate, average session duration, and Conversion Rate provides a fuller picture of user behavior and site effectiveness.
Align to Client Goals
Ensure engagement strategies match client objectives, showing how Engaged Sessions support broader business goals. Aligning with client goals like increasing brand awareness, driving sales, or improving customer retention strengthens the agency-client relationship.
Visualize Performance
Visual tools like charts and graphs present engagement data clearly, making it easier to understand and communicate findings. Visual presentations simplify complex data and highlight important trends.
KPIs are common metrics the client and our agency agree are valuable. This allows us to have beneficial conversations and move their business in the direction they want. We’re not wasting time or resources on anything the client doesn’t understand.
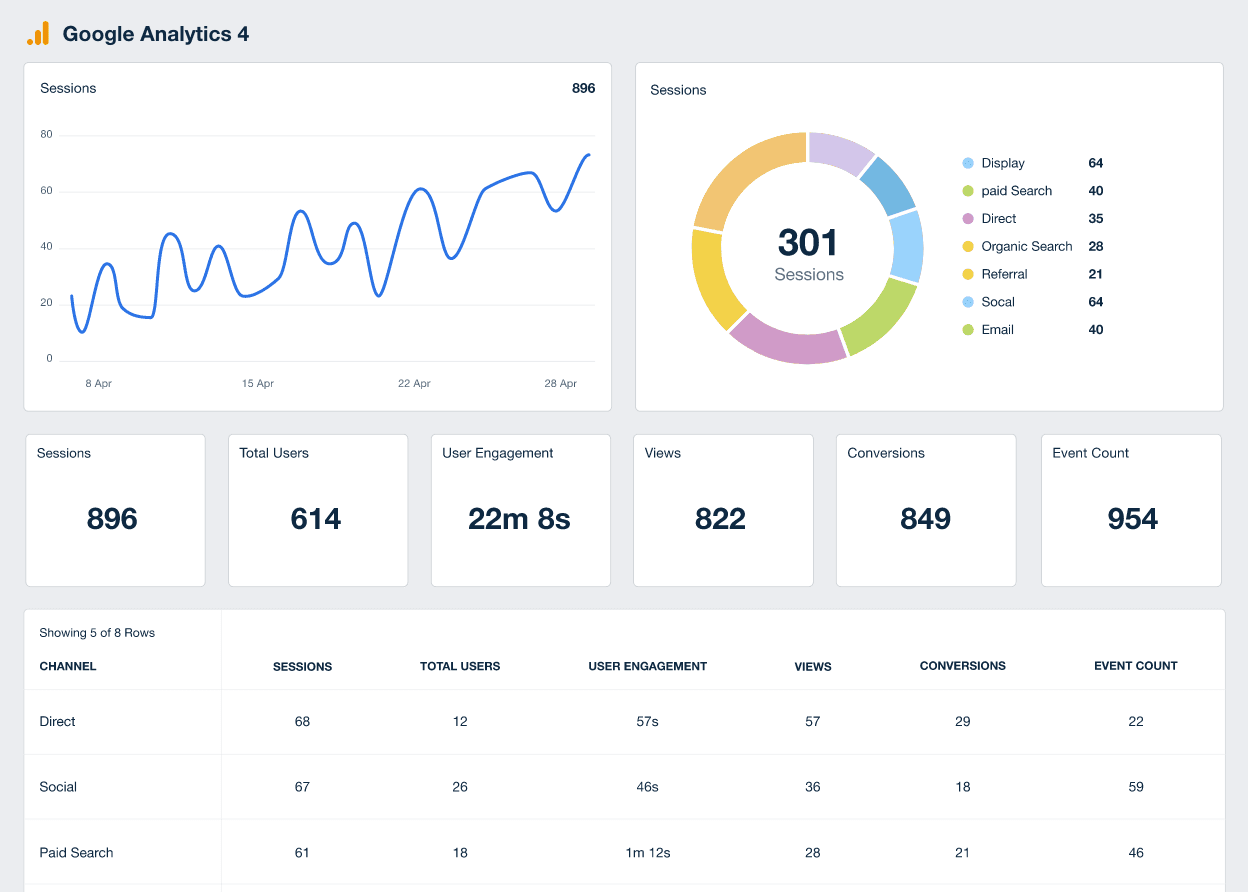
Google Analytics (GA4) Dashboard Example
Related Integrations
How To Improve Engaged Sessions
Improving Engaged Sessions involves multiple strategies to enhance content, user experience, and overall engagement. Here are a few essential tips to improve this metric.
Enhance Content Quality
Focus on creating high-quality, relevant content that addresses the needs of the target audience. Regularly update and refresh content to keep it current and engaging and prevent user inactivity.
Optimize Page Load Times
Ensure the website loads quickly to reduce the chances of users leaving before they engage. Optimize images, use efficient coding practices, and leverage content delivery networks (CDNs).
Improve Navigation
Design intuitive navigation that helps users find information easily. Use clear menus, breadcrumbs, and internal linking to guide users through your site seamlessly and extend their active session.
Related Blog Posts
See how 7,000+ marketing agencies help clients win
Free 14-day trial. No credit card required.


