Sessions per User
Behavior Insights
Track how often a user interacts with a website.
Content Wins
Identify pages driving return visits using session data.
Campaign Impact
Measure if campaigns boost repeat visits using Google Analytics.
Showcase ROI
Highlight increased Sessions per User in client reports.
Why Sessions per User is a Key Metric to Track in Google Analytics
The GA4 Sessions per User metric reveals how often visitors return to engage with a website. By calculating the average number of sessions per individual user, this data offers insight into audience behavior and the effectiveness of a website in fostering repeat visits.
High Sessions per User values often indicate a loyal audience and a strong connection to the brand, while lower numbers may signal the need for improvements in engagement strategies.
Stop Wasting Time on Manual Reports... Get Insights Faster With AgencyAnalytics
How User Sessions Data Works Together
Google Analytics tracks User Sessions as part of a broader ecosystem of session metrics that clarify user behavior. For instance, pairing Sessions per User with metrics like bounce rate highlights how engaging the content is for repeat visitors. A high bounce rate paired with frequent sessions might suggest users return but don’t find new value, indicating areas for improvement.
User Sessions also relate to website traffic. While traffic measures the volume of visitors, Sessions per User adds depth by showing how actively these visitors interact over time. Metrics like average session duration, event count, or conversion rate provide further context, revealing whether frequent interactions translate into desired outcomes such as purchases or sign-ups.
Top Factors That Influence How a User Interacts With a Website
Content relevance and quality rank high on the list; fresh, engaging, and valuable content encourages users to return frequently. Websites that update their blog, resources, or offers regularly tend to see higher interaction rates.
Website performance also plays a role. Slow loading times or technical issues often frustrate users, discouraging repeat visits. Similarly, user experience factors like intuitive navigation, mobile optimization, and clear calls to action foster more interactions.

It’s very difficult to explain the value of a service to a client without visuals. Using the web analytics report and the SEO reports side by side, helps us show our clients a correlation between SEO and Traffic. We merge this data with a custom template that tracts conversions, and stripe data to show that traffic growth - from SEO and PPC - does have an impact on the number of conversions and revenue (their bottom line).
How To Calculate Sessions per User
Sessions per User is a default metric in Google Analytics, providing an automatic view of average user engagement. This data is based on the total number of sessions divided by the total number of unique users within a specific time period.
Sessions per User Formula Example
What Is a Good Number of Sessions Per User?
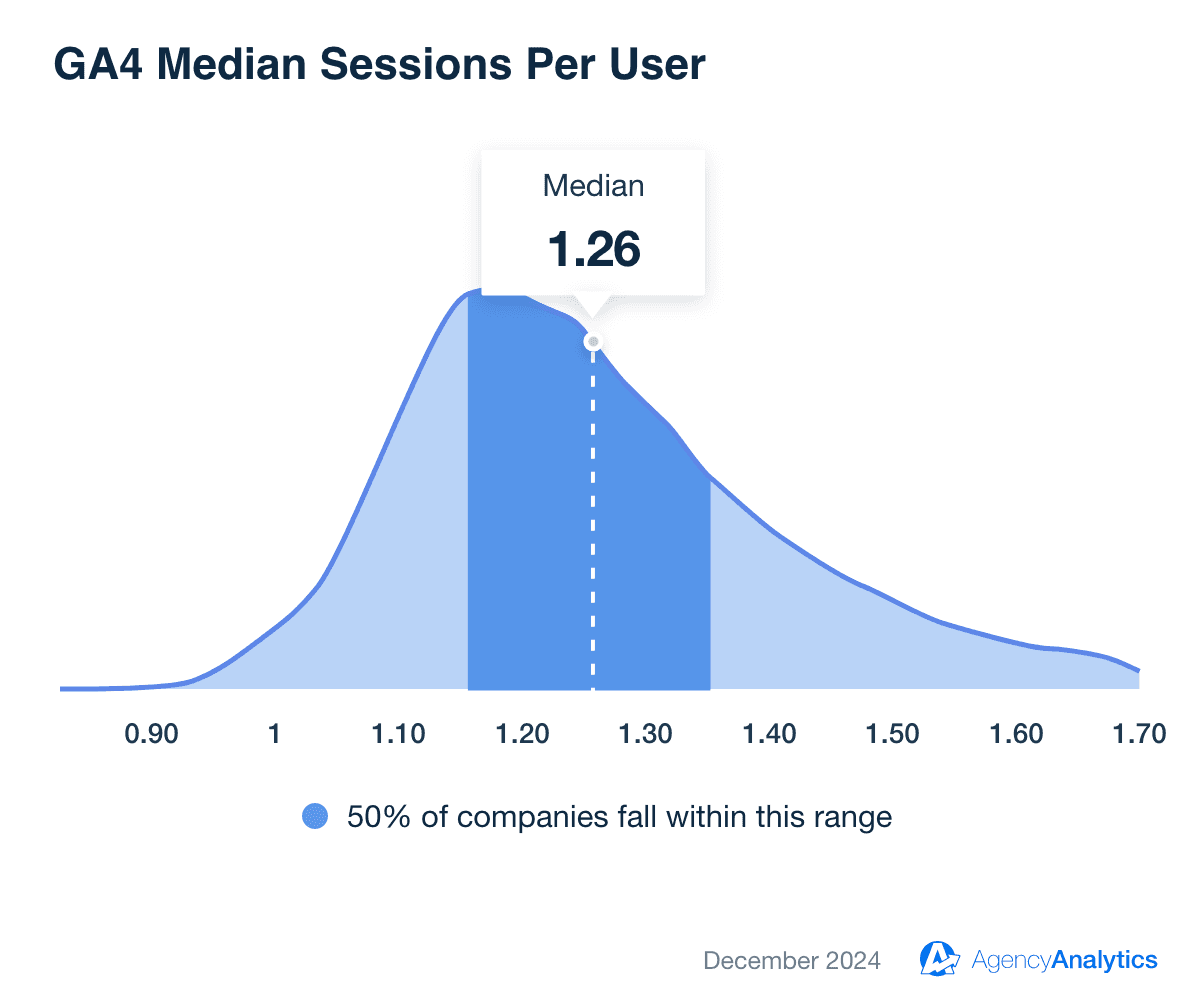
For SMB websites, a good average Sessions per User typically exceeds the median of 1.26. Higher averages suggest strong engagement, where visitors find value in returning to the site for updates, content, or offerings.
What Is a Bad Number of Sessions Per User?
A Sessions per User average below the median of 1.26 could indicate challenges such as irrelevant content, poor user experience, or insufficient reasons for users to return. This signals the need for deeper analysis and strategic adjustments.
How To Dig Deeper in Sessions Per User Data
Segmenting this metric by user industry, demographics, traffic sources, or content types can reveal patterns behind the data. For instance, analyzing Sessions per User by traffic source helps identify campaigns driving repeat visits, while content segmentation pinpoints pages or formats that resonate most, guiding targeted optimizations.
Average GA4 Sessions per User for SMB Website
The Sessions per User benchmark is 1.26, based on performance data from over {{campaign-count}} campaigns managed by {customer-count}}+ marketing agencies. This benchmark provides a reliable reference point for SMB websites, helping marketers gauge engagement and track repeat visits across campaigns.
Understanding how Sessions Per User compares to this industry benchmark allows agencies to evaluate user engagement levels and pinpoint areas for improvement, such as refining content strategies or enhancing the user experience to encourage return visits.
Access detailed performance benchmarks and see how campaigns measure up. Get started with a 14-day free trial.
Why Sessions Per User Matters to Clients
For clients, Sessions Per User highlights how effectively a website captures and retains audience interest. This website metric tracks repeat engagement by analyzing new sessions started by users over a specific date range.
Clients use this data to understand how their site serves as a touchpoint for customers, whether for information, transactions, or deeper engagement. When the metric trends upward, it indicates that strategies like content updates, offers, or improved navigation are resonating with users and driving consistent interactions.

Why Sessions Per User Matters to Agencies
For agencies, Sessions Per User offers a strategic lens for evaluating campaign performance and optimizing client outcomes. This metric, derived from session IDs and tracking sessions across campaigns, sheds light on the success of tactics like retargeting or personalized content. By analyzing trends within a specific date range, agencies can align recommendations with client goals.
Agencies also use Sessions Per User to flag areas for improvement, such as content that isn’t compelling enough to prompt repeat visits or issues like session timeout impacting user retention. This insight helps agencies refine digital marketing efforts, boosting engagement metrics, and showcasing their value to clients.

Save Time and Streamline Your Agency’s Web Analytics Reporting
Best Practices When Analyzing and Reporting on Sessions per User
A thorough analysis of Sessions Per User from different perspectives reveals valuable insights that inform better advertising strategies.
Track Sessions Per User Over Time
Analyze Sessions Per User trends by month, quarter, or campaign duration to highlight the impact of specific marketing activities.
Compare Across Marketing Channels
Pinpoint high-performing channels and optimize underperforming ones to refine digital marketing efforts.
Spot Trends and Anomalies in the Data
Unexpected spikes or dips often signal opportunities or issues, such as successful promotions or potential website errors.
Put Sessions Per User Metrics in Context
Sessions Per User data gains more meaning when paired with related KPIs, such as average session duration or conversion rates.
Create Visual Insights for Clients
Highlight trends, comparisons, and results in a clear, digestible format, helping stakeholders see the impact of their marketing investments.
Provide Actionable Recommendations
Include the next steps for improving Sessions Per User, such as optimizing website performance, refreshing content, or enhancing ad targeting.
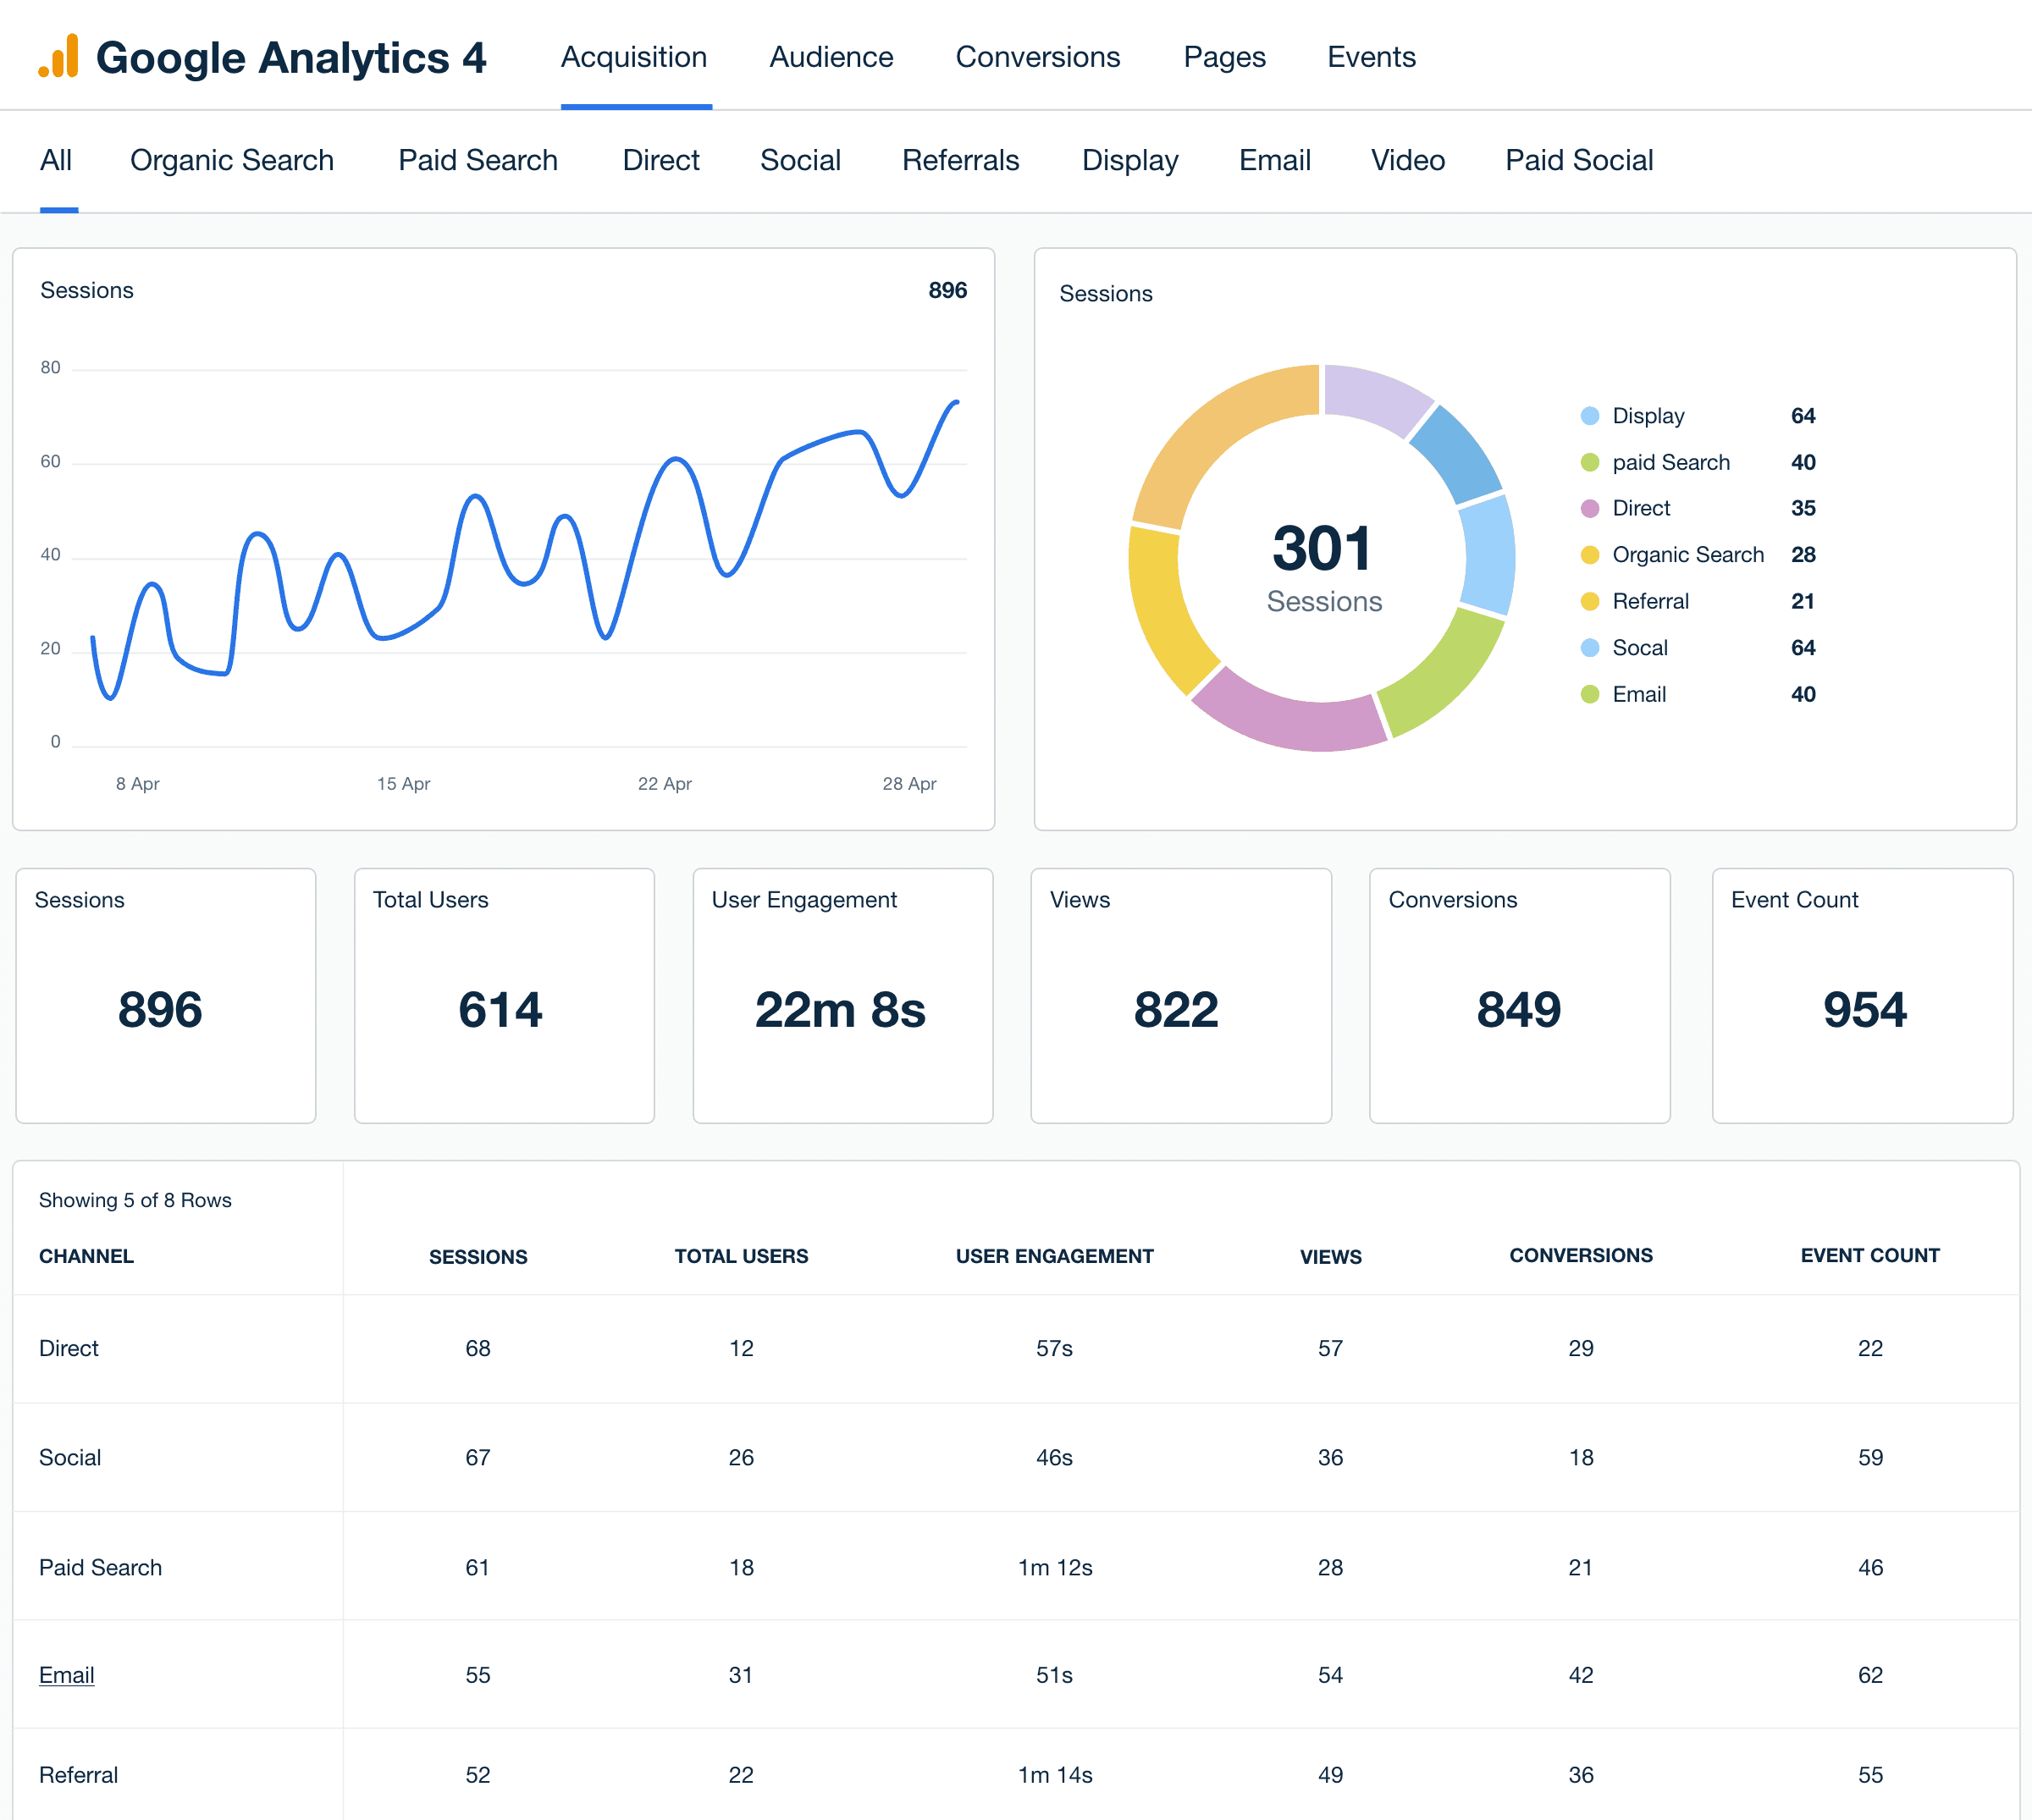
By customizing dashboards, we can highlight and prioritize the client KPIs that are most relevant to them, ensuring that we’re delivering data that’s both actionable and meaningful to them. This level of personalization not only allows us to present data in a way that’s most digestible and valuable to the client, but it also demonstrates our commitment to understanding their business and needs at a more personal level.
Google Analytics 4 Dashboard Example
Related Integrations
How To Improve Average Sessions Per User
Boosting Sessions Per User requires a focused approach to enhancing website content, usability, and engagement. These actionable tips help increase return visits and deepen audience interaction.
Keep Content Fresh
Regularly update blogs, resources, or offers to maintain relevance and give users reasons to revisit.
Optimize Page Speed
Fast-loading pages reduce frustration and improve user experience, making visitors more likely to return.
Encourage Return Visits
Use email campaigns, retargeting ads, or loyalty programs to keep users engaged.
Related Blog Posts
See how 7,000+ marketing agencies help clients win
Free 14-day trial. No credit card required.


