Sessions
User Engagement
Gauge how compelling and findable website content is. Higher Session numbers correlate with increased reach.
Proof of ROI
Include Sessions in client reports to tangibly demonstrate agency-generated traffic, reinforcing the overall contribution to business growth.
Attribution Modeling
Assess which marketing channels are most effective for reaching and engaging with the target audience.
Showcase Growth
An increase in Sessions over time signals marketing strategy and campaign effectiveness.
Why Tracking Sessions Matters in Google Analytics
Sessions are one of the cornerstone metrics in Google Analytics, capturing a comprehensive snapshot of user activity. A single web session is defined by Google Analytics as a series of interactions by a user on a site until 30 minutes of inactivity occurs.
The unique Session ID assigned allows for tracking a user's path through the website, from entry to exit. This makes Sessions essential for understanding how people engage with a site, providing crucial data for analysis and optimization.
Although one user can generate multiple Sessions, each Session tells its own story of engagement and behavior. Marketers pay close attention to Google Analytics Sessions to understand how individual and collective user journeys unfold. Tracking this metric helps refine marketing strategies, enhance user experience, and drive more effective campaigns.
Stop Wasting Time on Manual Reports... Get Insights Faster With AgencyAnalytics
How Sessions Correlate with Other Vital KPIs
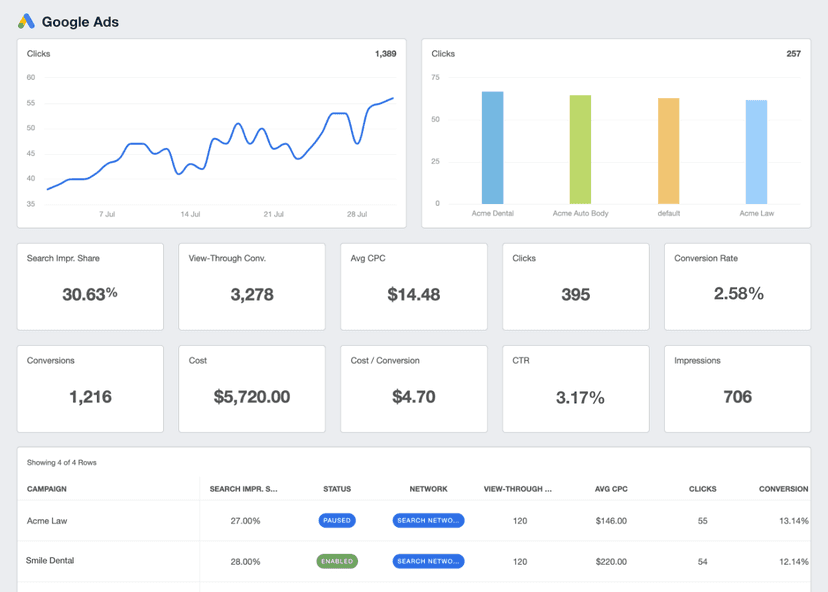
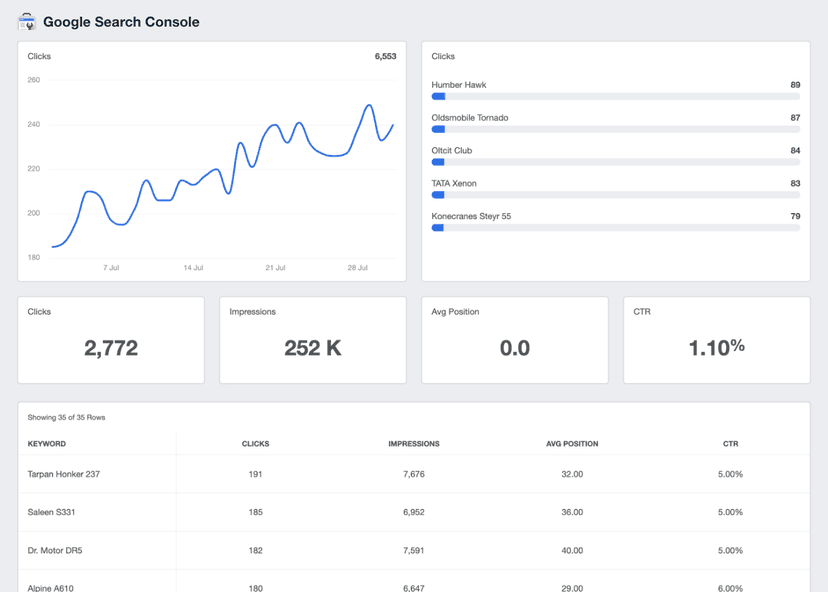
Sessions work in concert with other key performance indicators to give a fuller picture of a marketing campaign's effectiveness. For instance, a rise in Google Ads clicks or higher Keyword Rankings leads to increased Sessions, as greater visibility draws more users to the website. An uptick in Sessions also provides insights into the effectiveness of various marketing channels, whether it's organic search results or social media clicks.
Session data offers a treasure trove of contextual information when coupled with other Google Analytics metrics. Analyzing Sessions alongside metrics like Bounce Rate and Average Session Duration provides insights into how many people visit the site and how they interact with it once they arrive. This interconnected data collection proves invaluable for agencies and clients aiming to fine-tune their marketing strategies and boost overall performance.
Optimizing Using Web Analytics
Marketing agencies are stretching the traditional use of Session data to gain more actionable insights. This metric brings a layer of nuance to web analytics, making it easier to differentiate between various types of engagement and activity that go beyond the basics.
Behavioral flow analysis takes Session data and uses it to predict user actions. Real-time personalization is another trend, customizing content for each visitor based on their Session data. Marketers also link activity across devices for a complete view of user behavior. Lastly, predictive scoring models help allocate resources to the most promising Sessions.
How To Measure Sessions
Google Analytics 4 automatically tracks Sessions in the native platform. A Session begins each time a user enters the website or app–or after 30 minutes of inactivity–and unique Session IDs are assigned to track the user journey within a single Session. To find Sessions inside a Google Analytics Account, head to the Engagement section in the left nav panel and click Events.
How To Set Session Benchmarks and Goals
Agencies often rely on historical Session data to project future growth goals by analyzing previous engagement trends—such as seasonal spikes or drops in web Sessions. With this data, agencies craft data-backed strategies for upcoming campaigns.
But the real magic happens when this data is cross-referenced with financial goals. Using Sessions, conversion rate, and average order value, agencies back-calculate the Sessions needed to hit specific revenue targets. This results in highly tailored, goal-oriented plans with a better chance of success.
While the Sessions metric provides a bird's-eye view of user engagement, more granular insights are often needed for a nuanced understanding. For example, segmenting Sessions by traffic source or device allows agencies to identify which marketing channels are most effective in driving high-quality traffic.
Additionally, breaking down Sessions by user demographics like age or location offers valuable perspectives on audience behavior. These granular views become a pivot point for adjusting marketing tactics, enabling a more agile and responsive strategy.
Why Sessions Matter to Clients
Sessions are a magnifying glass on the effectiveness of a company’s online presence. This metric illuminates how many users visit a website or application, providing a temperature check on potential customer engagement.
Clients are particularly interested in new Sessions, as these typically indicate growing interest, and these user visits could lead to conversions down the road. Additionally, tracking a user's actions within an existing Session, such as adding items to their shopping cart, helps gauge what's grabbing attention and what's not, which is vital for refining everything from product offerings to website UX.
Why Agencies Report on Sessions
Agencies don't just count Sessions; they dissect them to extract actionable insights for optimizing digital campaigns. The data provides a detailed view of how users interact with a web application, from the pages they visit during the same session to the actions they take. Agencies gain valuable knowledge about engagement levels by identifying patterns or anomalies in new versus returning Sessions.
Sessions also offer agencies a unique opportunity to understand the micro-behaviors that signal a user's intent. For instance, examining the activities within a single Session can reveal whether a user is a window-shopper or ready for conversion. By correlating these micro-behaviors with other metrics, agencies pinpoint the exact levers to pull to enhance the effectiveness of a digital campaign.

Win Back Billable Hours by Automating Your Client Reporting
Best Practices When Analyzing and Reporting on Sessions
Analyzing Sessions provides critical insights that lay the foundation for effective digital marketing campaigns. Reporting Session data effectively means providing context, offering clear visuals, and aligning with client goals.
Assess Patterns
Understanding how Sessions change over time helps identify seasonality effects, high-traffic days, or overall growth trends. This information, gleaned from Google Analytics Sessions, enables data-driven adjustments to marketing campaigns.
Understand Session Sources
A breakdown of Sessions by channel and campaign offers insights into the most effective platforms for driving user visits. For example, comparing web Sessions from organic search versus social media reveals the channels contributing most to visits and engagement.
Identifying Trends and Outliers
Regularly examining Session data helps spot trends and anomalies in user behavior. For instance, a sudden spike in new Sessions might indicate that a specific marketing campaign is resonating, while a sudden drop could point to issues requiring immediate attention.
Provide Visual Clarity
Visual representations turn complex data into accessible insights. Charts or graphs of Session activity offer a straightforward view of the campaign’s trajectory, enabling clients to quickly grasp where the campaign excels and where it falters.
Contextualize Session Metrics
Understanding the value of a new Session becomes more evident when viewed alongside other relevant metrics. For example, web Sessions make more sense when combined with user interactions such as Time on Page, Conversion Rates, and Engagement Rates.
Align With Client Goals
Sessions aren't just numbers but pathways to achieve objectives. Analysis should include how each Session–and the user interactions within it–contribute to client goals. Whether the goal is to increase conversions or extend the average Session time, framing the data in this way offers clients a clearer understanding of their ROI.
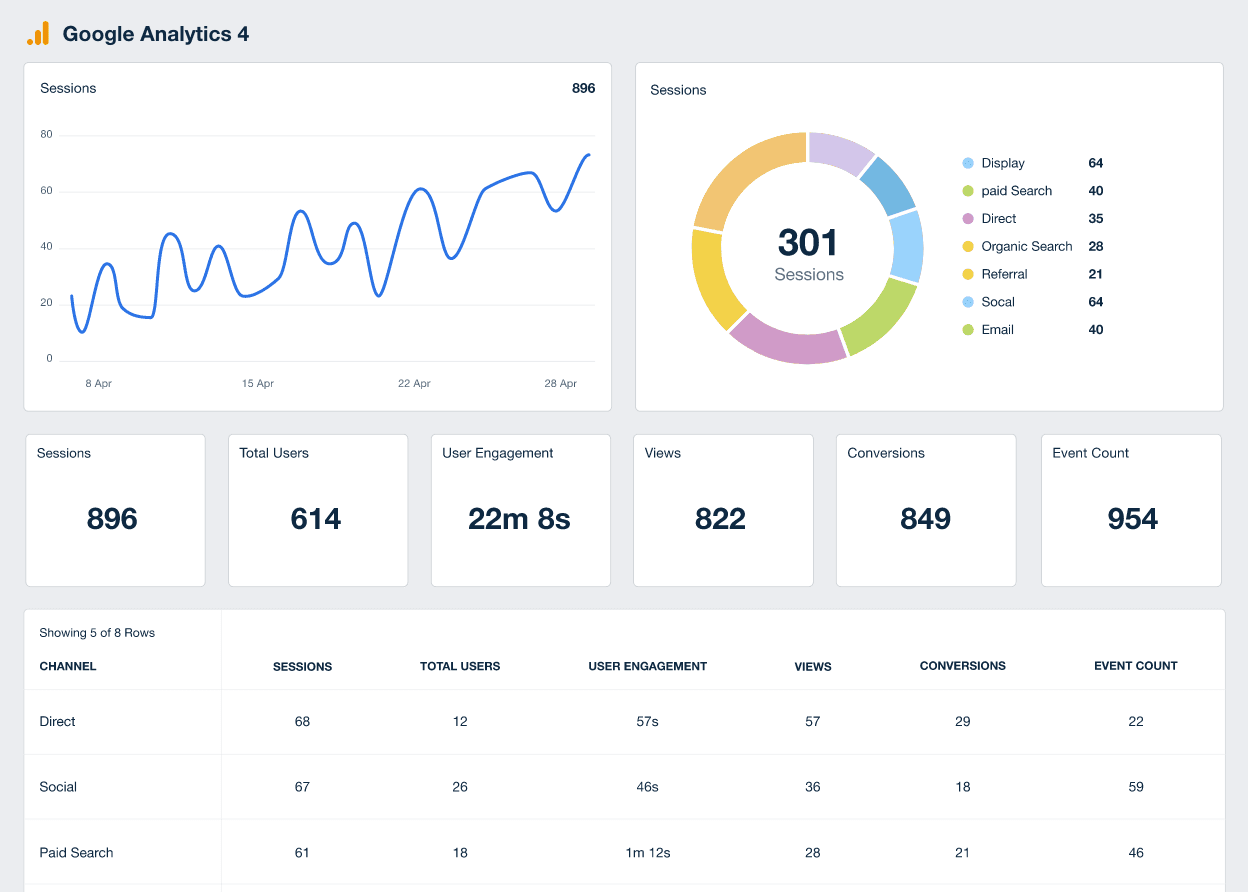
Google Analytics 4 Dashboard Example
Related Integrations
How To Drive More Web Sessions
Improving Session metrics are a powerful lever for campaign success. Here are three actionable tips to fine-tune Session performance and make every visit count.
Optimize Site Speed
A fast-loading webpage keeps visitors from leaving before the Session begins. A one-second delay in load time has the potential to lead to a significant drop in engagement and conversions. Trim down heavy media files and clean up the code.
Prioritize Demand Generation
Effective engagement on social media–coupled with sharp PPC and SEO practices–draws in a diverse crowd and encourages them to return. Both strategies serve as cornerstones for sustaining and increasing Session numbers.
Analyze and Fine-Tune
Constant monitoring of Session data helps agencies understand what keeps visitors engaged. Adapt strategies based on these insights to encourage more frequent visits and, consequently, more Sessions.
Related Blog Posts
See how 7,000+ marketing agencies help clients win
Free 14-day trial. No credit card required.


