Table of Contents
QUICK SUMMARY:
Build better client relationships with a data analytics dashboard that shows exactly what’s working. This guide walks through how to create customizable dashboards that save time, reduce manual reporting, and turn complex metrics into clear, actionable insights. Includes real examples and agency-tested tips to get started fast.
As your agency evolves, you’ll need to invest in the right analytics tools to remain agile and efficient–that’s where dashboards come in.
After clients have signed on with your agency, they need the reassurance that you’re capable of delivering results. Sure, relying on outdated methods (like copying and pasting screenshots into spreadsheets) may get you by in the early days.
However, it isn’t a sustainable approach to reporting. Think about it–you’ll need access to your clients’ real-time campaign performance to ensure things are going according to plan. Plus, relying on manual reporting methods increases the chances of human error (not to mention it’s a complete pain when you’ve got multiple monthly reports to do).
A marketing dashboard is a great fix for many of these issues. It visually presents your clients' data—from digital marketing analytics to video marketing analytics—and cuts down on all that laborious work.
This gives your agency more time to focus on what matters: delivering exceptional results and building trust.
What is a data analytics dashboard?
A data analytics dashboard isn’t a nice-to-have for a marketing agency–it’s a necessity. Simply put, this handy tool works by:
Creating visual representations from your clients’ real-time marketing data for ease of understanding
Consolidating key metrics across multiple data sources into one interface
Presenting real-time and historical data points; a must-have for making strategic decisions and performing data analysis
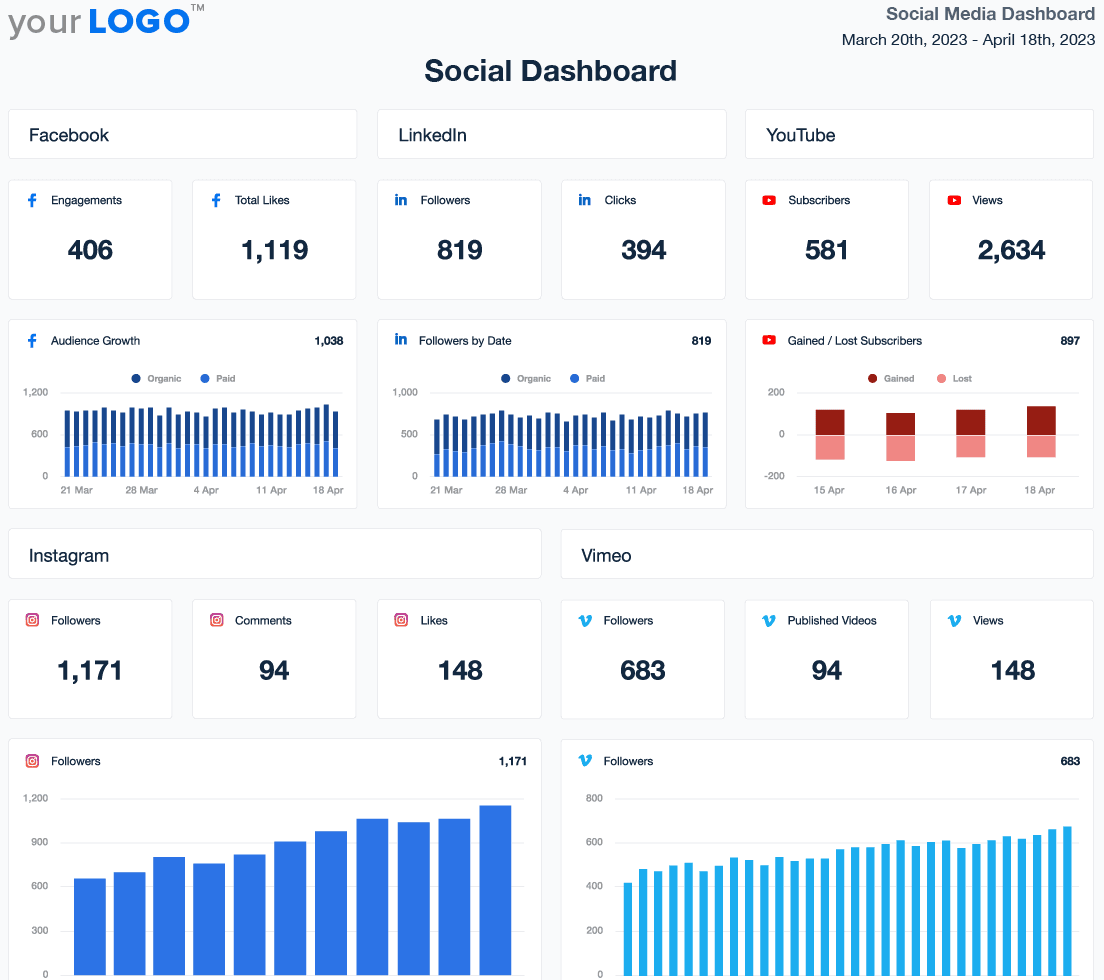
To give you a practical example of what it looks like, take a look at this social media dashboard below.
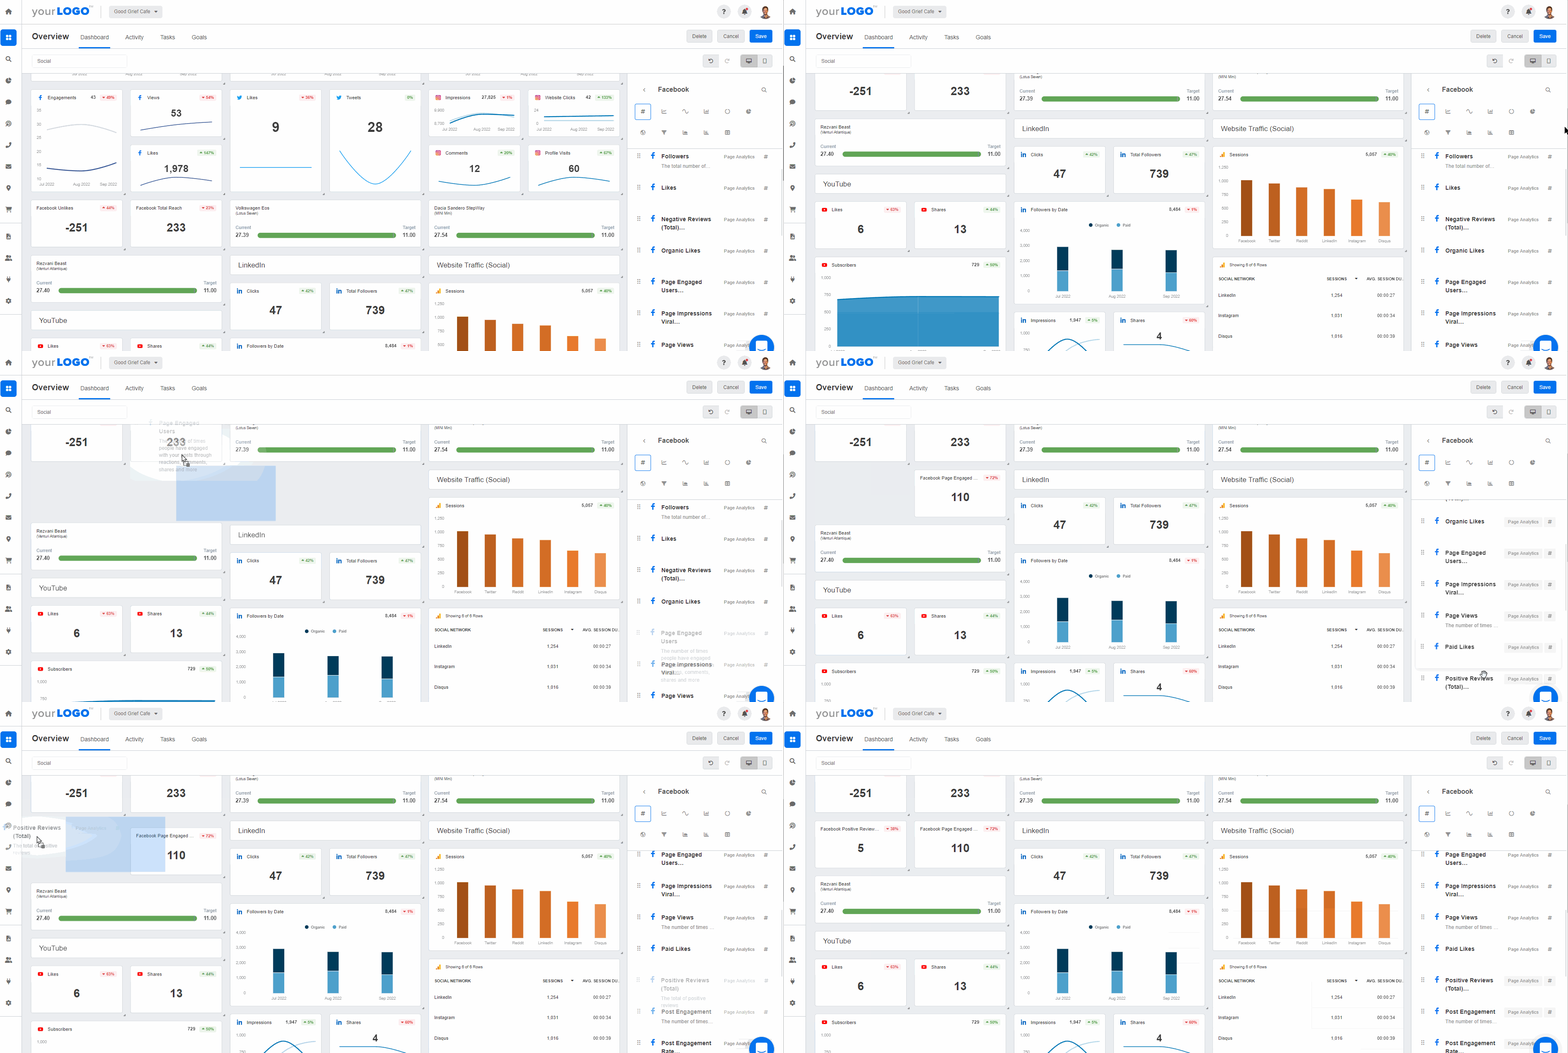
Stream your clients’ metrics into marketing dashboards and present actionable insights to your clients. Try this exact social media dashboard on AgencyAnalytics–it’s free when you sign up for a 14-day trial.
Why your campaigns deserve a data analytics dashboard
There are more than a few reasons why your marketing agency should use an analytics dashboard–let’s explore further.
1. Helps you make data-informed recommendations
Your agency needs data to guide clients in the right direction. Anything else is just a shot in the dark. An analytics dashboard heavily aligns with the APIE method (Assess, Plan, Implement, Evaluate).
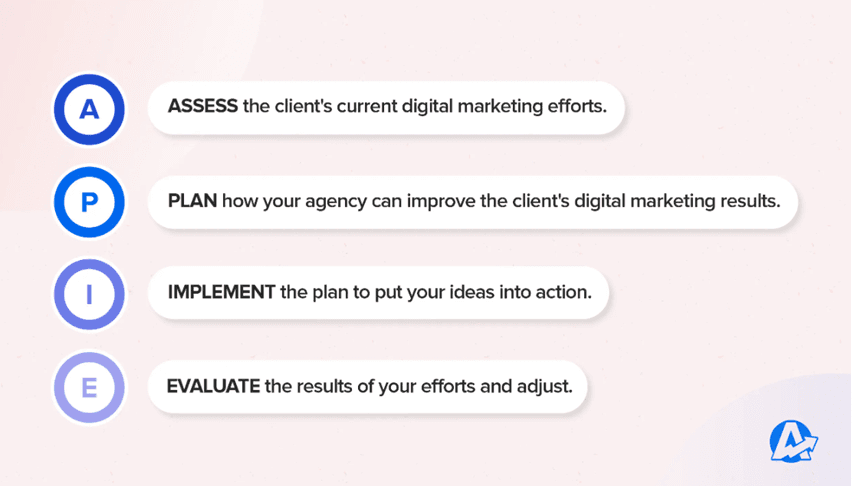
To contextualize this further, let’s take an example. Say you’ve built an SEO dashboard, and your client has a goal of achieving 1,000 website conversions per month.
An analytics dashboard will help you to:
Assess your client’s Google Analytics 4 metrics (such as conversion rates, organic traffic sources for various web pages, and top-performing keywords on search engines). It’s also easy to include other metrics side-by-side (e.g., related social media analytics)
Create a plan of action to improve marketing results if necessary (e.g., adding more CTA buttons to increase conversions and improve SEO metrics)
Implement this plan of action, giving enough time to generate results (e.g., running this revised SEO strategy for two months and monitoring Google Analytics metrics)
Evaluate whether these changes have resulted in the desired results (and revisit the APIE method as needed)
2. Improves client retention by demonstrating your capabilities
It’s often more cost-effective to retain existing clients than to search for new ones. That’s because attracting new clients usually involves ongoing financial investment (e.g., paid advertising) and is resource-intensive.
On the other hand, you’ve already got a history with existing clients. Over time, you’ve developed a rapport and understand their businesses on a deeper level. That means there are more opportunities to upsell clients since you’ll be able to identify additional services that align with their current goals.
When we're able to more clearly show a client their data, we improve client retention. Our clients are very anxious to spend money. Being able to show the progress we're making is vital to earning our client's trust and retaining their business. That is more valuable than the specific billable time, given our unique niche.
Jessica Tappana, Owner, Simplified SEO Consulting
However (unsurprisingly), it goes beyond saying, “Hey, remember to renew your monthly agency contract–your marketing numbers are through the roof!” You’ll need a solid way to show results, which is where analytics dashboards come in.
Data doesn’t lie, and using an analytics dashboard is an unbiased way to prove your agency’s capabilities. It sets a consistently high standard and lets your clients know what to expect from your agency.
The result? Increased client retention, more predictable recurring revenue, and enhanced agency-client relationships.
3. Effective data visualization
What’s easier to understand–a visual pie chart or a boring pile of numbers?
Data on its own is just that–numbers on paper (or a screen, if we’re being more specific). Data visualization, however, allows you to interpret what the numbers are saying at first glance.
To get the most from AgencyAnalytics, use visualization like charts, graphs, and tables to help clients quickly and easily understand the performance of their campaigns. Remember to provide context and explanations for the data presented, so clients can understand what it means and how it relates to their business goals.
Daniel Dye, President, Native Rank
It’s essential for clients who are (or report to) senior management executives. They have busy schedules and need a quick way to interpret all the metrics you’re presenting.
In this scenario, analytics dashboards present data compellingly while demonstrating your agency’s professionalism.
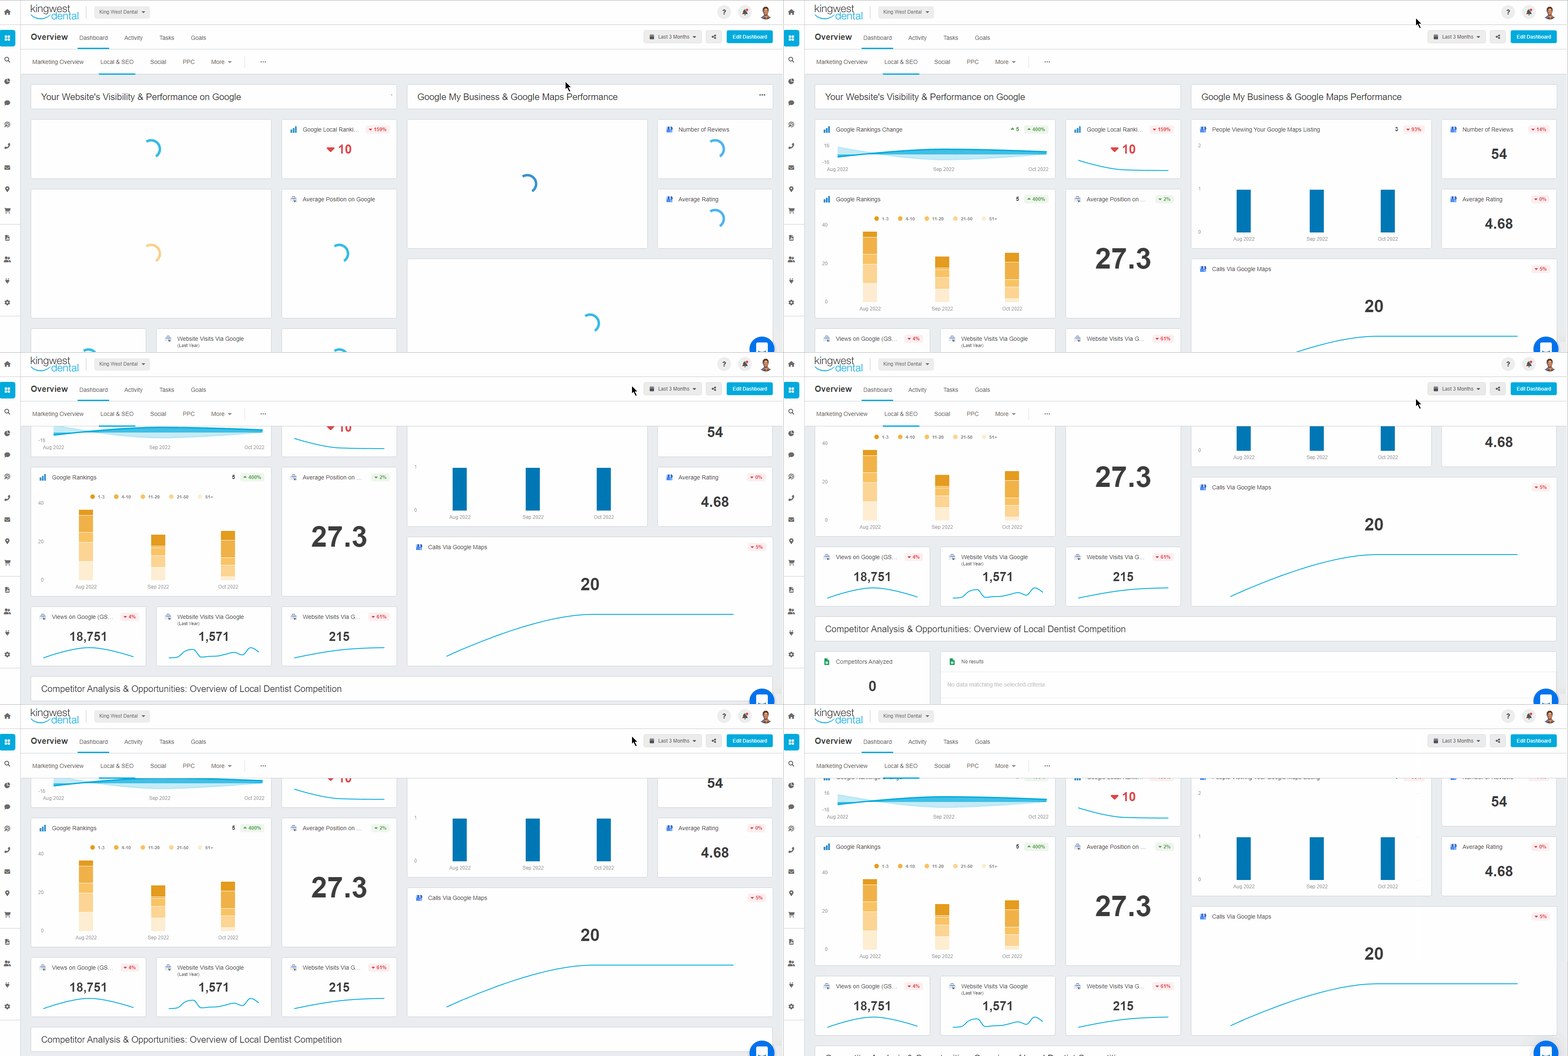
Bring numbers to life with visual, data-driven dashboards. Set your agency apart from the competition and upgrade your client reporting experience–try AgencyAnalytics today, free for 14 days.
4. Consolidates metrics across multiple data sources
Think of how much time it takes to open a million browser tabs and log into each of your clients’ marketing platforms.
If that isn’t painstaking enough, imagine copying and pasting those important metrics into Google Sheets or slide decks. That’s the icing on top of a not-so-great cake.
We used to take screenshots on platforms like Google Analytics, Google Ads, and Facebook. Then, we’d add the screenshots to a PowerPoint with comments. This process was really slow, and there were massive differences from one person’s screenshots to the next. Using AgencyAnalytics has since allowed us to streamline our process and improve the consistency of our reporting.
Claire Daniels, CEO, Trio Media
Luckily, a Google Data Studio alternative like AgencyAnalytics was made specifically for agency needs. This client reporting tool integrates data across 80 marketing platforms into one dashboard.
You won’t have to worry about overload from importing multiple data sets, either. AgencyAnalytics is built to handle that bandwidth and seamlessly retrieve your clients’ data points.
That means less time on mind-boggling manual reporting and more time to focus on your agency’s operations.
5. Boosts transparency and builds agency-client trust
After a client has invested in your agency’s services, one thing is certain–they need to see ROI. Dashboards shine here since they demonstrate what you’ve worked on and reiterate your agency’s ability to achieve results.
Remember, transparency isn't just important when things are going well. Even when a campaign isn't performing as you had intended, transparency is still key.
In fact, reporting honestly on progress without resorting to misleading data representations builds trust and reassures clients that you're going to keep iterating on new solutions until you achieve the desired outcome.
To get started, consider:
Granting login access to live dashboards, which allows clients to keep an eye on marketing performance 24/7, allowing users to make data-driven decisions at their own pace (while cutting down on time-consuming follow-ups)
We want to be totally transparent with our clients, and AgencyAnalytics allows us to provide our clients with a live analytics dashboard where they can have full insight into what we're doing without needing to give full access to the ad platforms where they would have the potential to interfere with performance.
Michael Wisby, CEO, Two Trees PPC
Using analytics dashboards as live presentation tools during 1:1 meetings. While this is an often overlooked AgencyAnalytics feature, it’s pretty useful!
We show a live demo of our 'always on' dashboard and a copy of our monthly reporting. That means transparency isn’t just a buzzword. It shows that we don't hide behind anything or try to manipulate the numbers–what you see is what you get.
Kate Thompson, Digital Strategist, Squidgy
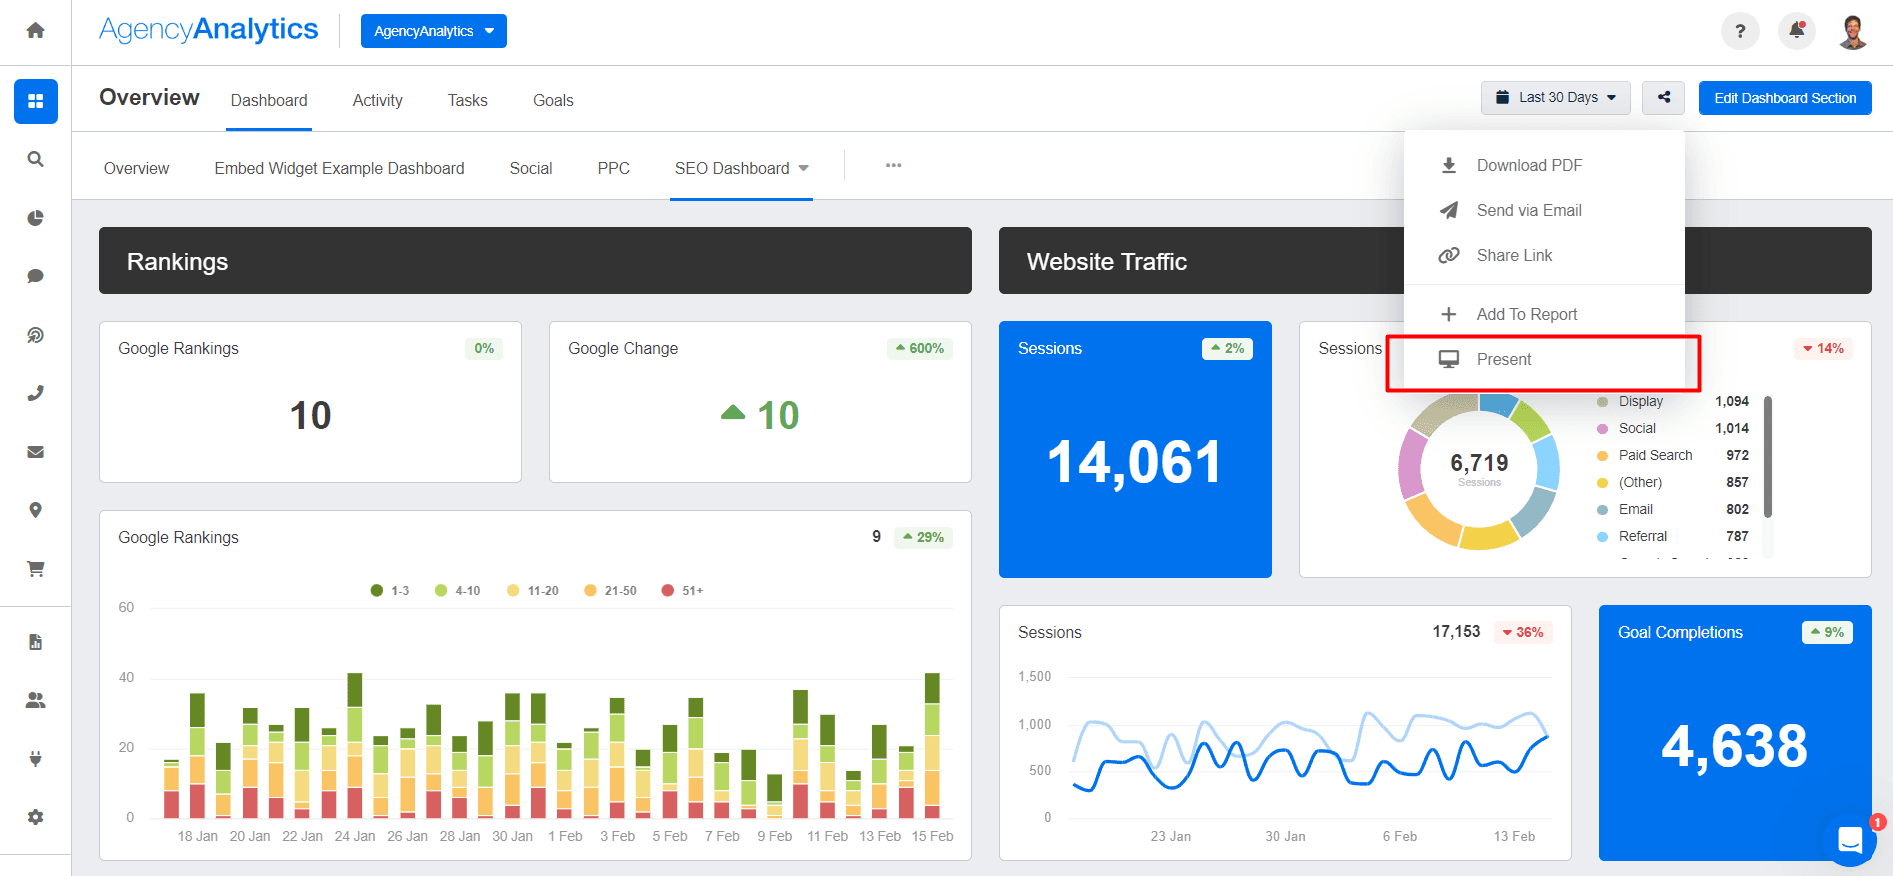
Transform 1:1 agency-client meetings by using a dashboard as a live presentation tool. Say bye-bye to boring slide decks and hello to dynamic presentations with real-time, meaningful insights. Try it on AgencyAnalytics, it’s free for 14 days.
6. Ease of replication
When you’re onboarding new clients, replicating dashboards allows you to borrow an existing setup that’s proven effective and customize as necessary. Rather than starting with a completely blank canvas and creating a new dashboard from scratch, you have the option to save time and move on to other important onboarding tasks.
With a platform like AgencyAnalytics, it’s easy to duplicate a dashboard at the click of a button. If you need to make tweaks or changes, simply customize your analytics dashboard as required (e.g., perhaps you want to add one or more widgets or interactive elements, or remove a few).
Replicate a pre-built marketing template or make a copy of a custom dashboard–you’ve got options, whether building different dashboards for different goals or duplicating a single format.
The ability to duplicate templates makes getting a client set up with monthly reports incredibly quick. Beyond that, we love how easy it is to customize the report. Not every client wants a templated approach. Our clients that have asked for custom reports are very pleased with them. That’s probably our favorite feature of the platform.
Jessica Weiss, Director of Marketing & Strategic Partnerships, One Firefly
How to build an analytics dashboard with AgencyAnalytics
Reporting doesn’t have to be a drain on your agency's resources. Try easy-to-use dashboard reporting software that streamlines your workflow. To help you create the perfect analytics dashboard, here are some actionable tips to follow.
1. Align your client’s marketing metrics with overall business goals
Before going straight into dashboard mode, create a proper foundation by understanding your client’s business goals.
After all, you don’t want to create a shiny marketing dashboard that looks good on the surface but doesn’t reflect what’s most important.
To get started, have a 1:1 discussion with your client and ask key questions like:
What are your overall goals in working with our agency (e.g., any specific key performance indicators you want to achieve, such as customer lifetime value or average order value)?
Do you have any timelines or deadlines for achieving these goals?
Have you encountered any challenges that have affected your goal progress?
Are there specific marketing channels you’d like to focus on?
After getting enough details, develop a marketing strategy that aligns with the client’s business objectives. For example, a client who wants to increase online sales may have a marketing goal of 1,000 Google Ads conversions per month.
On the other hand, a client with an aggressive sales target may benefit from a goal, like 5,000 website form sign-ups per quarter. Whatever the case, create specific marketing targets and ensure everyone is on the same page.
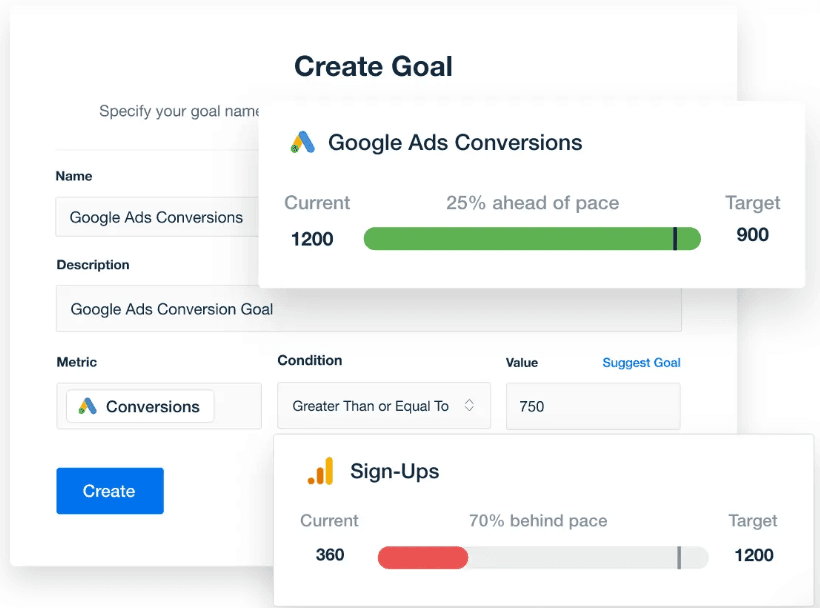
Use dynamic goal-tracking to monitor progress and ensure campaigns are running smoothly. Create a dashboard with custom goals on AgencyAnalytics–sign up for your free 14-day trial today.
2. Decide on data sources for your analytics dashboard
Now that you’ve got an idea of how to create dashboards, it’s time to populate them with your clients’ relevant data points.
Before AgencyAnalytics, we faced challenges consolidating data from various marketing channels and platforms. This often led to data silos and made it difficult to get a holistic view of our clients' performance. Now, we can centralize all the data in one place, enabling us to track and analyze campaign results across different channels easily.
Jessica Crist, Production Manager, High Five Media
It's important to take time to understand what data points your clients care about, and one of the easiest ways to accomplish this is by simply asking them.
This discovery helps inform what kind of analytics dashboard you need to create for specific clients, such as:
etc.
Browse the collection of customizable dashboard templates designed to meet all your agency and client reporting needs.
How to set up integrations with AgencyAnalytics
Here’s a quick step-by-step guide on how to set up dashboard integrations on AgencyAnalytics:
Sign in to your AgencyAnalytics account and go to ‘Integrations’ on the left-hand menu
Choose your desired integration and click on ‘Connect’
Grant platform authorization and check for a successful connection (which will be indicated by a green checkmark, like the example below)

With over 80 marketing integrations, AgencyAnalytics automates data retrieval and streamlines the entire reporting process. Filter your clients’ metrics into eye-catching dashboards–try it free for 14 days.
3. Define your audience and their experience level
Here’s an important question to consider: Who’s my dashboard’s audience?
For example, a dashboard created for experienced finance executives may go into the nitty-gritty of sales revenue metrics and conversion rates. On the other hand, a client with limited marketing experience may need a more simplified dashboard without excessive data points or extra jazz.
It all boils down to your client’s experience level and what type of information they’d most benefit from seeing. If you’re concerned about information overload, remember that you can always set user permissions to control precisely what’s shared.
Larger clients are usually more knowledgeable in accessing digital marketing platforms, and they love having access 24/7 to review data. With AgencyAnalytics, our clients get to do just that by accessing their dashboard at any time.
Brad Fogel, CEO, Operation Technology
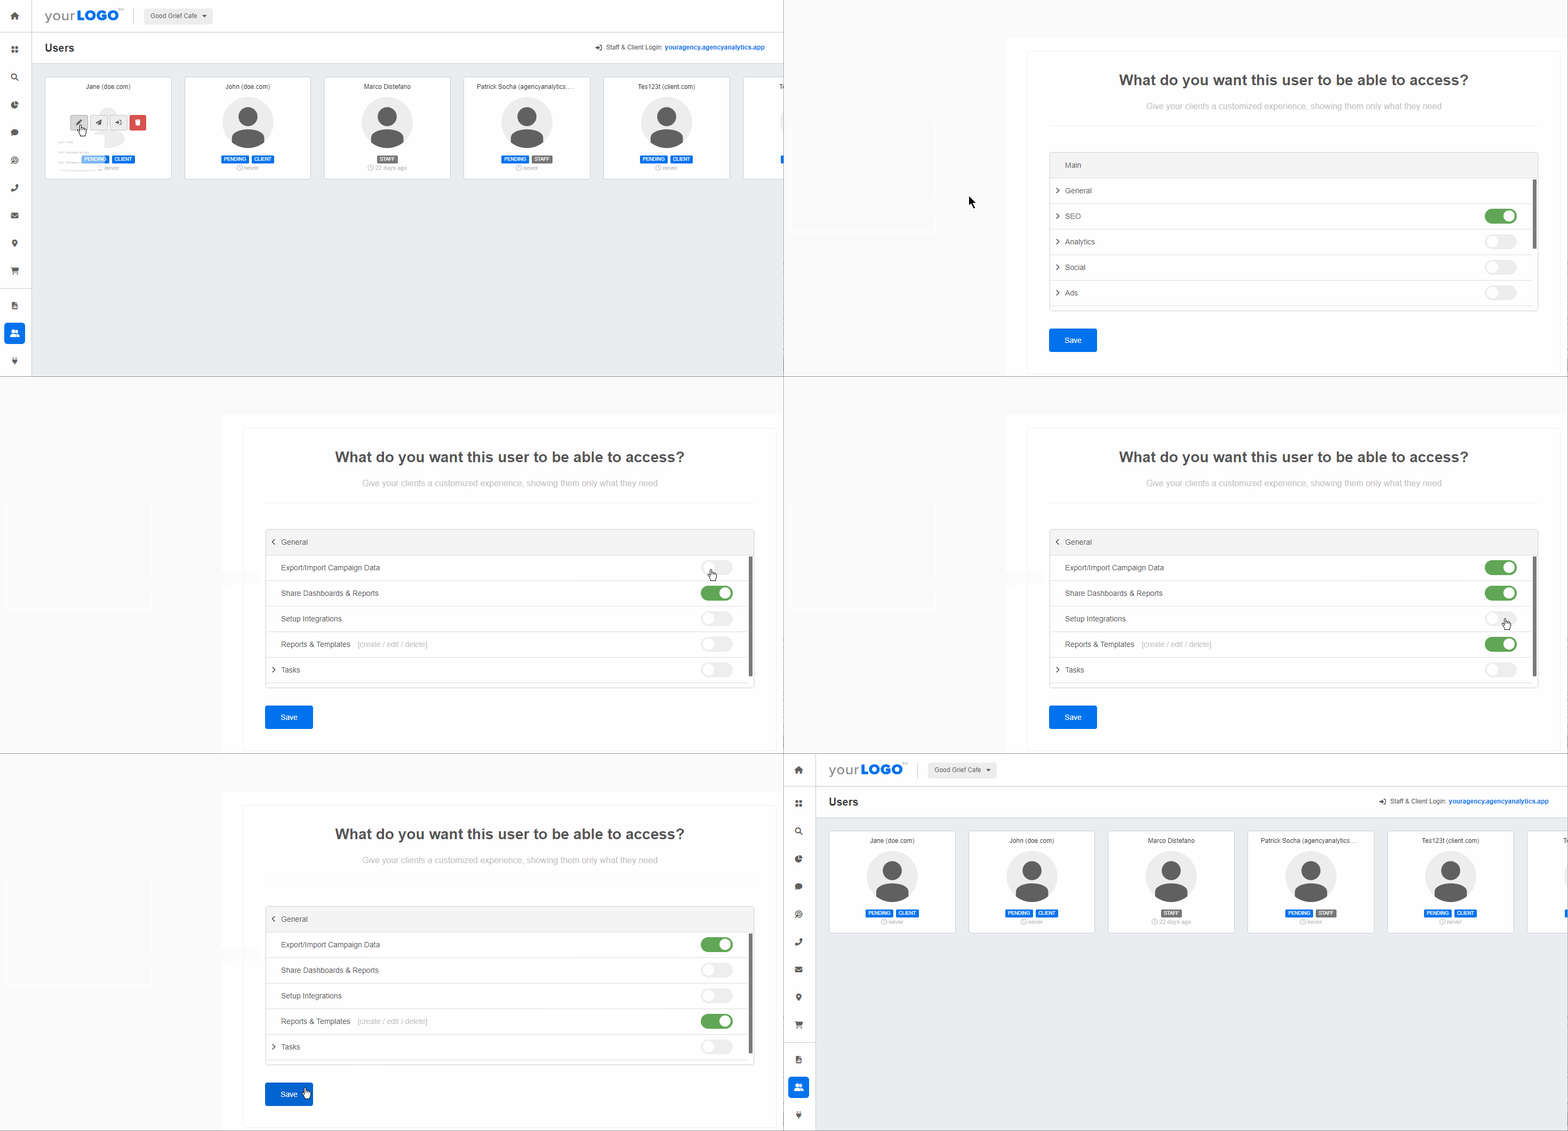
Control what information is presented on client dashboards to avoid data overwhelm or sharing irrelevant information. Create custom user permissions on AgencyAnalytics–try it today, free for 14 days.
4. Choose an appropriate data visualization
With AgencyAnalytics, your clients’ metrics are automatically streamed into intuitive data visualizations. Even so, perhaps you want to choose another format (e.g., going with a line chart instead of a bar chart).
All you have to do is:
Head to your dashboard and click the ‘Edit’ button on any widget
Choose your desired data visual, such as:
Line charts
Bar charts
Pie charts
Area charts
Sparklines
That’s it! No rocket science or runarounds–just an analytics platform that’s straightforward and easy to use.
AgencyAnalytics’ data visualization tools have helped our clients better understand their marketing performance. The graphs, charts, and tables provided make complex data digestible and actionable for our clients.
Jessica Crist, Production Manager, High Five Media
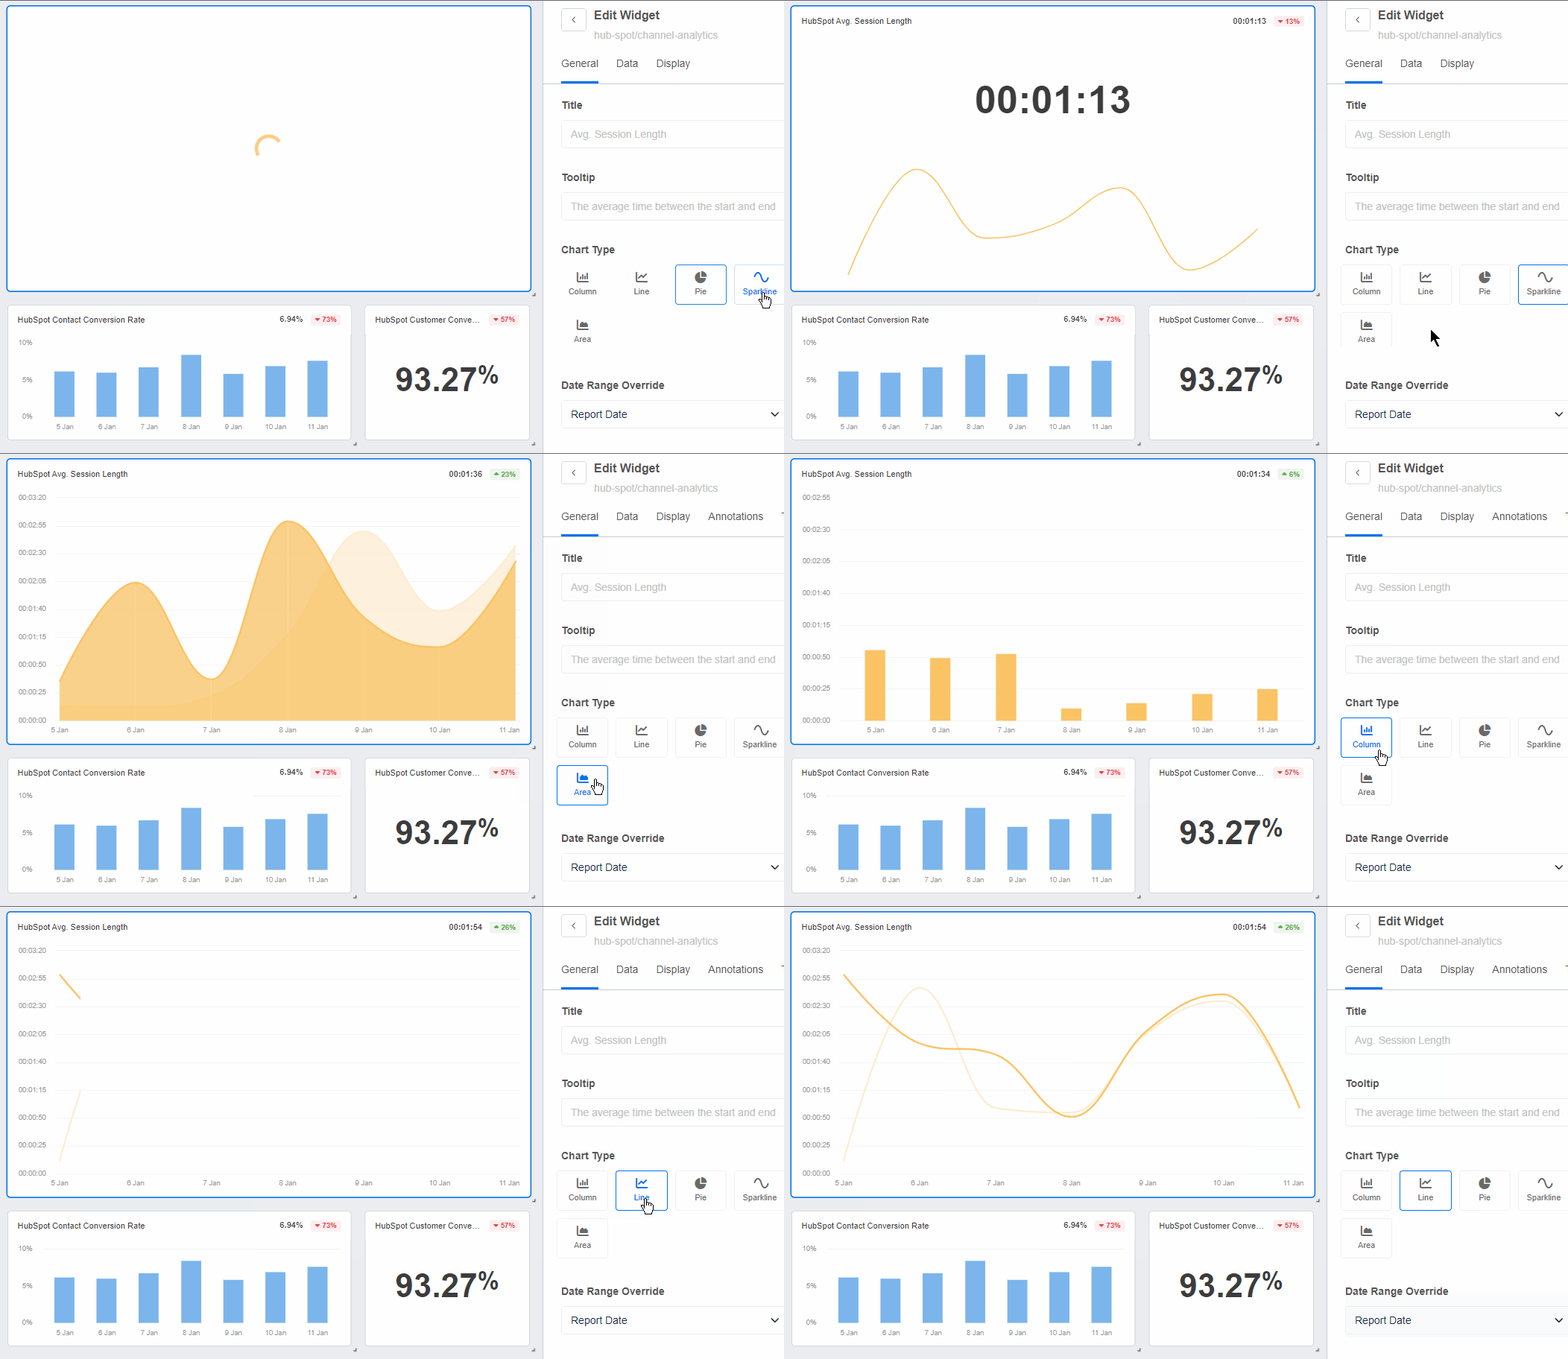
Choose the visual that best represents your clients’ marketing metrics. Help your clients make informed decisions by using easy-to-understand dashboards–it’s free for 14 days on AgencyAnalytics.
5. Add customization to enhance client reporting
Nothing beats customization, especially when it comes to client reporting. Go the extra mile by:
Adding annotations to your clients’ dashboards, which provide further context or explanations
Including an executive summary at the very top of your client’s dashboard with an overview of the key takeaways
Embedding a video with an explanation of your client’s dashboard and marketing results for that extra touch of personalization (e.g., you may need to explain complex Google Analytics data)
My clients are not overly technical, and I've decided that simply providing access to their dashboard isn’t an effective way to monitor progress. Instead, I send them their customized dashboard along with a Loom video discussing the highlights.
Kelly Fitzgerald, Founder, Savvy Marketing Services
Creating custom metrics that reflect your clients’ unique goals (e.g., calculating the total number of conversions across multiple digital marketing efforts)
Creating custom-tailored digital marketing dashboards that fit your clients’ exact goals.
Agency Pro Tip: Explore how AI tools transforming data analysis can further streamline the reporting process.
4 examples of analytics dashboards
Every client has different priorities, but one thing they all want is clarity. Dashboards help agencies turn raw data into clear, actionable insights in just a few clicks.
Each dashboard below is built to save time, surface insights, and show clients exactly what’s working. Use them as-is or customize to match each client’s goals.
1. Web analytics dashboard
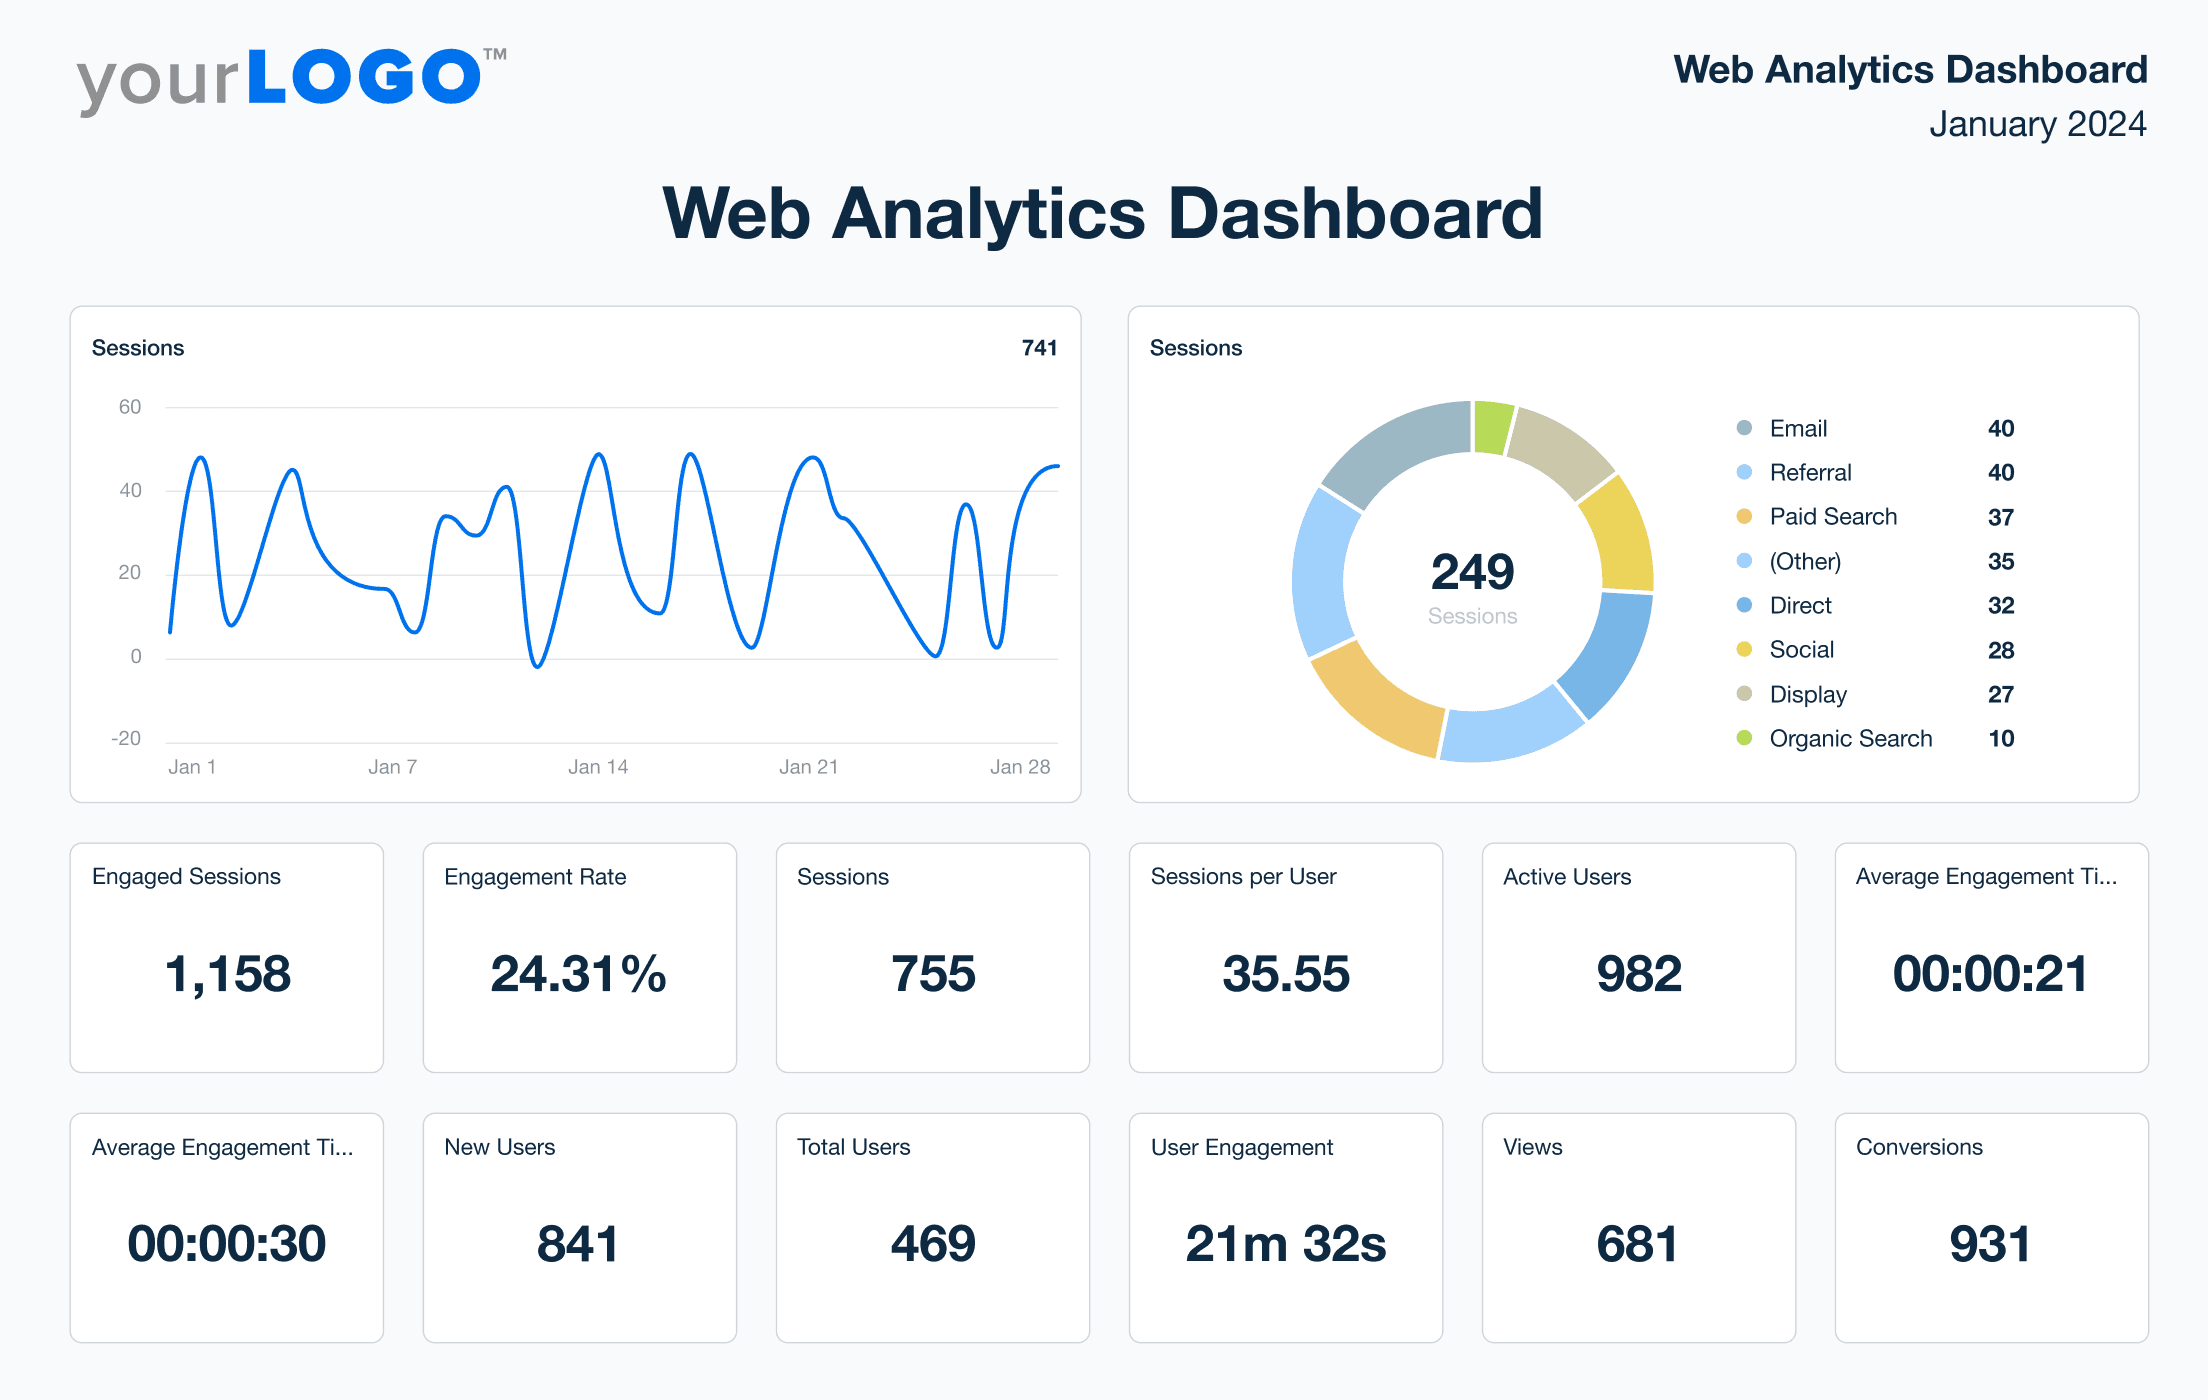
Track key site metrics like traffic sources, bounce rates, goal completions, active users, and new users—all in one place. This web analytics dashboard pulls directly from GA4 and Matomo, making it easy to see how users interact with a client’s site, including how many pages they view per session.
2. Digital marketing dashboard
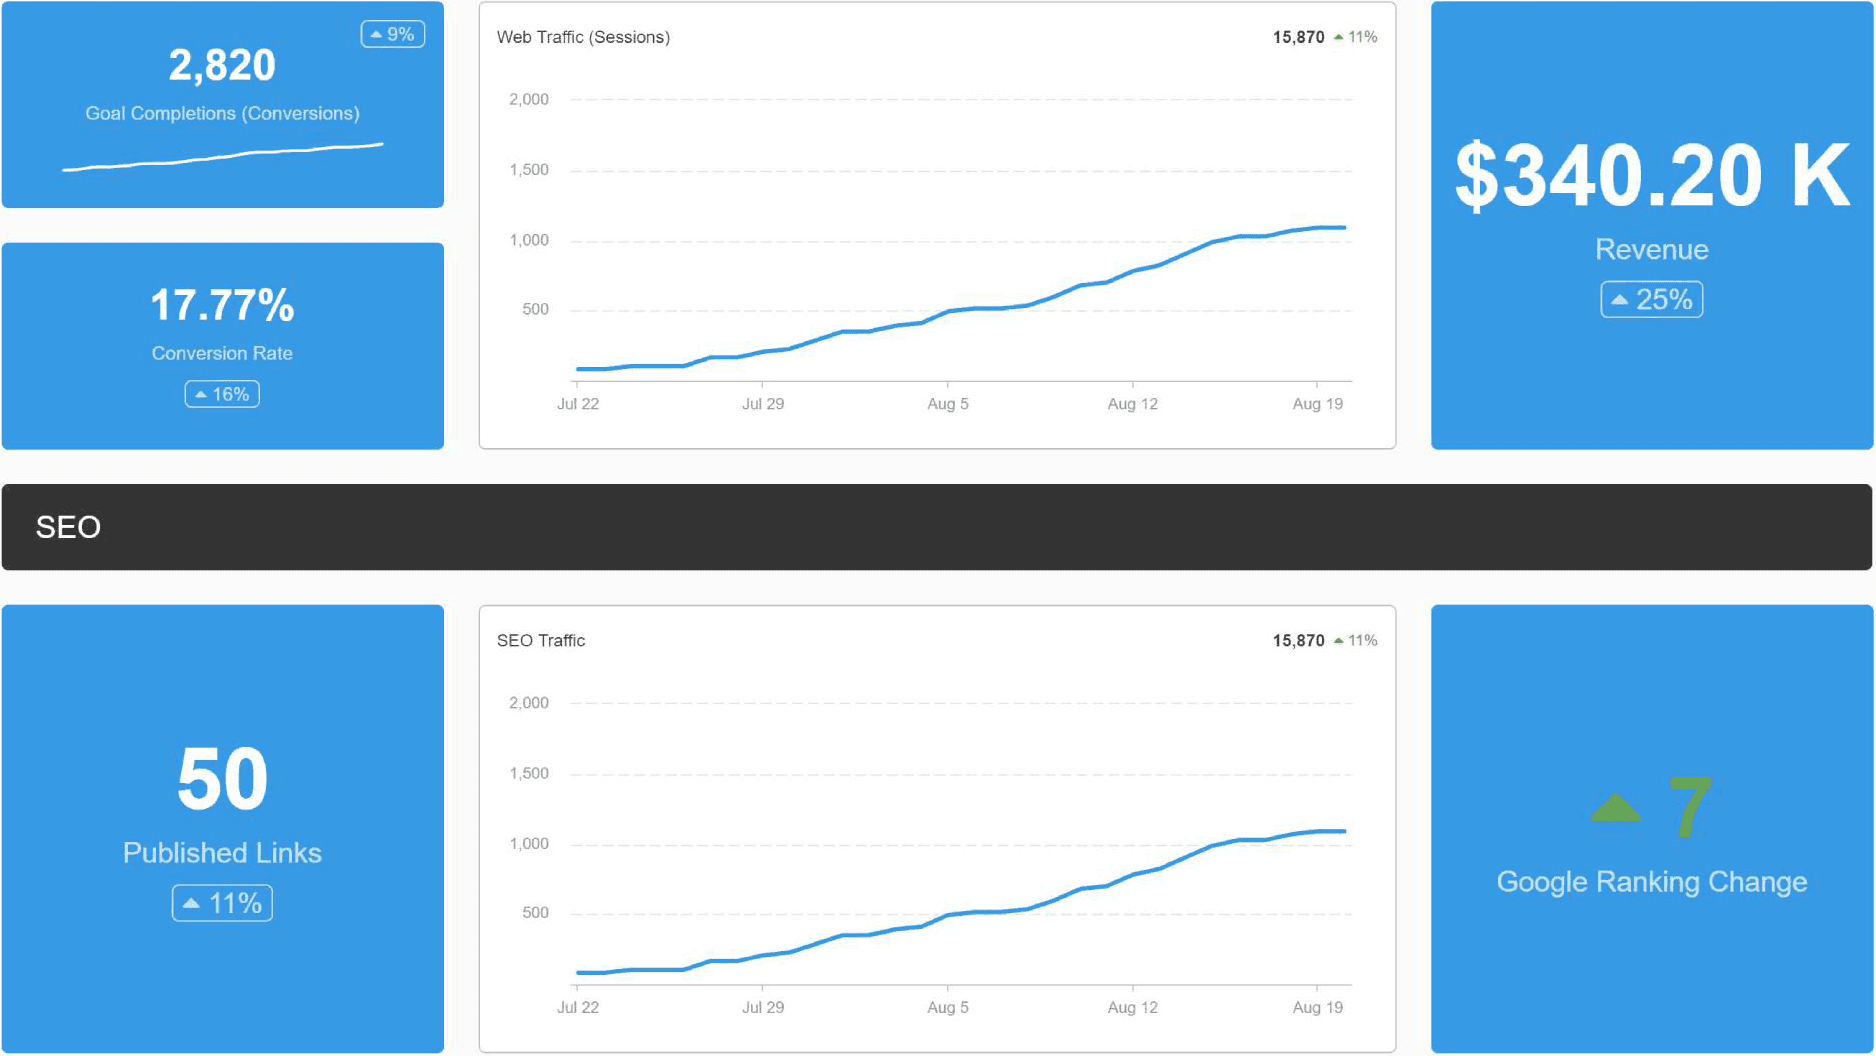
A digital marketing dashboard lets you monitor campaign performance across SEO, PPC, social media, and email in one dashboard. This template pulls from Google Ads, Facebook Ads, Google Analytics, and more, making it perfect for high-level campaign reporting.
3. SEO dashboard
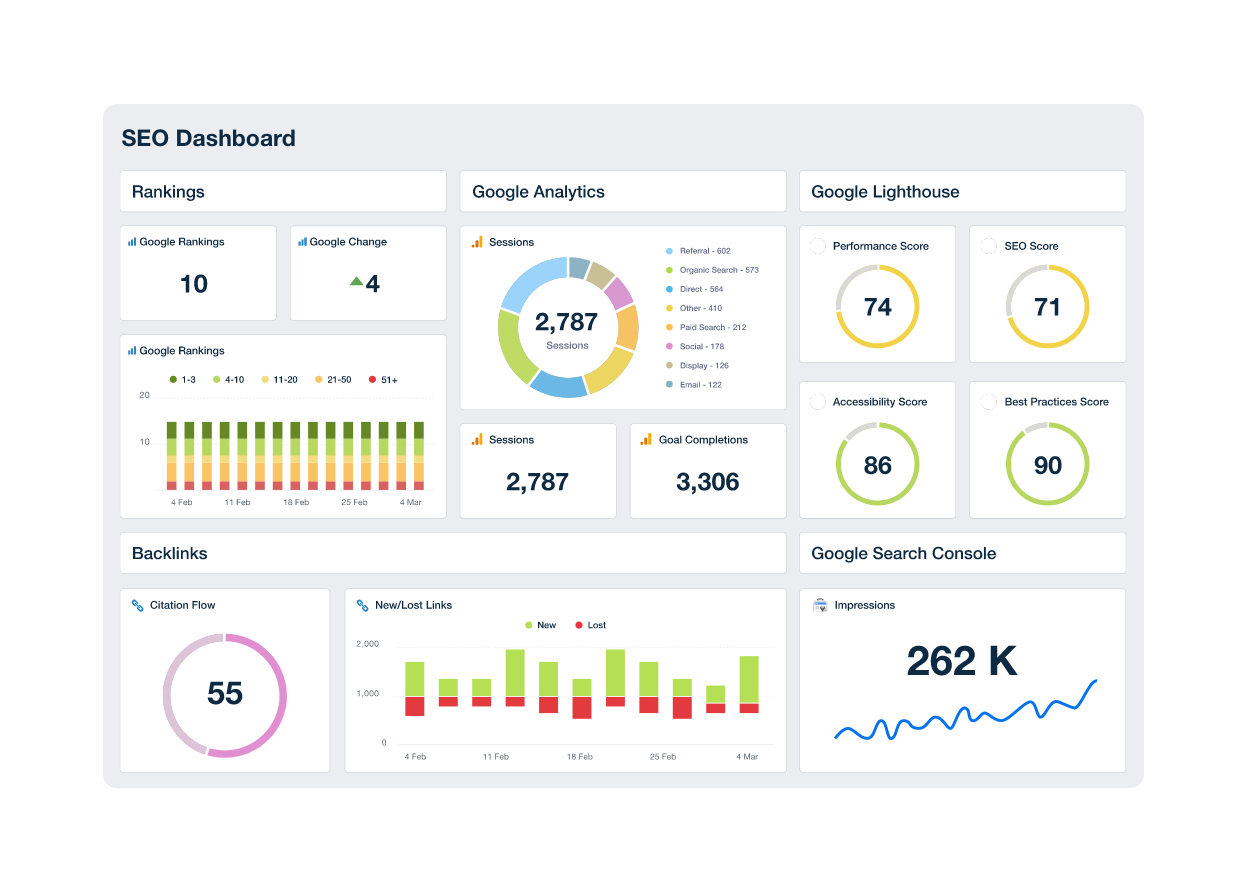
An SEO dashboard helps agencies track SEO analytics in real time, from rankings to backlinks and site health. It includes keyword movement, technical audit results, and organic traffic trends.
4. Social media dashboard
A social media dashboard helps you see performance across platforms—Facebook, Instagram, LinkedIn, YouTube—all in one view. This dashboard shows reach, engagement, follower growth, and top content for each channel.
Go beyond marketing data analytics
The importance of using a business analytics dashboard cannot be overstated. As we’ve outlined, they help your agency extract useful insights from a sea of information, paving the way for strategic and agile decision-making.
All reporting solutions aren’t equal, though. Even among the best analytics platforms, modern dashboards vary widely in features. While there are many marketing analytics tools out there, you need one built for your unique needs.
That’s where AgencyAnalytics comes in. Built specifically for marketing agencies, this client reporting tool offers:
Pre-built, platform-specific dashboards (like Google Analytics, Facebook, and LinkedIn to name a few)
Pre-built dashboards with a broader scope (e.g., a comprehensive digital marketing dashboard)
A dashboard builder (if you want to create one from scratch)
Other agency-centric features (like white labeling, client and staff login profiles, predictive analytics, and more!)
Streamline your agency’s reporting, put billable hours back into your busy days, and improve the customer experience while helping your agency drive growth. Try the client reporting tool used by over 7,000 agencies and counting–sign up for your free 14-day trial today.

Written by
Faryal Khan is a multidisciplinary creative with 10+ years of experience in marketing and communications. Drawing on her background in statistics and psychology, she fuses storytelling with data to craft narratives that both inform and inspire.
Read more posts by Faryal KhanSee how 7,000+ marketing agencies help clients win
Free 14-day trial. No credit card required.


