Table of Contents
It’s a given–data visualization is the bridge between raw data and making logical sense of marketing performance. In its absence, you’re stuck with a heap of numbers, confused facial expressions from your clients, and wasted potential.
But while data visualization is one thing, accurate data visualization is another. Sure–it’s easy to click “Create Pie Chart” on Excel (if you’re relying on an outdated manual reporting method). But does it actually do your clients’ data justice or reflect what’s happening meaningfully?
Poor data visualization has consequences for your clients and agency. The last thing you want is a compromised reputation or steering your clients in the wrong direction.
Accuracy aside, there’s another dilemma that agencies often face. What if you chose an appropriate data visualization, but the results are sub-par or way off target? It’s tempting to conveniently omit that questionable-looking pie chart or specifically pick a few marketing metrics to visualize.
What your clients don’t know won’t hurt them, right? Not quite.
We are big believers in transparency, and our clients find this approach very refreshing. We’ll never bend the truth or cover up a mistake–we’re human, after all–and we’ll work twice as hard to get the results we promised. This unique approach is one of the main reasons many of our clients have increased their retainers and recommended us to other business owners.
–Claire Aldridge, Digital Marketing Specialist at Victory Digital
If you’re ready to safeguard your agency and clients from the perils of bad data visualizations, read on to learn about:
How Misleading Data Visualization Is a Threat to Your Agency
5 Types of Misleading Data Visualizations To Avoid (With Examples)
What Is Data Visualization?
Generally speaking, data visualization refers to visual representations of your clients’ marketing metrics.
From pie charts to bar graphs, relevant data visualization:
Creates a data-driven narrative to understand the big picture better
Clearly illustrates any upticks or dips in marketing performance, in addition to pinpointing historical trends over time
Gives your agency powerful insights to make informed recommendations
Arguably, accurate data visualization is one of the most powerful tools to drive your clients to marketing success.
Over the years, the need for visual aids continues to be the main talking point. Trends, graphs, and columns are always helpful in understanding ebbs and flows within marketing campaigns.
–Christopher Marrano, Founder and CEO of Blue Water Marketing
Misleading Data Visualization: A Threat to Your Agency and Clients
As the term implies, misleading data visualization refers to any erroneous or incomplete visual representations of your clients’ data.
The Implications of Bad Data Visualizations
If you aren’t careful, bad data visualizations have the potential to severely skew business decisions and steer your clients way off track.
The consequences of bad data visualizations include:
Missed opportunities to make tweaks or improvements to your clients’ marketing strategies
Misinformed clients that don’t grasp the full impact of their marketing efforts
A compromised agency reputation
Skewed or completely inaccurate business decisions (which could leave your clients with financial woes and other associated challenges)
Our clients rely on accurate data. Accuracy is extremely important because it allows our clients to make important decisions as the data rolls in, and as an agency, it allows us to advice based on the data for a better return on their investments.
–Vinod Samuel, Operations Director at myheartcreative
Here’s the thing. Even if your clients’ data visualizations aren’t picture-perfect or agency churn happens, it’s better than compromising your values or losing credibility. Long story short: Bad data visualization examples aren't worth it in the long run.
Build solid agency-client relationships and foster a sense of trust. Grant your clients 24/7 login access to their marketing dashboards on AgencyAnalytics–it’s free for 14 days.
We provide our clients with login access to their AgencyAnalytics dashboard. This is all because, as a company, one of our core values is transparency. We've found that AgencyAnalytics and dashboards help to build trust, as we're not hiding anything.
–Christopher Marrano, Founder and CEO of Blue Water Marketing
5 Misleading Data Visualization Examples (and How To Avoid Them)
Even if your agency has the best intentions, bad data visualizations are more common than we may think.
To give you more context, here are a few misleading data visualization examples to consider.
1. The Manipulation of Axes or Scales
Any effective graph needs axes and scales. Things can go haywire pretty quickly if they’re distorted or omitted altogether–let’s explore these data visualization mistakes further.
Omitting Axes Means Any Data Narrative Is Possible
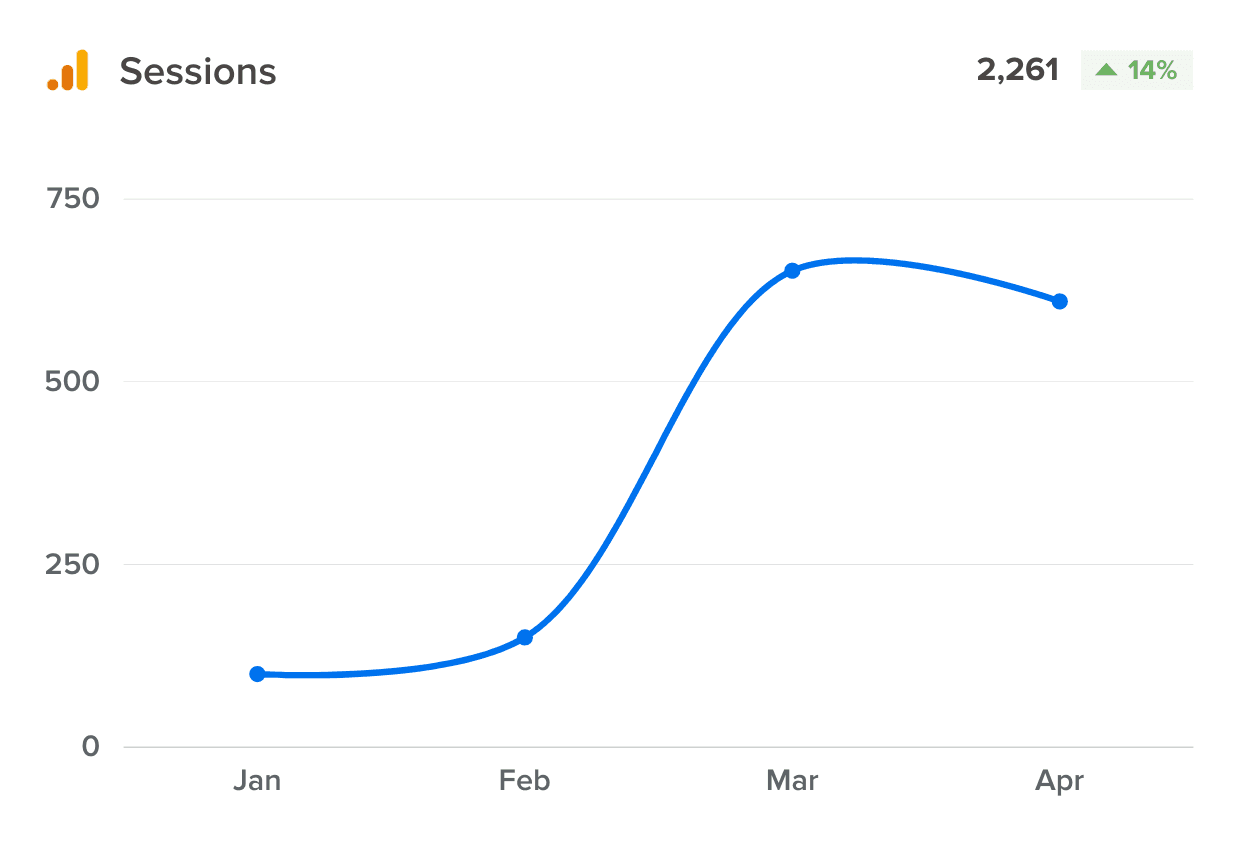
Let’s say you’ve got a client running a content marketing or SEO optimization campaign with a goal of 1,000 organic sessions per month.
One of their latest blogs received significant traction, resulting in an uptick in organic website visitors from February onwards (as seen below).
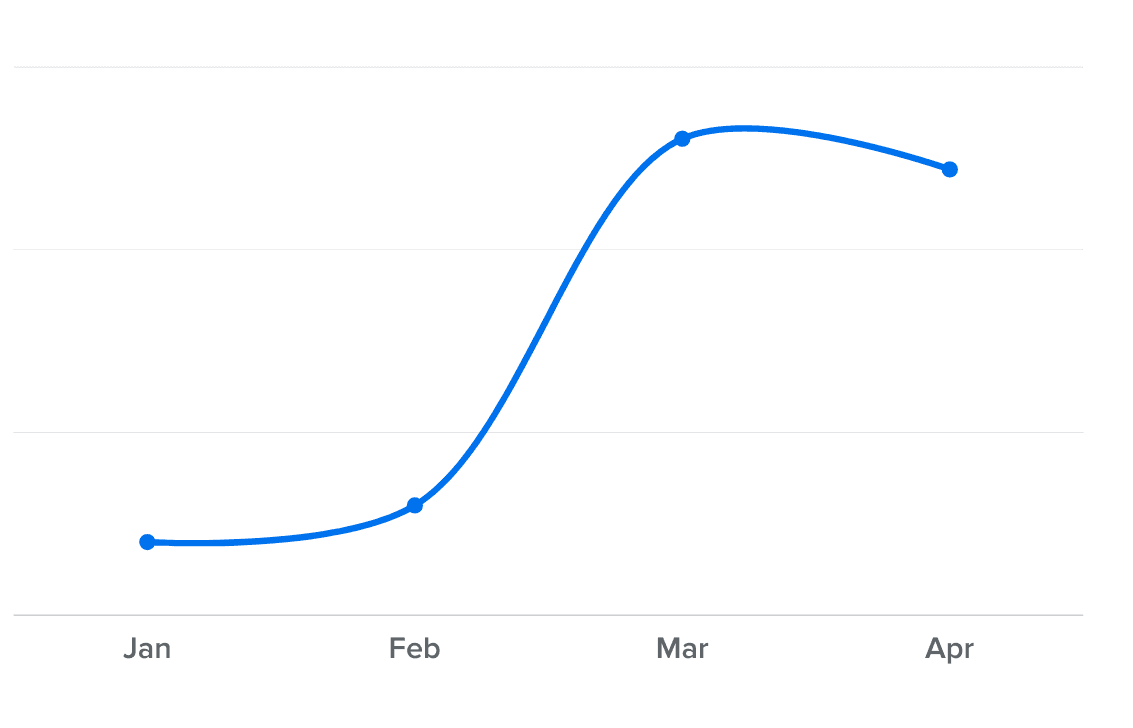
Without labels or axes, any explanation is possible. This growth in organic sessions could appear massive, as if it was in the thousands. And it would be easy for the client to jump to that conclusion, given the shape of the graph and the lack of scale increments.
Even though there was a notable increase that paints your agency in a favorable light (you were ahead of target, after all), in reality, your client’s actual results were not quite as impressive as they seemed.
As you can see in the fully labeled graph below, the growth was in the hundreds (not the thousands).
Use pre-built marketing dashboards with easy-to-understand visuals and labels. Tell a story of your clients’ data on AgencyAnalytics–start your free 14-day trial today.
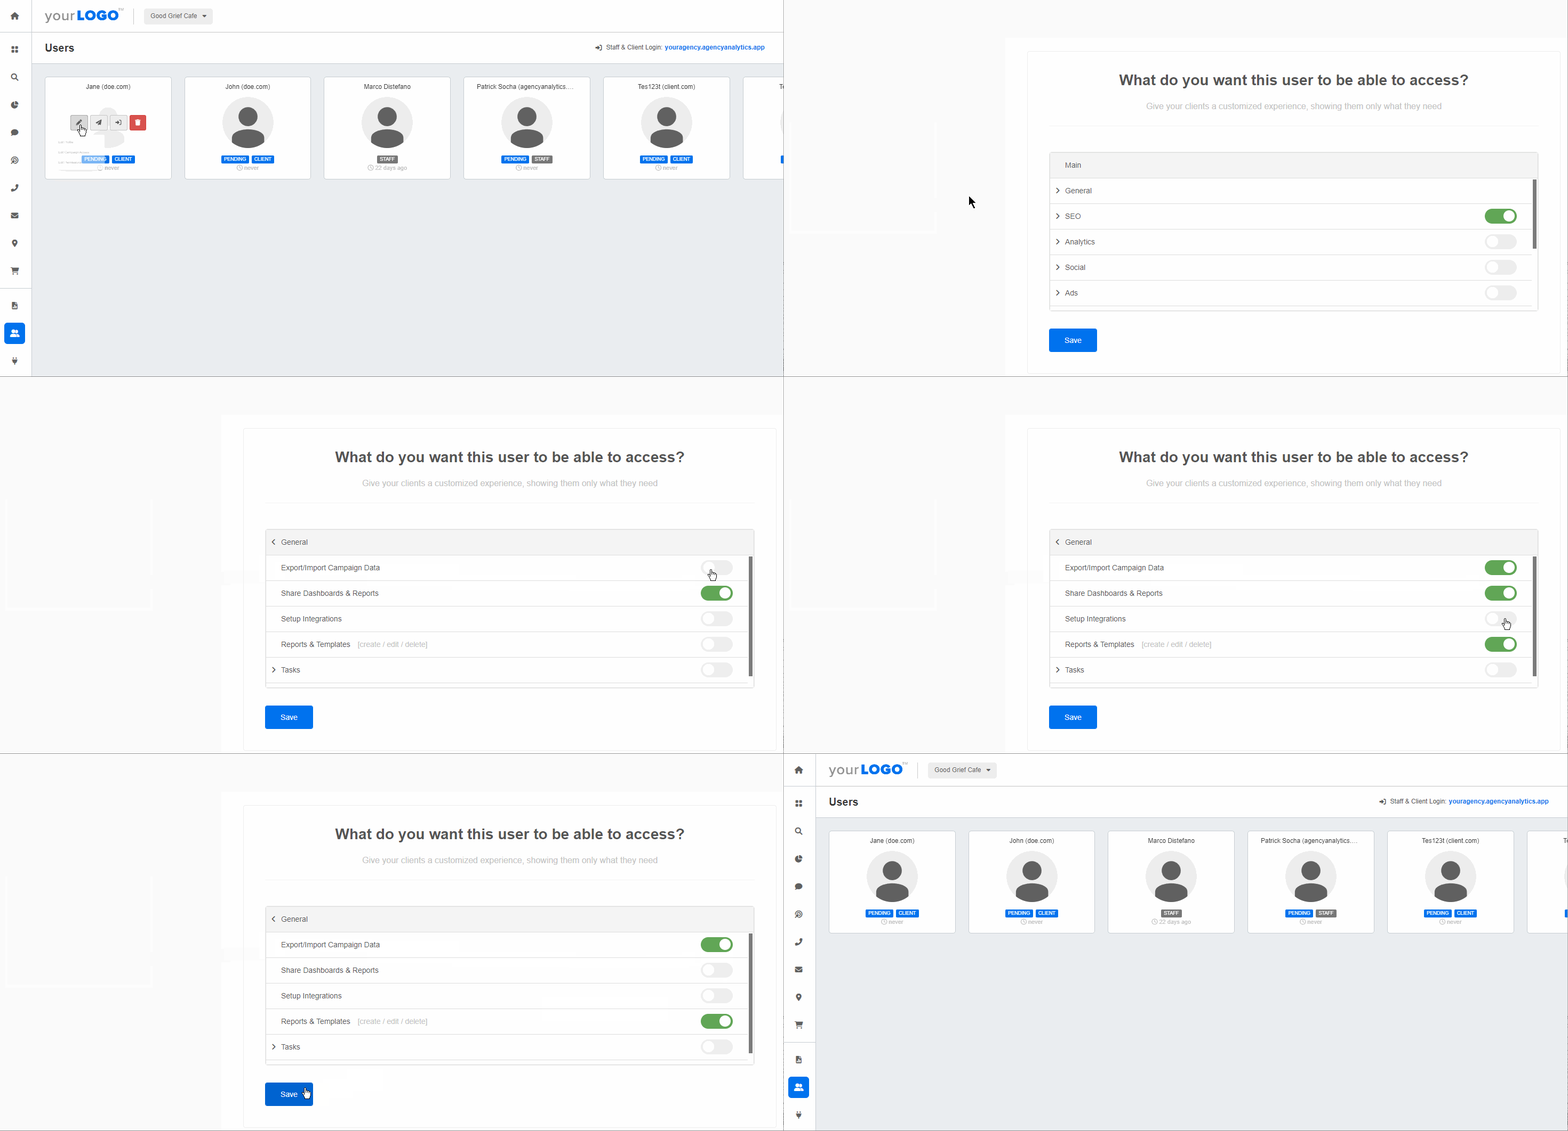
Agency Tip: Want more control over what data is shared without compromising integrity? After creating login profiles for your clients on AgencyAnalytics, set user permissions beforehand. That way, you’ll share valuable insights without unnecessary fluff (such as vanity metrics).
Of course, the opposite result could occur as well. Without labels, your client may undervalue the results, thinking that it was only a handful of clicks instead of the hundreds that were generated.
Any manipulation of axes and scales results in misleading data, so avoid this mishap at all costs.
As Claire Aldridge, Digital Marketing Specialist at Victory Digital, shares, “Transparency is our philosophy. Our clients always comment on how AgencyAnalytics allows them to “check under the hood” of their digital marketing like seeing what activities we’ve completed, budgets and spend, and their real-time stats.”
This sense of openness and control has been invaluable in strengthening relationships and has definitely contributed to our growth and success.
–Claire Aldridge, Digital Marketing Specialist at Victory Digital
Inappropriate Scaling Leads To Exaggerated Visual Results
Graphically speaking, scaling highlights incremental changes and historical trends. However, using the wrong scale can exaggerate marginal changes and even sensationalize marketing results.
Take the bar charts below. Using a truncated vertical axis (i.e., not starting from zero) paints a much different picture of your client’s marketing performance. At first glance, October’s conversion rate seems significantly higher than in other months.
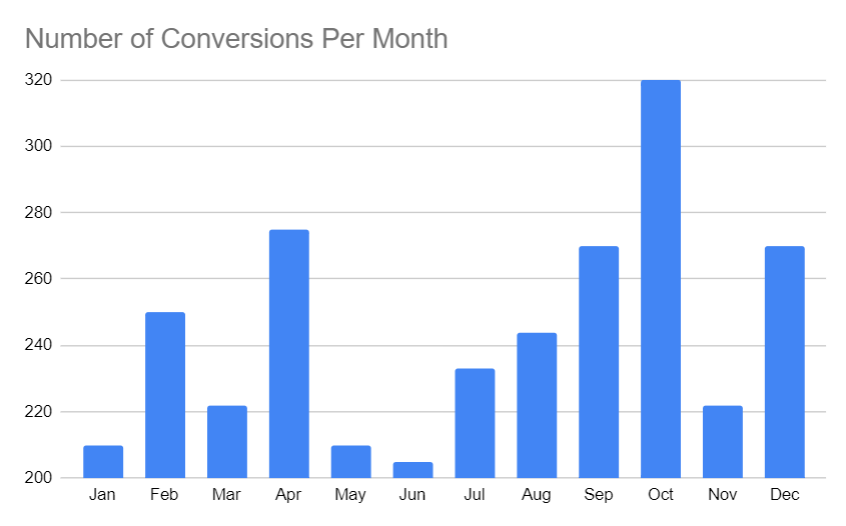
In reality, though, there’s an insignificant difference that may not even be worth mentioning. While there is some increase in conversions for October, it’s a marginal difference compared to the other months.

Simply zooming in on the scale dramatically changes the data visualization! That said, how do you decide on optimal scale increments? Doing trial-and-error runs on Excel or dealing with Looker Studio limitations isn’t the best use of your time (let’s be real).
Don’t sweat it–use pre-built marketing report templates with all this nitty-gritty data infrastructure in place. It’s just a matter of connecting your clients’ marketing platforms, choosing your template, and letting the visuals do the talking.
Read More: The Best Digital Marketing Report Templates to Streamline Client Reporting
AgencyAnalytics’ templates offer quick, visually appealing overviews of any selected data. Their customization is valuable, and they make data easily accessible to staff and clients.
–CJ Dunbar, Brand Manager at Suite Edge
2. Cherry-picking Data to Harvest Favorable Results
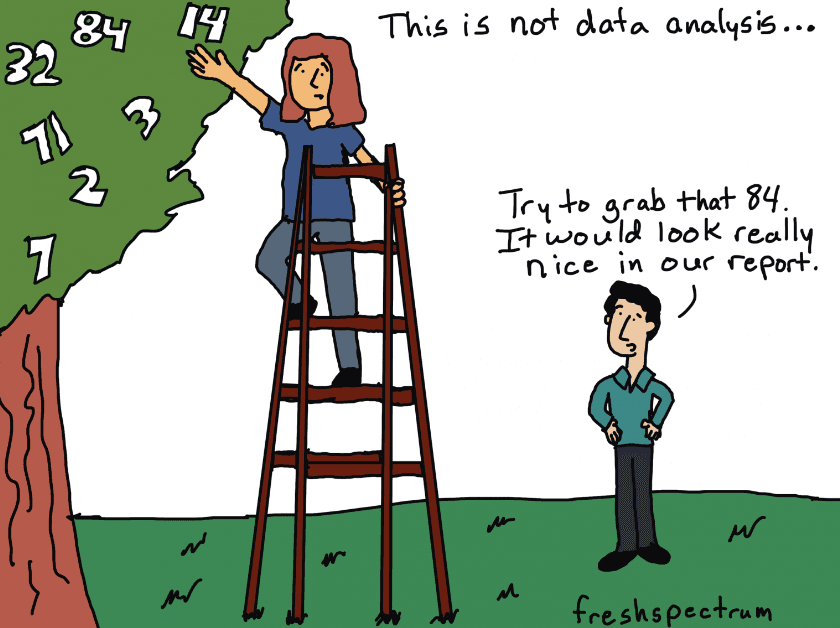
Cherry-picking data is a subtle form of manipulation that convinces clients their marketing campaigns are performing optimally (or even past targets). Here’s the catch–it involves specifically focusing on positive marketing results and disregarding any data that throws off that perfect picture.
And while you may want to highlight any wins or results that prove your agency’s worth, hand-selecting data isn’t the way to do it. This bias-driven approach will only shield your clients from an accurate marketing picture while possibly eroding trust in the process.
Accuracy establishes and nurtures trust, and trust is the most vital ingredient in a good client relationship and client retention.
–Lorianna Sprague, Vice President of Marketing at Trusted Search Marketing
But what does cherry-picking data look like in the real world?
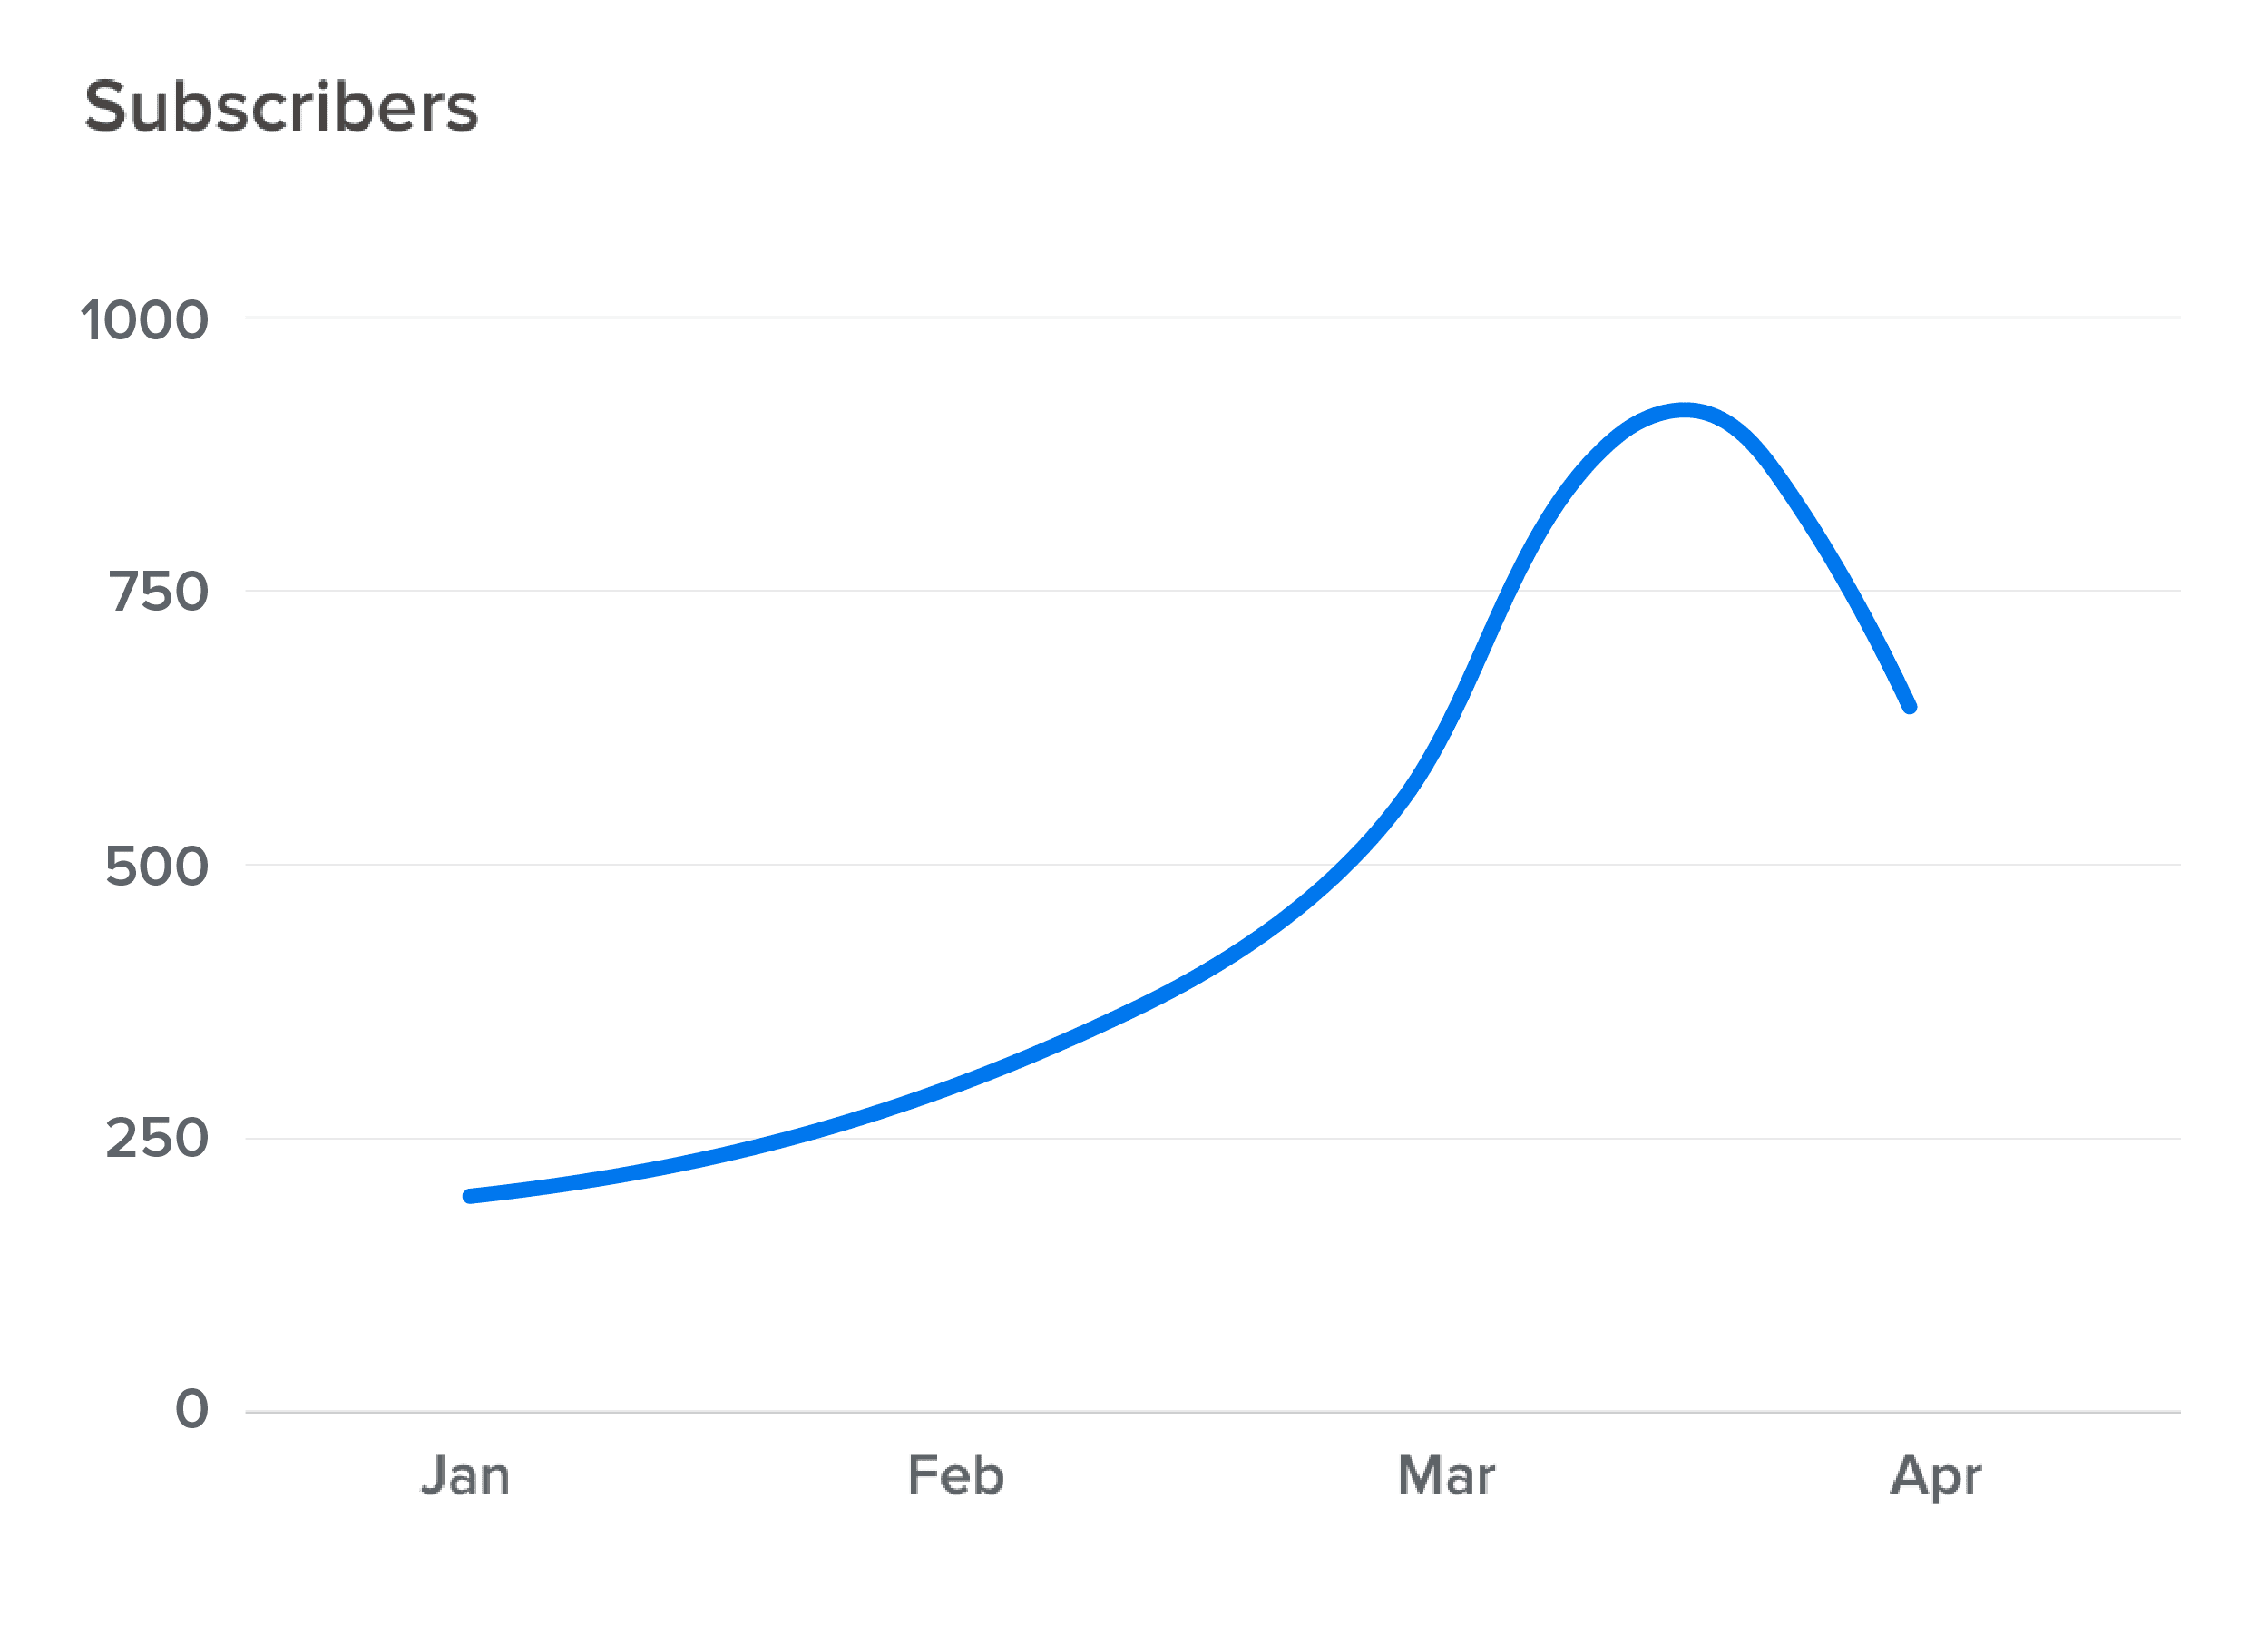
Let’s say one of your clients is focused on nurturing current email subscribers and continuously delivering valuable content.
Sharing only part of their results implies a steady increase in subscriber rate per month (as seen in the graph below). As far as your client can tell, all seems to be well, and there’s no cause for concern.
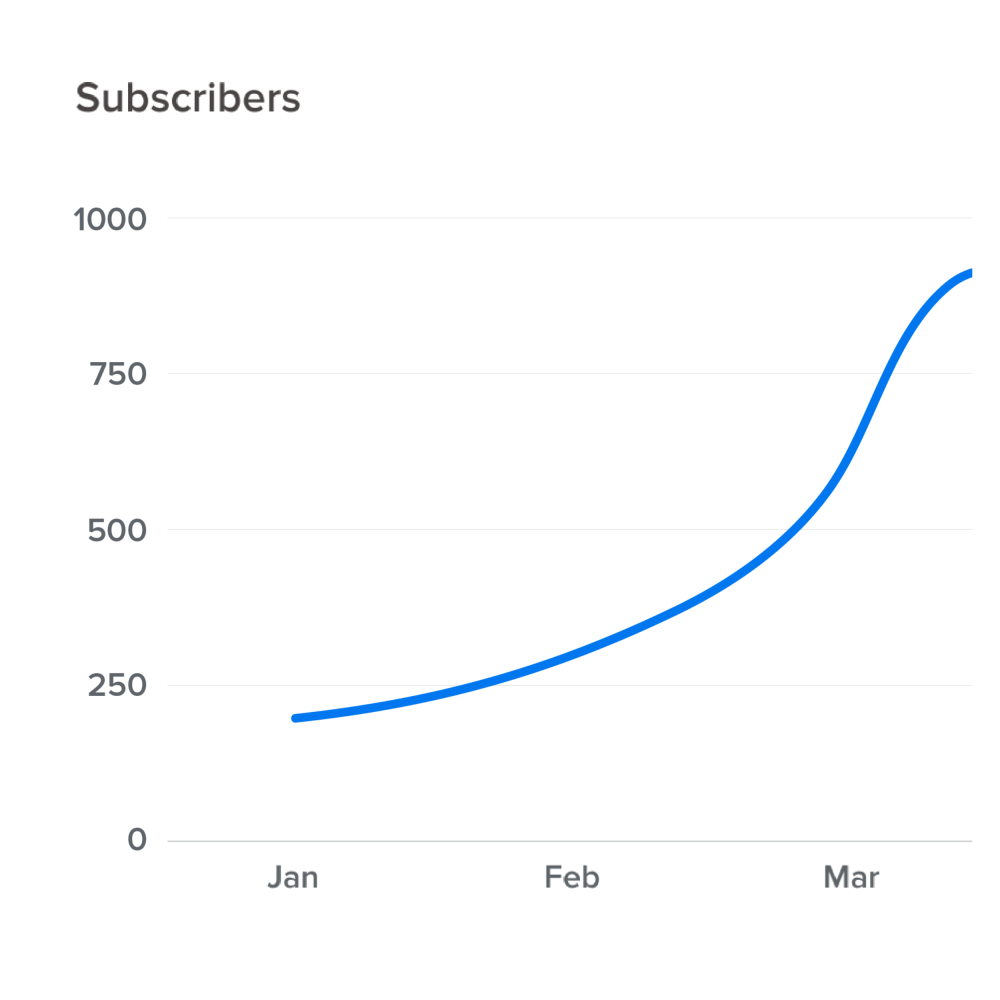
However, their email marketing performance is much more concerning as time progresses. In fact, there was a major plunge in subscriber rate in April, which implies their strategy needs a total overhaul (e.g., adjusting email frequency or creating more relevant content).
Consolidate your clients’ most important insights into visual, easy-to-understand dashboards. Deliver exactly what they’re paying for–try AgencyAnalytics today, free for 14 days.
And so, cherry-picking data chucks those issues into a corner and doesn’t give your agency an opportunity to correct them. On top of that, your client will be blindsided in the process, which certainly isn’t fair or just.
Even if there are hiccups with your clients’ marketing campaigns, don’t hide behind a few top-performing metrics. No agency is perfect, and there’s often an opportunity to improve once you’re transparent.
3. Using the Wrong Chart Type
All that rich data won’t mean much if you don’t use the right chart type. In fact, it may just confuse your clients in the process.
For example, let’s say you’re tasked with monitoring backlink acquisition and need to keep tabs on any new or lost backlinks. Naturally, you’ve decided to rely on data visualization to see what’s happening. But choosing the wrong chart type (like the example below) just makes life difficult.
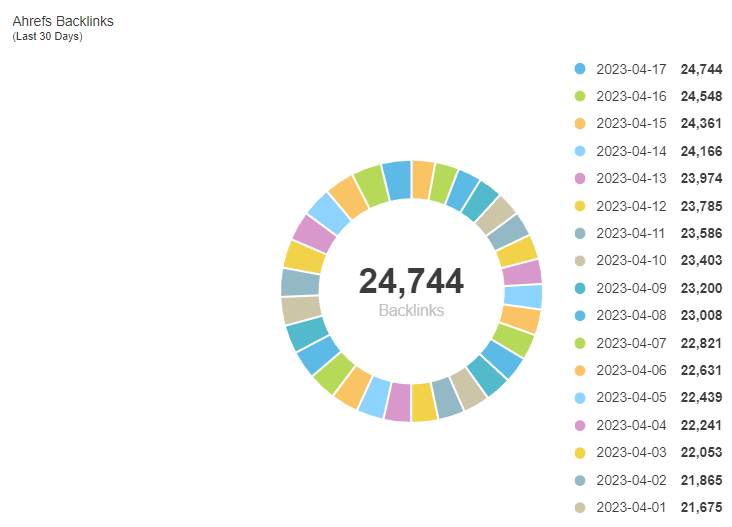
This bad data visualization example looks like a color wheel gone wrong. And to top it off, it doesn’t visually show any increases or decreases in the number of backlinks (which defeats its entire purpose).
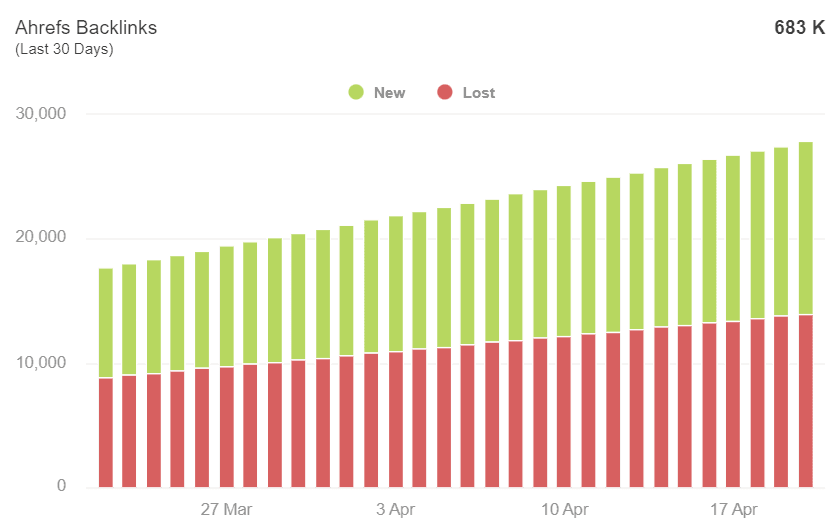
On the other hand, consider this data visualization example (taken straight from an AgencyAnalytics Backlink Monitor dashboard).
Explore a range of data visualizations and choose the best representations of your clients’ data on AgencyAnalytics–sign up for a free 14-day trial today.
Here’s exactly why it works well:
There’s a clearly defined legend and seamless data blending for the number of new and lost backlinks
Visually, it’s much easier to identify any dips or increases in the number of backlinks
It’s time scaled, which helps monitor historical trends and pinpoint time-sensitive changes
The best part? It’s already optimally formatted (which is a major pro of using marketing dashboards built specifically for agencies).
The data visualization provided by AgencyAnalytics report templates goes above and beyond the reports you can create in Google Sheets, and it's all at the click of a single button. We really appreciate the automation as well.
–Graham Lumley, Director of Growth Marketing at Blackhawk Digital Marketing
4. Misleading Labeling, Comments, or Annotations
Although comments and annotations are great for explaining data, they can also end up changing the meaning of data if they’re not used properly.
Inaccurate value labels also have the potential to misguide clients and make it difficult to understand what the data actually means.
For example, let's say that a marketing agency is promoting a client's new product and wants to show the increase in product popularity since launching. To do this, they create a line chart that shows the number of product page views over the past few months.
However, instead of labeling the y-axis with the actual number of visits, it’s labeled with a vague term like "product interest." To top it off, they’ve added a comment that highlights the product launch right before the spike in traffic (which further exaggerates this piqued interest).
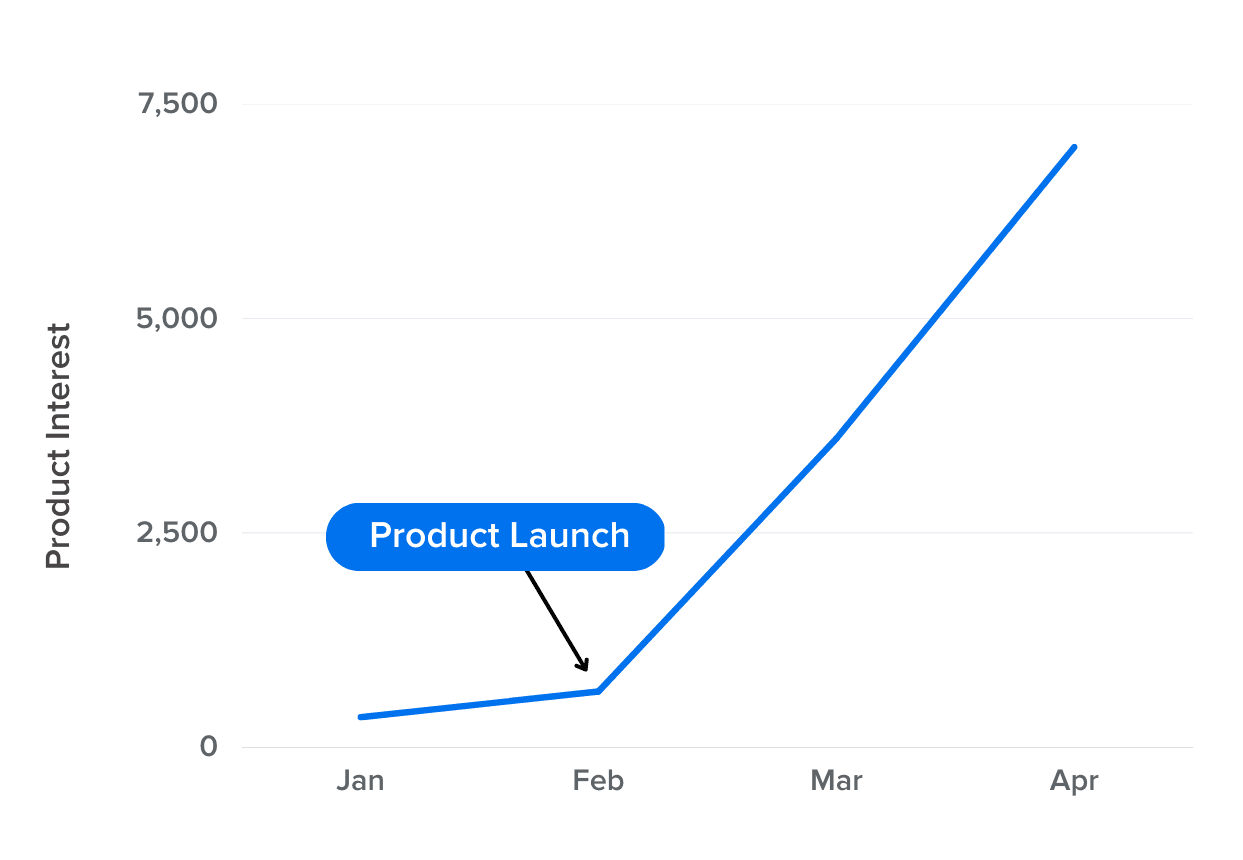
Sure, people landed on the page–but does that really indicate “product interest”? And technically speaking, “product interest” isn’t a metric.
To avoid this type of issue, make sure that labels (including comments or annotations) explicitly reflect the data being shown.
5. Incorrect Comparisons
Comparing apples to oranges definitely doesn’t paint a valid picture. In fact, comparing data in an unmeaningful or inappropriate way leads to inaccurate conclusions.
Let's say that your marketing agency is tracking keyword rankings for a client's website. There’s a list of priority keywords that you’ve been tracking for over a year. To highlight improvement over time, you’ve created a line chart that shows the average ranking for these keywords.
However, the SEO team removed a bunch of low-ranking, low-volume keywords back in October. It seemed like the right thing to do based on competitive SEO analysis and keyword difficulty.
The resulting chart appears like your team is doing a better job than they actually are. And that’s only because the set of keywords being tracked is different than previous months.
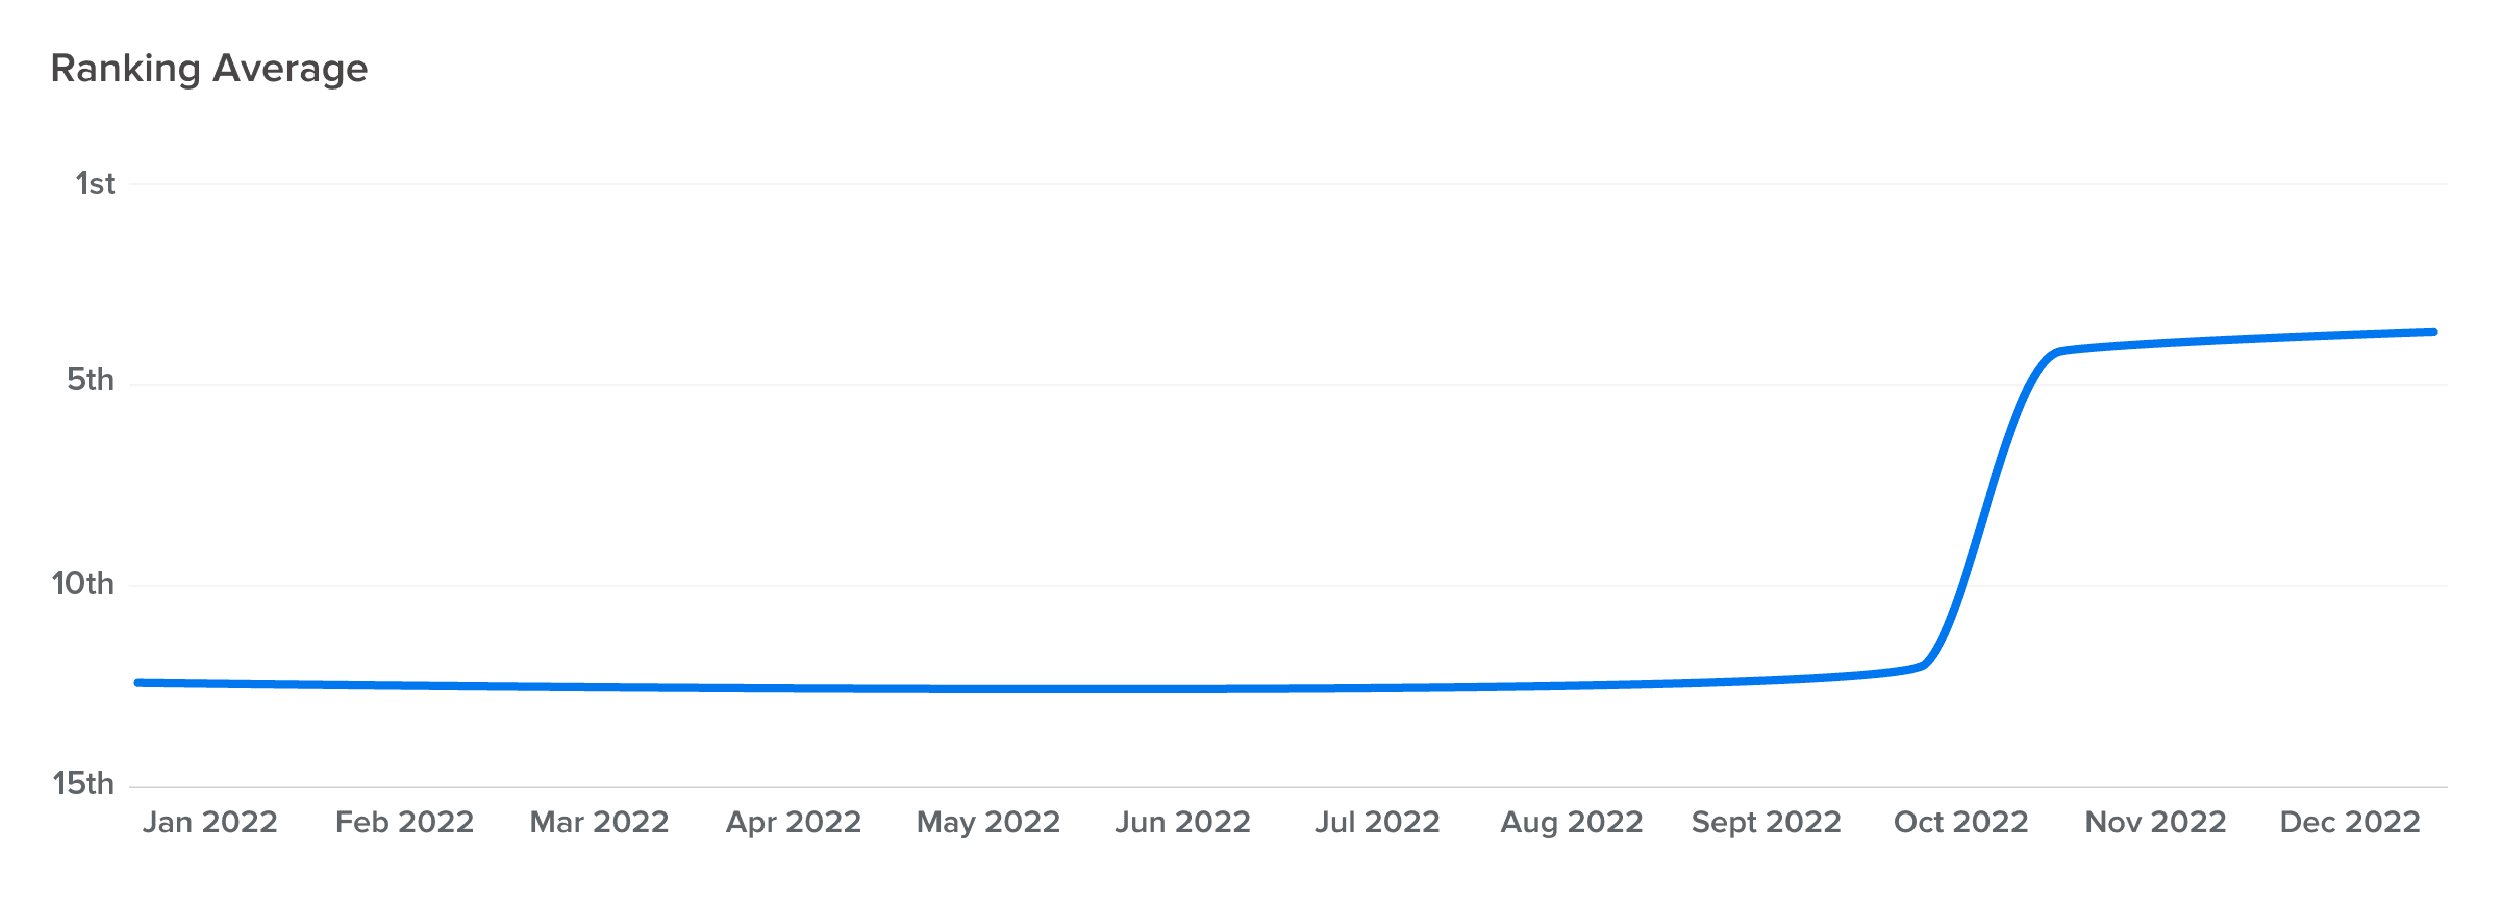
To avoid this issue–even if it’s accidental–make sure that the graphic representations are using the same set of data over time. That way, if keywords are removed, the graph only reflects the historical data for those keywords.
Having accurate reporting means everything, as we are a result-driven business. We need to be transparent to our clients with accurate reporting. Even if there is a negative, eg, a ranking drop, we need to be honest with our clients so we can act on and improve the situation.
Andrew Thomas, Technical Director, HookedOnMedia
Automated keyword rank tracking software will handle this for you, but manual spreadsheets may not.
4 Tips for Preventing Poor Data Visualizations
Don’t confuse or lose clients because of the bad data visualization data examples we've covered. Here are some general tips to avoid this mishap.
1. Ensure Graphs are Accurate, Timely, and Comprehensive
Before clicking ‘Send’ on that client report, ensure that there’s:
Labeling of axes and scales, in addition to graph titles
Real-time data that comes directly from your clients’ marketing platforms
An appropriate data range that covers all relevant metrics for the reporting period

Choose customized date ranges to ensure you’re delivering comprehensive reports. Access a range of time-saving features on AgencyAnalytics–it’s free for 14 days.
2. Choose the Right Type of Chart
Don’t miss out on a goldmine of data because of the wrong chart type. This is also where a clear understanding of the differences between discrete vs. continuous data comes into play. A bar chart with a bunch of conversion rate percentages will be much harder to read than one that represents discrete data points like the total sales volume. Using the best data visualization tools that house the most effective chart arrangements is also a great start.
Remember to choose a data visualization that:
Has enough color contrasts between graphical elements to quickly understand what’s happening
Isn’t overwhelming your clients with too many data points, legends, or colors
Visually depicts performance trends at first glance
Properly suits the type of number you want to highlight
We needed a place where clients could look at stats, and have it easily digestible. The AgencyAnalytics reporting platform provides great visuals for our clients–they're beautiful and easy to read.
–Rachel Jackson, Lead SEO at Wit Digital
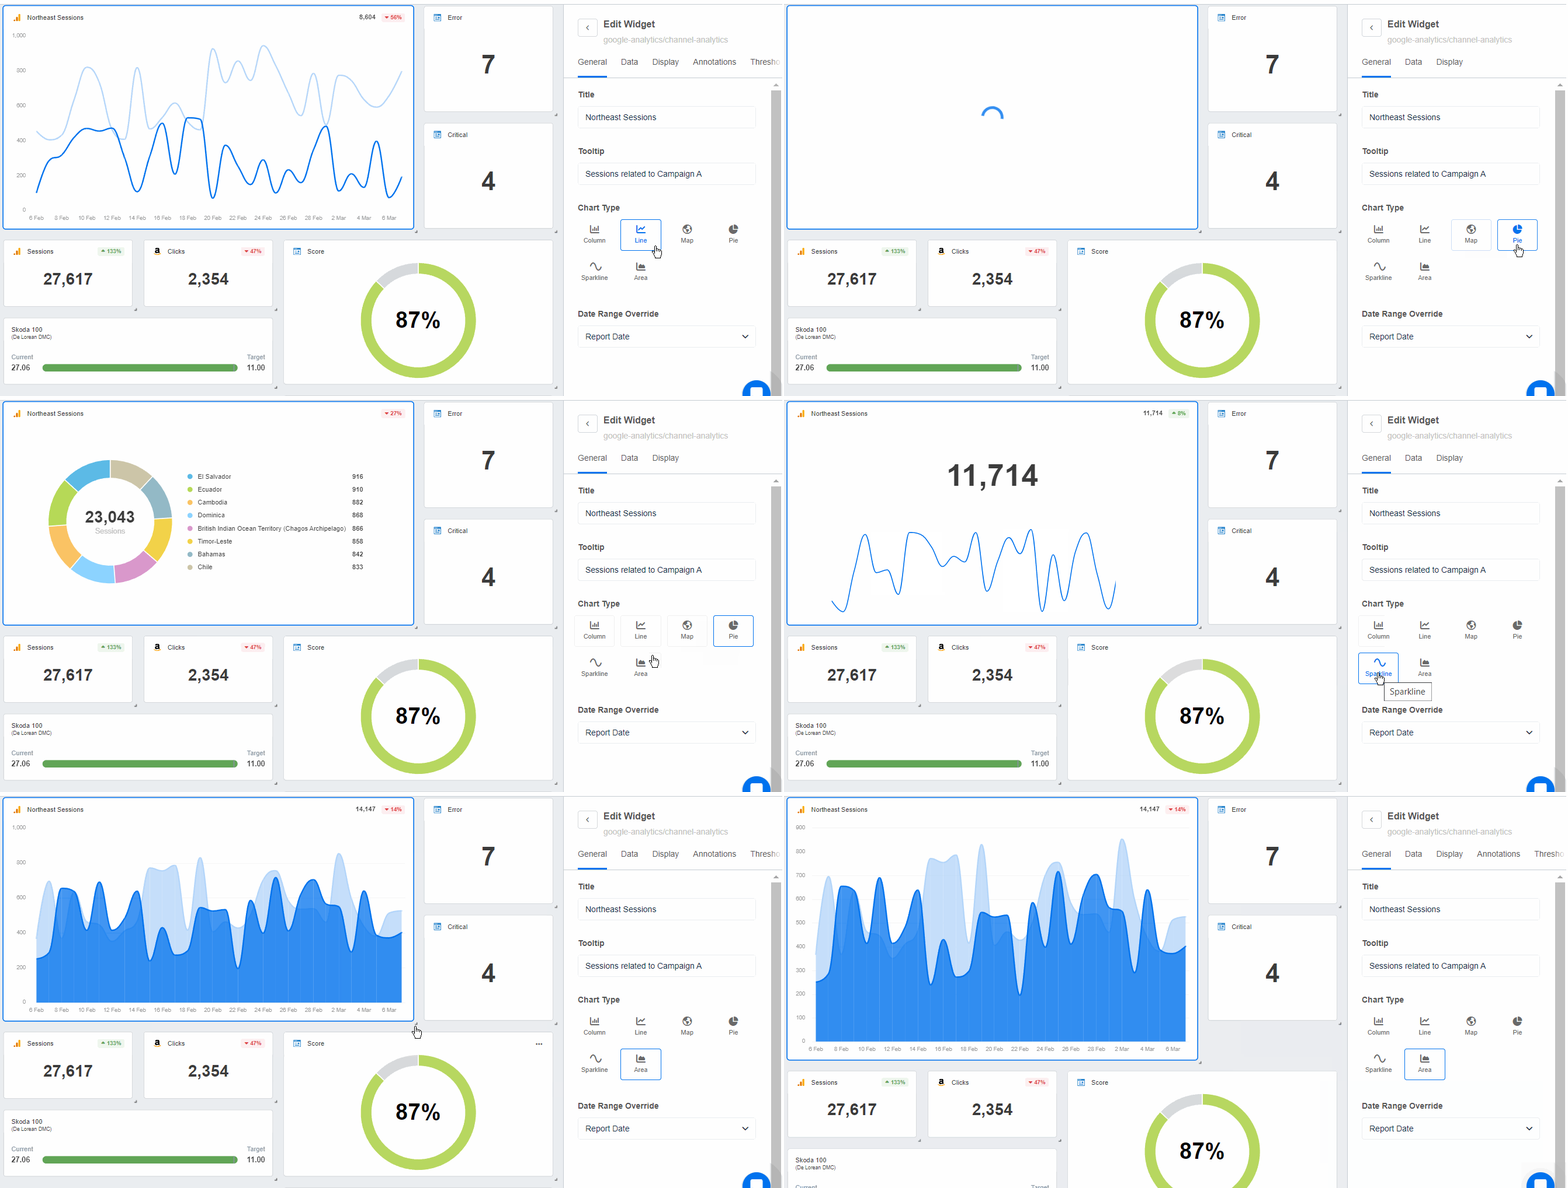
Choose the data visualizations that illustrate your clients’ marketing results on AgencyAnalytics–sign up for your free 14-day trial today.
3. Add Context Where Necessary
Don’t just present pretty charts and graphs–make use of data storytelling. After all, your busy clients don’t have time to scrutinize every data point or bar graph.
By including annotations directly on data visualizations, your clients will have more context to make better business decisions.

Break down complex data points or trends by simply adding annotations. Give your clients the context they need–deliver results by using AgencyAnalytics, it’s free for 14 days.
We always review the data, making specific recommendations that will be of value to the client. Data can be so in-depth and often needs context to evaluate how effective the campaign is, what needs to be adjusted, and how it impacts the long-term goal.
–Valerie Jennings, CEO of Jennings Social Media & MarTech
4. Stick to Reliable Data Sources
Manual data collection is just a big no-no, especially when managing multiple clients. The last thing you want is making copy-and-paste oversights or making numerical typos.
This outdated approach will only result in inaccurate data visualizations and business decisions.

Luckily, there’s a fix. Using a client reporting tool like AgencyAnalytics means seamless integration with over 80 marketing platforms.
Client retention is key to the success of our business. By using AgencyAnalytics, we are able to provide our clients with insightful, accurate, and detailed reports that showcase the value we bring to their business. This level of transparency and clear communication helps build trust and strengthen our relationships with clients, which in turn leads to higher levels of client retention.
Adam Binder, Founder + CEO, Creative Click Media
That means data retrieval is automated, dramatically reducing the chances of human error. The outcome? No more wasted hours manually creating data visualizations.
Accurate Data Visualization Is the Key To Marketing Success
At the end of the day, your agency is committed to delivering results. And while you’re spending countless hours tweaking those marketing campaigns, things happen, and results don’t always go as planned.
That said, don’t resort to misleading data visualizations, as it has the potential to distort the bigger picture and severely impact your clients’ business decisions.
In summary, remember to:
Include all relevant labeling on data visualizations (such as axes, scales, and legends)
Choose a color scheme that isn’t too overpowering or monochromatic
Remain transparent and follow client reporting best practices (even if the results aren’t what your clients expected)
Invest in an automated client reporting solution that provides compelling data visualization from the get-go
Why spend hours trying to figure out how to change a scale or add an axis label on Excel or Looker Studio? Save yourself the headache–use a client reporting tool like AgencyAnalytics to create compelling, accurate data visualizations easily.
From white-labeling reports to creating custom dashboards, AgencyAnalytics streamlines reporting and puts billable hours back into your day.
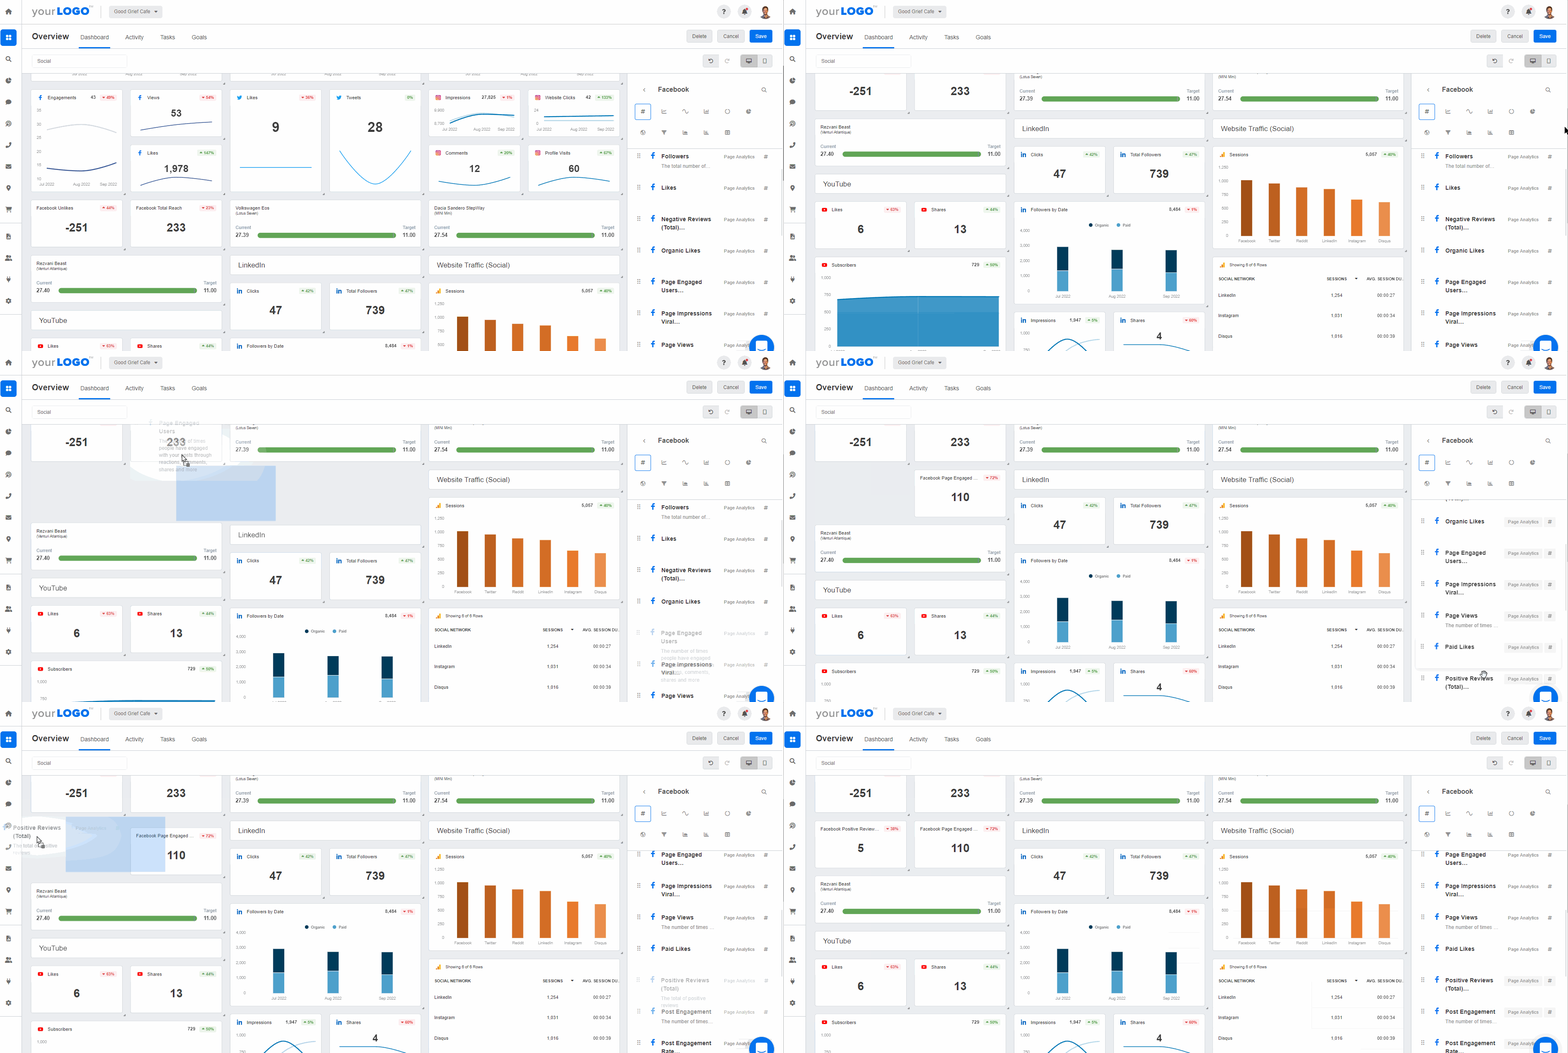
Choose from a range of visually appealing report and dashboard templates on AgencyAnalytics–sign up for a free 14-day trial today!
Covering a broad range of digital marketing analytics, here are just a few of the 15 dashboard templates available to get you started.
AgencyAnalytics makes us look great! It’s fast, has a beautiful interface, engaging live animations, and many options to customize reporting and make it as unique as our clients. Allowing clients to log in and see their dashboard is the cherry on top.
–Nathan Hawkes, President of Arcane Marketing

Written by
Faryal Khan is a multidisciplinary creative with 10+ years of experience in marketing and communications. Drawing on her background in statistics and psychology, she fuses storytelling with data to craft narratives that both inform and inspire.
Read more posts by Faryal KhanSee how 7,000+ marketing agencies help clients win
Free 14-day trial. No credit card required.


