Table of Contents
Table of Contents
- What is Data Blending?
- Is Data Blending The Same as Data Integration?
- Types of Data Blending
- What Does the Data Blending Process Look Like?
- How Does Data Blending Work?
- The Key Steps to Data Blending With Multiple Data Sources
- How To Blend Data With Data Studio
- How AgencyAnalytics Differentiates Data Blending
- Summary and Key Takeaways
7,000+ agencies have ditched manual reports. You can too.
Free 14-Day TrialQUICK SUMMARY:
Data blending is a technique for combining multiple data sets to provide a thorough view of marketing performance without altering the original data. This method enhances reporting and campaign optimization by merging data from different sources into a single, streamlined interface. Learn how data blending tools simplify complex data analysis and drive informed marketing decisions in this practical guide.
Data-driven marketing is taking up much of the decision-making for businesses across industries. Agencies and their clients can’t afford to fall behind in the race for more and more precision, even as data volume and complexity continue to grow.
But data analytics and data storytelling are evolving too. Now, decision-makers can get precise, actionable data without leaning on dedicated data specialists or costly, complicated data integrations.
Say you’re a strategist or project manager leading a multi-faceted campaign that’s begun to lag in conversions against campaign KPIs, just before your client is due to decide on extending your agency's contract.
You have budget and time left to address the dip in performance, but you don’t know where to spend either resource on refreshed assets. You’re running many different flavors of lead generation, so you obviously need to look at a cross-section of data to see where the dropoff originated.
Without today’s quick and powerful applications of data blending, you’d be in a tough place. You’d either have to pull resources from your agency’s data team (if you have any available) to gather and crunch the numbers quickly, or you’d have to muddle through doing it yourself.
Neither solution screams optimization, especially when you have plenty of other work to do. Fortunately, you do have access to tools that make data blending simple.
Let’s explore more about data blending, how it works, and its benefits to agencies in more detail.
What is Data Blending?
Data blending is a method for bringing together two or more data sets and visualizing results in a way that does not physically combine or alter the original data.
Blends use outside code (such as within an analytics or business intelligence tool) to query data sources separately and then combine the read-only data into whatever visualizations are made possible by that tool.
This approach joins data with much more flexibility and speed than other methods of combining data for analysis.
Is Data Blending The Same as Data Integration?
Data blending is often confused with data integration, but there is a key difference between the two. Data integration physically combines multiple data into a single database or file. This can be done through data pipeline processes such as ETL (extract, transform, load), which extracts data from multiple sources, transforms it into a common format, and then loads it into a single database.
Data blending, on the other hand, does not physically combine data sets. Instead, it uses a process called "virtualization" to allow multiple different data to be viewed together for analysis. Virtualization creates a virtual copy of the data that can be used for analysis without actually changing the original data sets.
In total, data blending differs from data integration in a few important ways, summarized below:
Data integration | Data blending |
|---|---|
Combines data sources into a new, separate data set | Data sources maintain their integrity, with the new combined data existing only within visualizations/reports |
Most often performed by data scientists or analysts | Can be performed by non-analyst stakeholders in sales, marketing, finance, operations, etc. |
Cannot combine external, published data | Can integrate many forms of published external data |
When original data sources change, a new combined data set needs to be created (manually or automatically) | When original data sources change, your visualization tool can more easily automatically update results |
More process-intensive and slower | More straightforward and rapid |
Used for larger, more complex data combinations | Used for simpler combinations |
Types of Data Blending
Although data blending does not vary much by type, there are a few different ways in which data can be blended by an analytics and/or business intelligence (BI) tool. The difference lies in how you might instruct your data visualization tool to join data in your blend.
Without making it too complicated, a join is an operation through which combined data sources are positioned to relate to one another for analysis in your blend.
For example, inner joins are used when you want to match rows from two tables based on the common values. Let's say you had data from Stripe with an email address and a matching row from Hubspot with the same email, an inner join would match this data because they both have the same email. An outer join combines data sets even if they do not have matching values in a common key column. For example, you could outer join two data sets containing website traffic data, even though many of the URLs have changed over time as you publish new client content, blog posts, etc.
When reviewing the diagram below, envision data within rows and columns, like in a spreadsheet. That’s exactly how it’s organized, anyway!
| Inner join Analyzes only matching rows from left and right tables |
|
Left outer join Analyzes matching rows from the right table and non-matching rows from the left table |
| |
| Right outer join Analyzes matching rows from the left table, plus non-matching rows from the right table. | |
Full outer join Analyzes all matching rows from the left tables or the right table. |
| |
Cross join Analyzes every possible combination of rows from the left and right tables. |
What Does the Data Blending Process Look Like?
The good news, for anyone dizzied after reading the section above, is that the kind of data blending used by most agencies will be done for you by your analytics, BI systems, and reporting tools.
Although it’s handy to understand how this data output comes to be, these processes will most often look like an easier, faster version of the more complex work that a dedicated data scientist might perform on larger joins/integrations.
THE BASIC STRUCTURE OF DATA BLENDING
STEP 1: Gathers discrete or continuous data from various sources, such as the over 80 integrations available with AgencyAnalytics
STEP 2: Utilizes visualization tools to blend data, which will create customizable dashboards.
STEP 3: Outputs results for analysis and automated client reporting.
If you’re curious about how the magic happens, let’s dig a little deeper into how data blending works. Each of the above steps requires a bit more labor behind the scenes to complete correctly.
How Does Data Blending Work?
Let’s say you want to monitor your ad spend automatically across separate platforms (and data sources) within a client campaign. Or combine them so that you know your total cost across all platforms to ensure you’re staying within budget and/or to inform reallocation.
After joining data together (such as with a data blend), you would use your analytics tool to pull data in for each platform and blend the individual sources to measure across the group.
No data sets are combined, but our tool will populate a visualization that compares a single common metric or set of metrics across all sources.
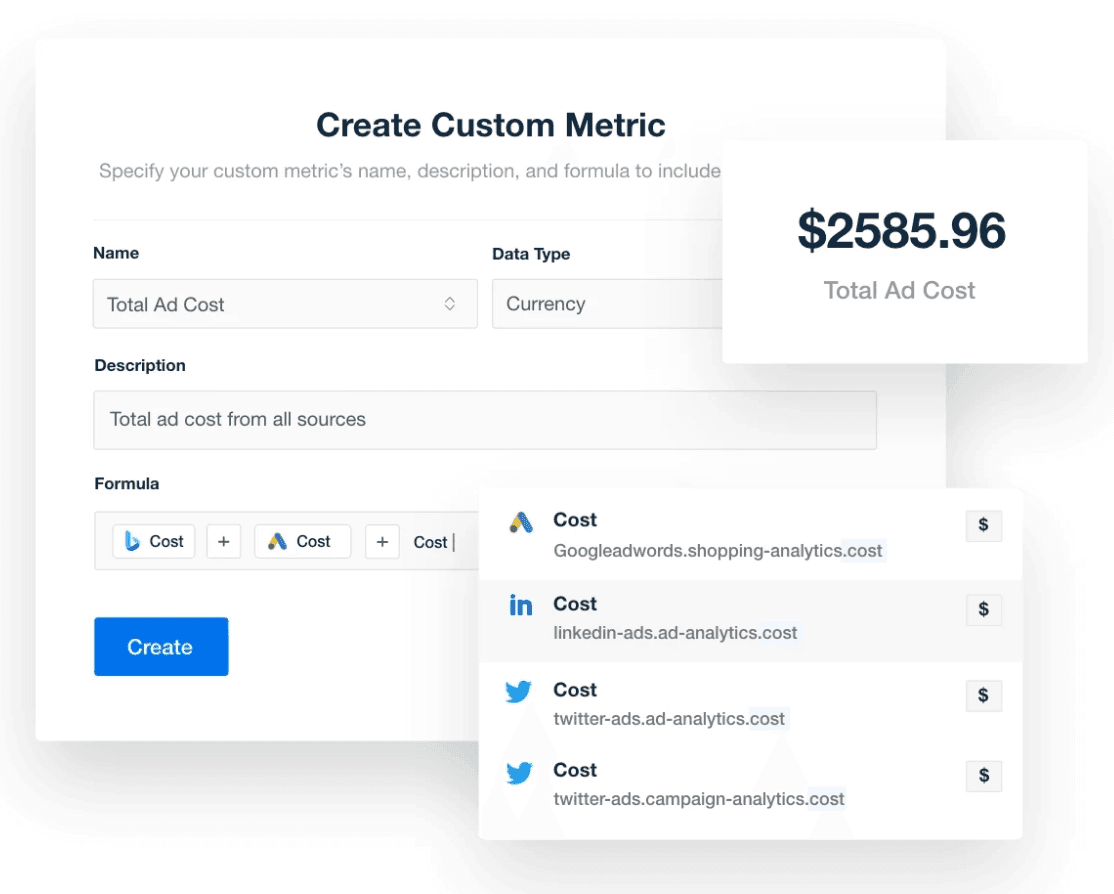
A more comprehensive tool like the AgencyAnalytics PPC reporting tool empowers you to perform such calculations on the fly.
Since data is blended instead of integrated, analyses remain flexible for new or more complex permutations, such as automatically adding an agency’s PPC markup. They are also automated for on-demand or scheduled client reporting.
Why is data blending important?
Data blending has become an indispensable tool for agencies in large part due to the flexibility when dealing with large data sets, as well as the ease and rapidness with which it can enable campaign analysis.
Want to combine all of your client's paid search spend on Google Ads and Microsoft Ads and compare that to your paid social advertising on Facebook Ads and LinkedIn Ads? And then through in a little bit of organic data from Google Analytics 4 and LinkedIn Analytics? Data blending does that for you.
Effectively managing campaigns depends on nimble and timely data.
Data blending empowers sales and marketing leaders and other organizational stakeholders to quickly generate incisive reports and dashboards to inform quick decision-making that could make or break campaign ambitions. Unlike data integration, your clients or colleagues do not need to wait for a data scientist or other specialist to do this.
Another example of data blending in action would be our SEO reporting tool. It combines all of the key aspects of an organic search program, such as rankings, traffic, site audit results, backlinks, and more from various sources, including Google Analytics, Google Search Console, Site audit tools, and rank trackers.
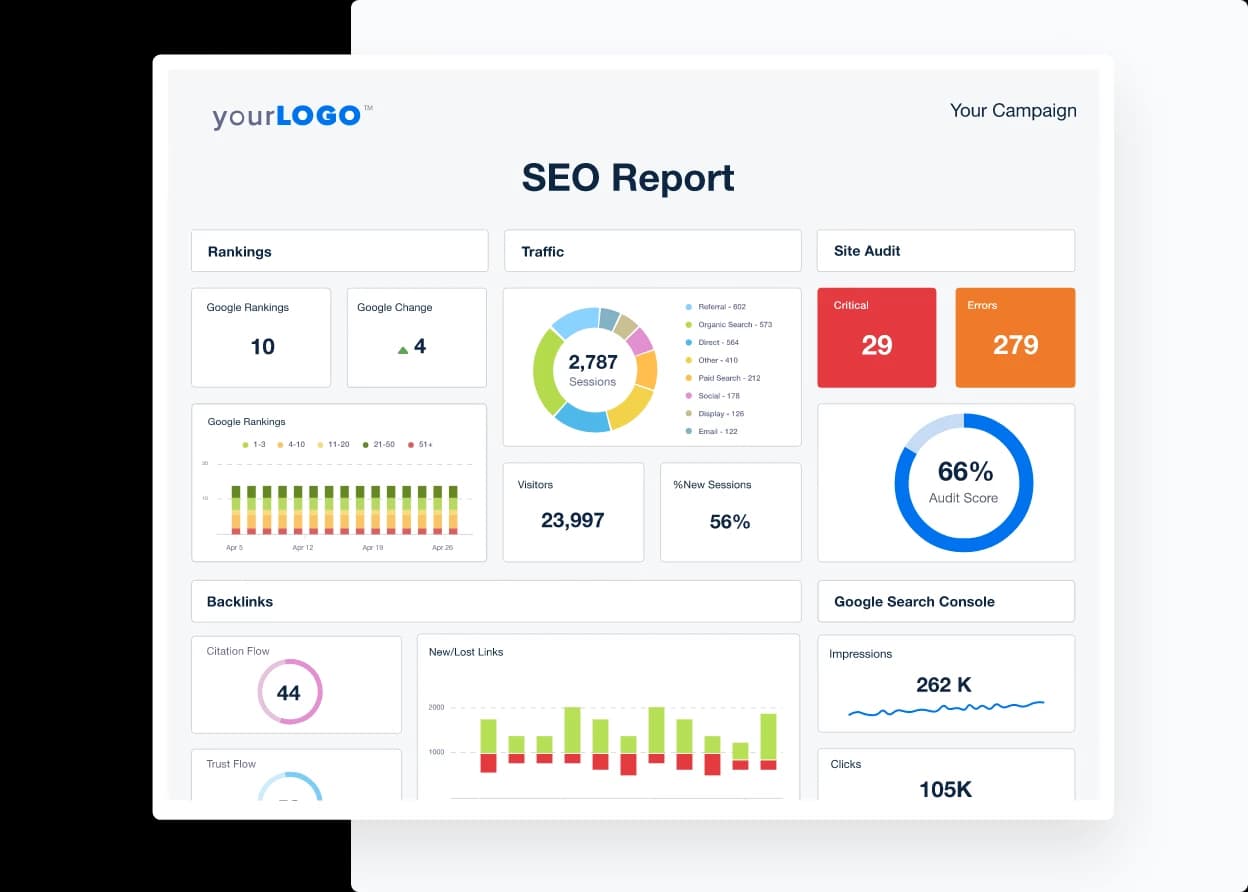
This way, your agency presents a complete picture of a client’s SEO growth in minutes instead of the hours (or days) it might have taken before automated data blending was available.
There’s also the raw power of a robust system for blending and analyzing data to consider.
The ability to quickly blend various data sources also enables greater experimentation and innovation since it provides decision-makers with ways to quickly and easily visualize data relationships across different parts of a campaign, even outside of the original metrics or KPIs.
In short, it can help stakeholders puzzle out new growth areas.
The Benefits of Data Blending
The advantages of data blending over other types of data relationships (such as data integration) are numerous. Considering them all together, it becomes easy to see why blending has become so popular within the competitive landscape for agencies and their clients.
1. Speed
As discussed, with data blending agencies compile relevant data quickly, without having to wait on long processing times or extra-departmental labor.
2. Ease
With the right analytics and/or BI tool, data blending delivers a lot of power based on a relatively low lift or cost (more on this in a moment).
3. Flexibility
Since data sources do not need to be physically combined and can easily be re-combined and experimented with on the fly, data blending is a great match for busy agencies that often need to pivot fast within and across campaigns.
4. Cost
Since blended data sources are less process–and labor–intensive than data integration, costs are usually limited to reasonably-priced charges for your data sources, software, and labor from whoever within your organization is running reports. That person won’t need as technical of a background as they might have needed ten years ago when combining data was a more intensive process.
5. Consolidation
Across client organizations and even within an agency itself, data siloing is an issue that could block clear reporting and analysis. With data blending, breaking down silos is made that much easier. Simple access is all that’s required to combine sources (as opposed to tracking usernames and passwords across a multitude of client accounts).
6. Impact on revenue
Ready, regular, speedy access to actionable data empowers agencies to serve and advise clients more intelligently, often resulting in higher revenues for campaigns. That’s the reason why we’re here in the first place!
Limitations of Data Blending
Despite the power and popularity of data blending, there are a few limitations to the practice that it would be good to keep in mind.
1. Depth
Data blending has been shown to get glitchy once the number of data sources begins to pile up. This can also apply to large amounts of data within a single source, such as thousands of new subscribers in a given month. Trying to blend that amount of data on the fly can lead to errors and timeouts.
Once that happens, however, any troubles you experience may be due to the evolution of your data blend into an approach more suited to data integration. At that point, you need to decide if you’ve allowed your analyses to get too complex or if it’s worth the extra time and money to get more advanced.
2. Control
With data blending, you might not control many (or even most) of your data sources. While it might be reasonable to expect data from Google or Meta to serve most of your needs, ultimately, any bugs from an outside data source that creep into your data blends will need special attention. Similarly, if a source doesn’t easily aggregate key data you need to blend for some reason, you’ll need to address that before consolidating everything in your analytics tool.
3. Processing
While data blending does allow you to process and deliver analyses, exporting the new data set for additional processing is a more complicated proposition. For advanced applications, you could use additional, specialized software for advanced applications and/or employ experts. But at that point, you are again getting away from the more agency-minded application of data blending and perhaps into organizational-level strategy. Still, it’s important to remember this limitation when considering atypical data use.
The Key Steps to Data Blending With Multiple Data Sources
Software is your friend when it comes to blending data sources. Here are the general steps required to get started:
1. Establish Your Goals
Before you start blending data, define what you want to know and why. Keep in mind that the more complex your data goals are, the more outside of the data-blending box you might find yourself.
Agency Tip: Don’t try to solve all of the world’s data problems the first time around, and keep it focused on what your agency needs to improve client reporting and scale your agency.
2. Obtain All Relevant Data Sources
Most often, this will come in the form of integrations with your analytics and/or BI software of choice. Software automation from leading advertising platforms, CMSs, eComm, and retail platforms have thankfully made data ingest relatively easy and simple. Still, integrations require maintenance, and there are always internal client resources (where applicable) to consider, so check on everything before you blend.
Agency Tip: When creating your first data blends or custom metrics, leave some time for troubleshooting. You want to make sure these formulas are correct from the start rather than having to correct them later.
3. Ensure All Data Is Clean
Whether internally sourced (more control) or externally sourced (less control), you will need clean data that can easily compare. Duplicate info, mislabeled IDs, or incomplete data sets within sources can throw a quick wrench into a blend.
Agency Tip: Most integrations from large, reputable sources should work well most of the time. Make sure your own internal sources match this cleanliness.
4. Join Your Data
This process will vary depending on which software you use. We’ll walk you through two popular options in a moment. Before joining sources, ensure that the data is as clean as possible (such as removing test campaigns from four years ago) and that they match in the ways that will take advantage of your data blend.
Agency Tip: If you're moving from a manual method of data blending (such as using spreadsheets) to an automated data blending platform, a good way to spot check errors is by comparing the two during the transition period.
5. Generate Visualizations/Reports
Again, your method of doing this will be slightly different depending on what analytics or BI tool you’re using. If you experience any errors or suspect something is wrong when presented with results, go back to previous steps and fix any errors or identify where a custom solution might be needed.
Agency Tip: Charts and graphs often tell the data story faster and easier than a table with a lot of numbers. Use widgets, custom goals, and other visualization options to help clients absorb the key information in less time and with less effort.
How To Blend Data With Data Studio
Google Data Studio (now Looker Studio) has become a popular tool for blending. It’s not without its limitations, but there’s no getting around how much breadth and scope is afforded by utilizing a solution built by the biggest name in ad data.
The quick and easy way to blend data in Data Studio is to identify two separate visualizations (charts) you’ve already created, select them both, and right-click to “Blend data.” That might work in a pinch under certain circumstances, but you’ll probably need to do more. The common process for blending data in Google Data Studio proceeds as follows:
Click “Resource” and then “Manage blended data.”
Click “Add a data view.”
Select or search for the first data source.
Click “Add another data source.” Repeat as needed to add more sources.
Select a join key (or keys) available in both/all sources.
Select the dimensions and metrics you want to compare.
Adjust/confirm settings and save.
Your new blended source will show when you select “Data source” for new charts.
There are many reasons why this powerful–and free–tool is popular with young or startup agencies. However, with great power comes a significant amount of manual work, creeping inflexibility, steep learning curves, and broken reports.
How AgencyAnalytics Differentiates Data Blending
AgencyAnalytics is focused on making performance measurement as direct and easy as possible. We also know that fast-moving agencies require efficiency and accuracy with their reporting.
That’s why data-blending in AgencyAnalytics is handled with a metrics-out POV.
Rather than comparing metrics from internal project documentation to charts produced within something like Data Studio, the custom metrics widget gets straight to the important work–all within your AgencyAnalytics dashboard.
To blend data for one of your core metrics within AgencyAnalytics:
Click “Settings” on the bottom of your screen.
Click on “Custom Metrics” and “Create Metric.”
Click “Create a new custom metric.”
Fill out the form fields that match your needs. (For more help on this section, go here.)
Click “Create.”
Repeat the process above any time you need to measure a new metric or set of metrics from blended data.
Once you're done creating custom metrics, simply add the results to any client dashboard. Available data sources will depend on which integrations you’ve added to your account from the over 80 marketing platforms available. For example, here are a couple of the most popular custom metrics created by marketing agencies.
Example of Data Blending: Total Ad Spend
Evaluate your ad spend across all your platforms and campaigns. Platforms used in this example: Microsoft Ads, Facebook Ads, Google Ads, Twitter Ads, and LinkedIn Ads.
Metrics:
Microsoft Advertising Cost (campaign analytics)
Facebook Ads Amount Spent
Google Ads Cost (ad analytics)
LinkedIn Ads Cost
Formula: Microsoft Advertising Cost + Facebook Ads Amount Spent + Google Ads Cost + LinkedIn Ads Cost
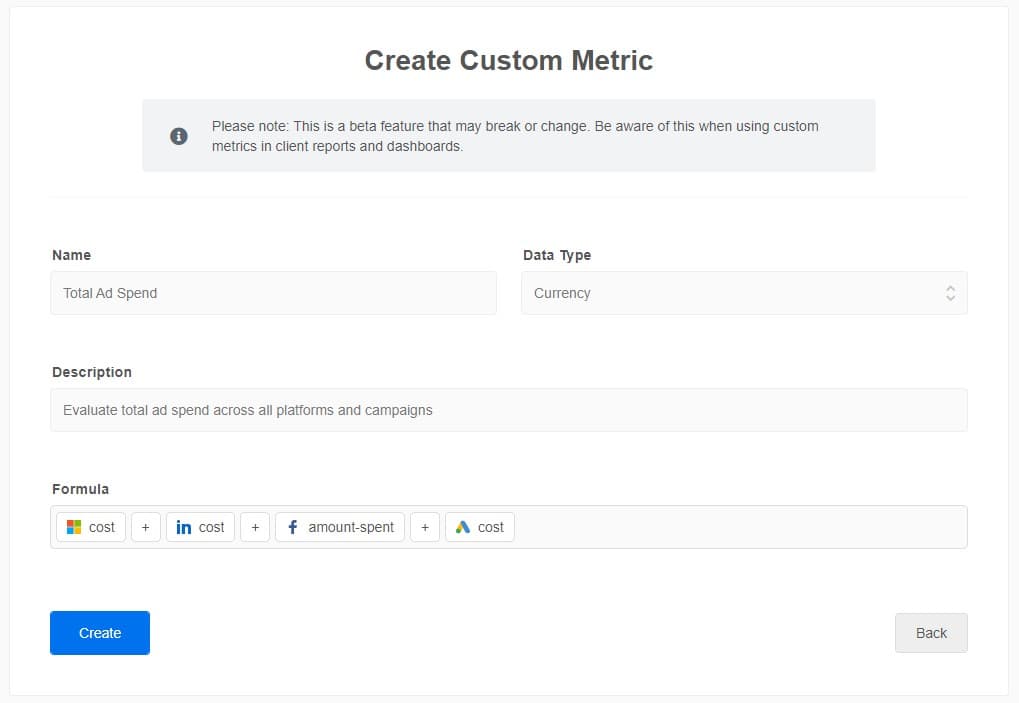
Agency Tip: Need to update a custom metric? No problem at all, simply select the custom metric you need to change and click the Update button.
Example of Data Blending: Cost Revenue Ratio
Measure the efficiency of your expenses to your client’s earnings.
Platforms used in this example: Google Ads, Facebook Ads, Shopify
Metrics:
Shopify Total Sales
Facebook Ads Amount Spent
Google Ads Cost (ad analytics)
Formula: (Google Ads Cost (ad analytics) + Facebook Ads Amount Spent) / Shopify Total Sales
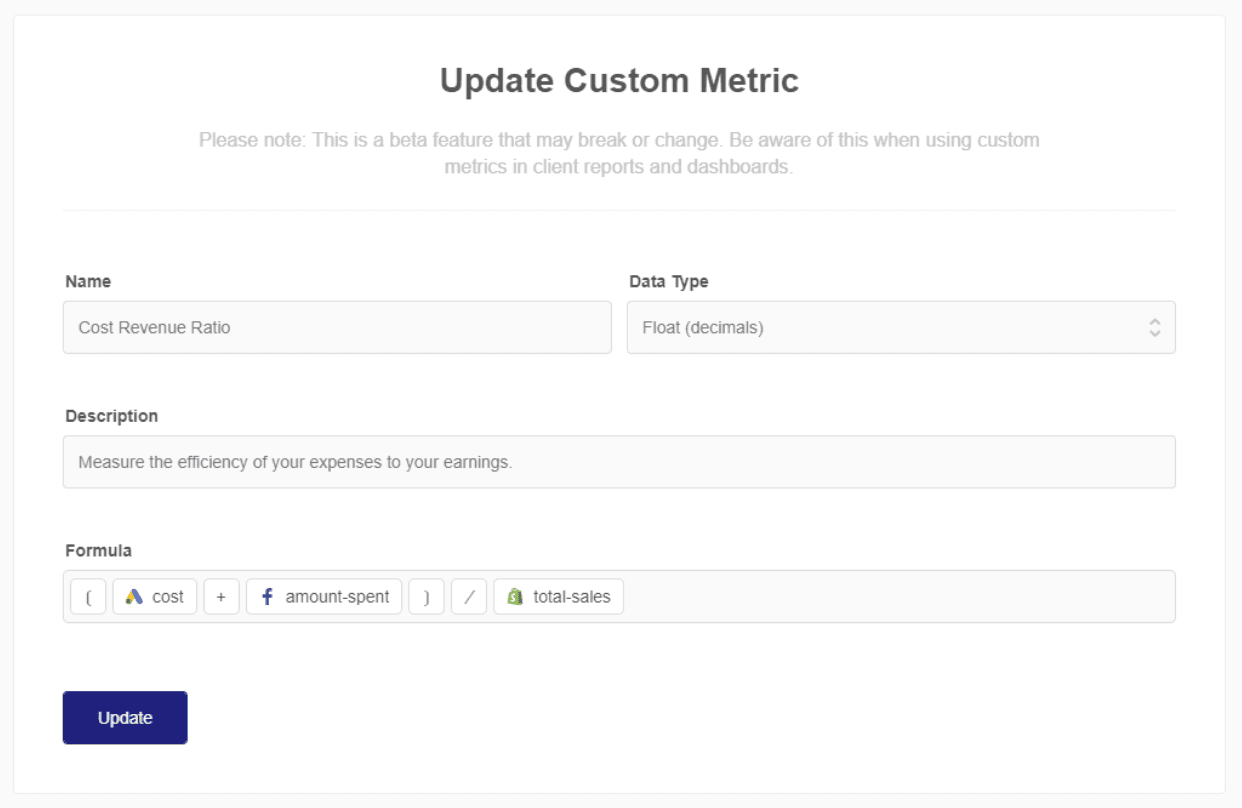
For illustrations of more specific scenarios you can run, check out our list of some example formulas.
Summary and Key Takeaways
Data blending helps agencies improve reporting, campaign optimization, and client relationships. By combining data from different sources, agencies have a complete view of their client’s data in one streamlined interface.
Although Data Studio is a popular tool for data blending, it has some limitations and requires much more hands-on data manipulation. In comparison, the AgencyAnalytics platform makes it easy to blend data from different sources and create custom metrics from that data. This helps agencies get the most out of their data and make better decisions for their clients.
Sign up for a 14-day Free Trial today for simplified data blending with AgencyAnalytics.

Written by
Michael DiBiasio is a Marketing and Storytelling Consultant and Content Strategist working out of New York City and Burlington, Vermont. With experience as a Head of Marketing (SaaS, eComm) and as a Video Marketing Lead (professional services), he helps stakeholders find the sweet spot between audience needs and values and their own sales and service goals.
Read more posts by Michael DiBiasioSee how 7,000+ marketing agencies help clients win
Free 14-day trial. No credit card required.


