Table of Contents
QUICK SUMMARY:
Discrete data refers to countable, whole numbers without fractions, which is ideal for tracking distinct and quantifiable elements. In contrast, continuous data includes values that can take on any number within a range–including decimals–suited for precise, variable measurements over time. This overview dives into continuous and discrete data, offering comparisons between the two and their roles in effectively demonstrating value to clients.
Clients want data.
Even clients who don’t understand discrete variables and continuous data want these insights. That’s because they usually feel better about paying your agency when solid results are on the table. And it certainly doesn’t hurt when those numbers are visualized in a way that’s easy on the eyes.
Whether it’s foreseeing a trend or adjusting a strategy, data should influence every decision your team makes. That said, it’s more than collecting a couple of metrics. At the end of the day, your clients will expect (and appreciate) a solid explanation of their marketing performance. The more clearly you connect the data to their goals, the more confident they’ll feel in your partnership.
The good news? There’s no shortage of data to track. In fact, studies suggest that 2.5 quintillion bytes of data are produced globally every day. That's a lot of video streaming, messages being sent, images being posted, and links being clicked! While it’s definitely a handful, there are strategic ways to organize marketing data, make sense of it all, and ultimately, foster client trust.
This article covers two prominent types of quantitative data: Discrete and continuous. We’ll also explore the differences between the two, use cases, and best practices for clear, effective data storytelling.
What Is Numerical Data?
Simply put, numerical data is measurable information expressed in numbers, which is essential for quantitative analysis.
It represents real-world quantities, trends, and metrics that can be analyzed, compared, and visualized. This data is categorized into two types–discrete and continuous–each serving distinct purposes.
Regardless of the type, it’s used to evaluate performance, identify trends, and inform decision-making.
Hang On… There Are Different Kinds of Numerical Data?
With so much data out there, it may seem overwhelming to dive into it all. Overly complex datasets that don’t tie back to campaign or business goals? That’s just wasting time. The key is focusing on the numbers that actually move the needle for your clients. It’s why we’re honing in on continuous and discrete data specifically applicable to marketing.
Want to know the exact number of sales a client made last year? Discrete data provides the answer with concrete, definitive figures. On the other hand, if you're measuring the total revenue earned, continuous data captures the precise amount (including any fractional values).
Still not sure what this all means? Not to worry–we’ll take a closer look at each type to gain a deeper understanding.
What Is Discrete Data?
Let’s take a walk down memory lane, back to high school math class.
Discrete data represents items that are countable. In other words, it’s made up of integers, which is a fancy way of saying a whole number, not a fraction. To get even more specific, discrete data is composed of non-negative integers (and, again, non-divisible).
So, if math wasn’t your favorite subject, take a sigh of relief. We’re talking about plain n’ simple, basic, finite, and regular numbers. No decimal points here.
Discrete data counts things like:
The number of unique views on an ad.
The number of landing page visitors who click your client’s CTA today.
The number of contacts who opened a promo email.
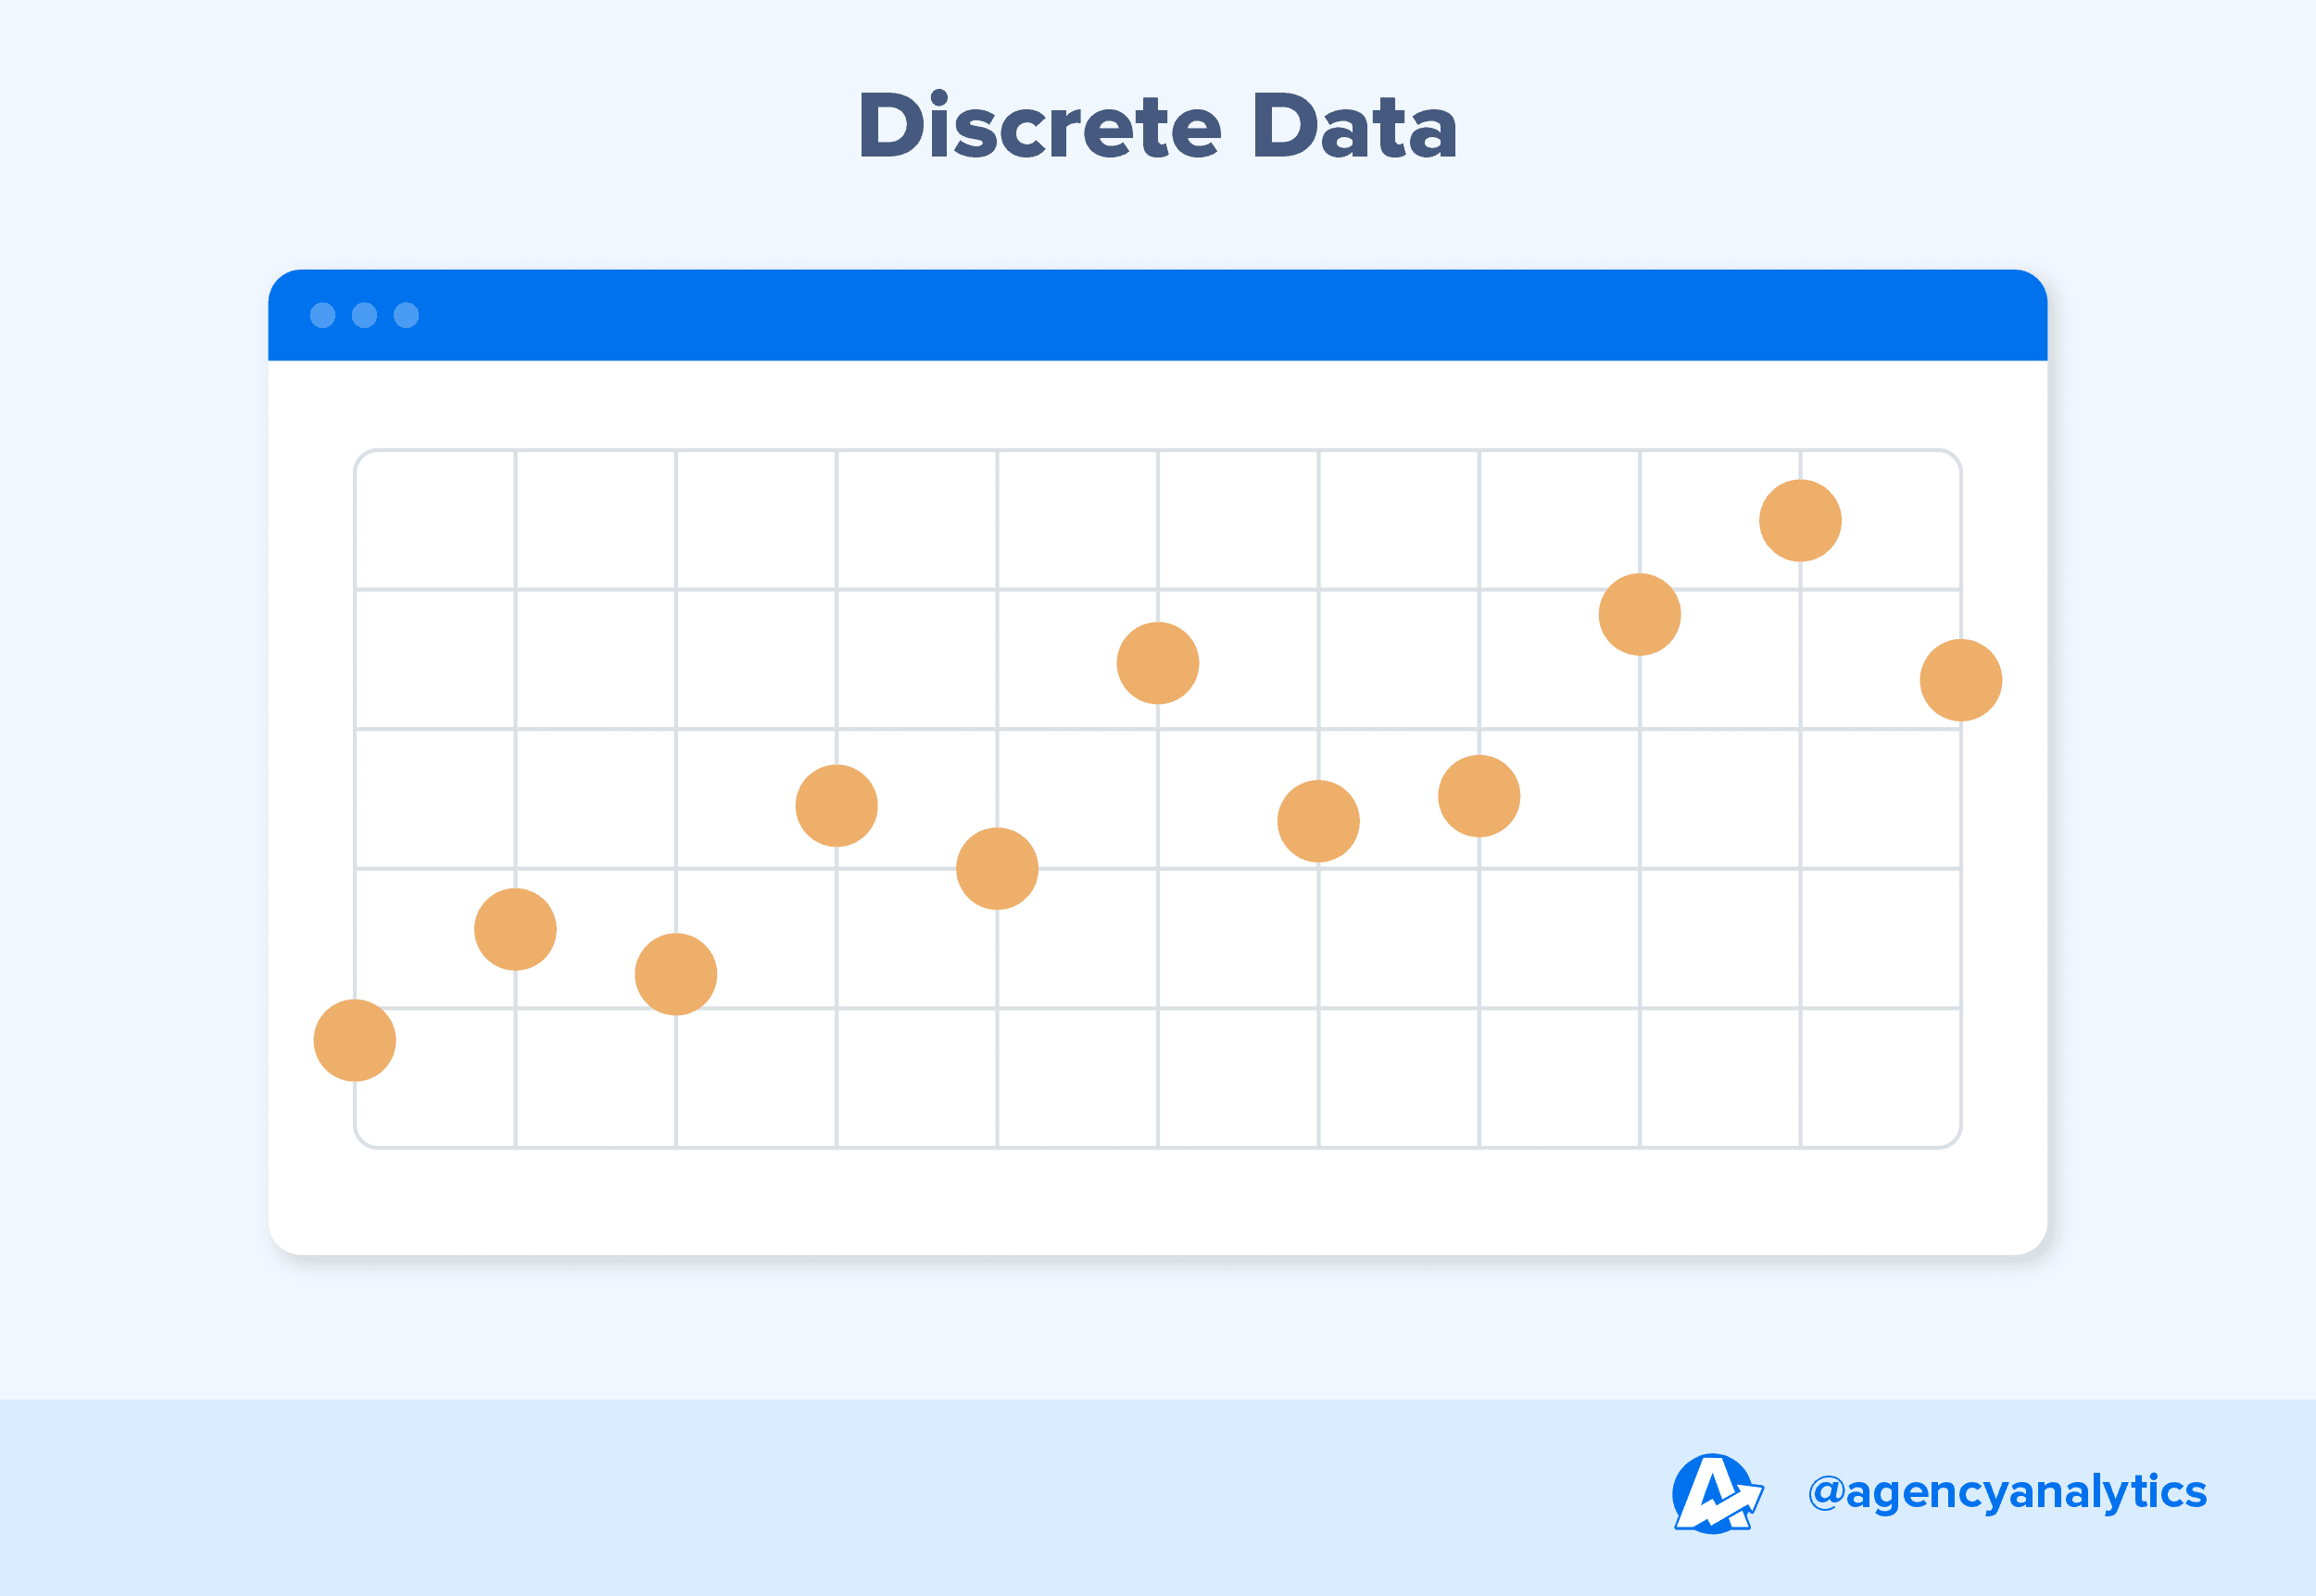
For this reason, discrete data is best suited for a straightforward statistical analysis of all-or-nothing variables. For example, you can’t have half a CTA click. It’s a click, or it’s not. There’s no in-between. Additionally, discrete data lends well to summarizing performance, particularly in bar graphs and pie charts.
What Is Continuous Data?
Then, there’s continuous data—the complete opposite of discrete data.
While discrete data focuses on simple whole numbers, continuous data dives into measurements. It’s all about capturing the values between Point A and Point B, along with the infinite number of possibilities in between. Think of it as the tool for exploring the gray areas, not just the black-and-white points.
Continuous data is ideal for precise measurements, allowing for a granular level of detail. Here, we’re talking about decimal points, variables, and intervals that show how things evolve or fluctuate over time. Unlike discrete data, which is finite and countable, continuous data exists on a scale—perfect for tracking time-based trends or ongoing variables.
Think of it this way: If discrete data answers “how many,” continuous data answers “how much” or “to what extent.”
More specifically, use continuous data to determine things like:
Average time on a landing page in milliseconds.
Conversion rates displayed as percentages.
Customer lifetime value (CLV) over time.
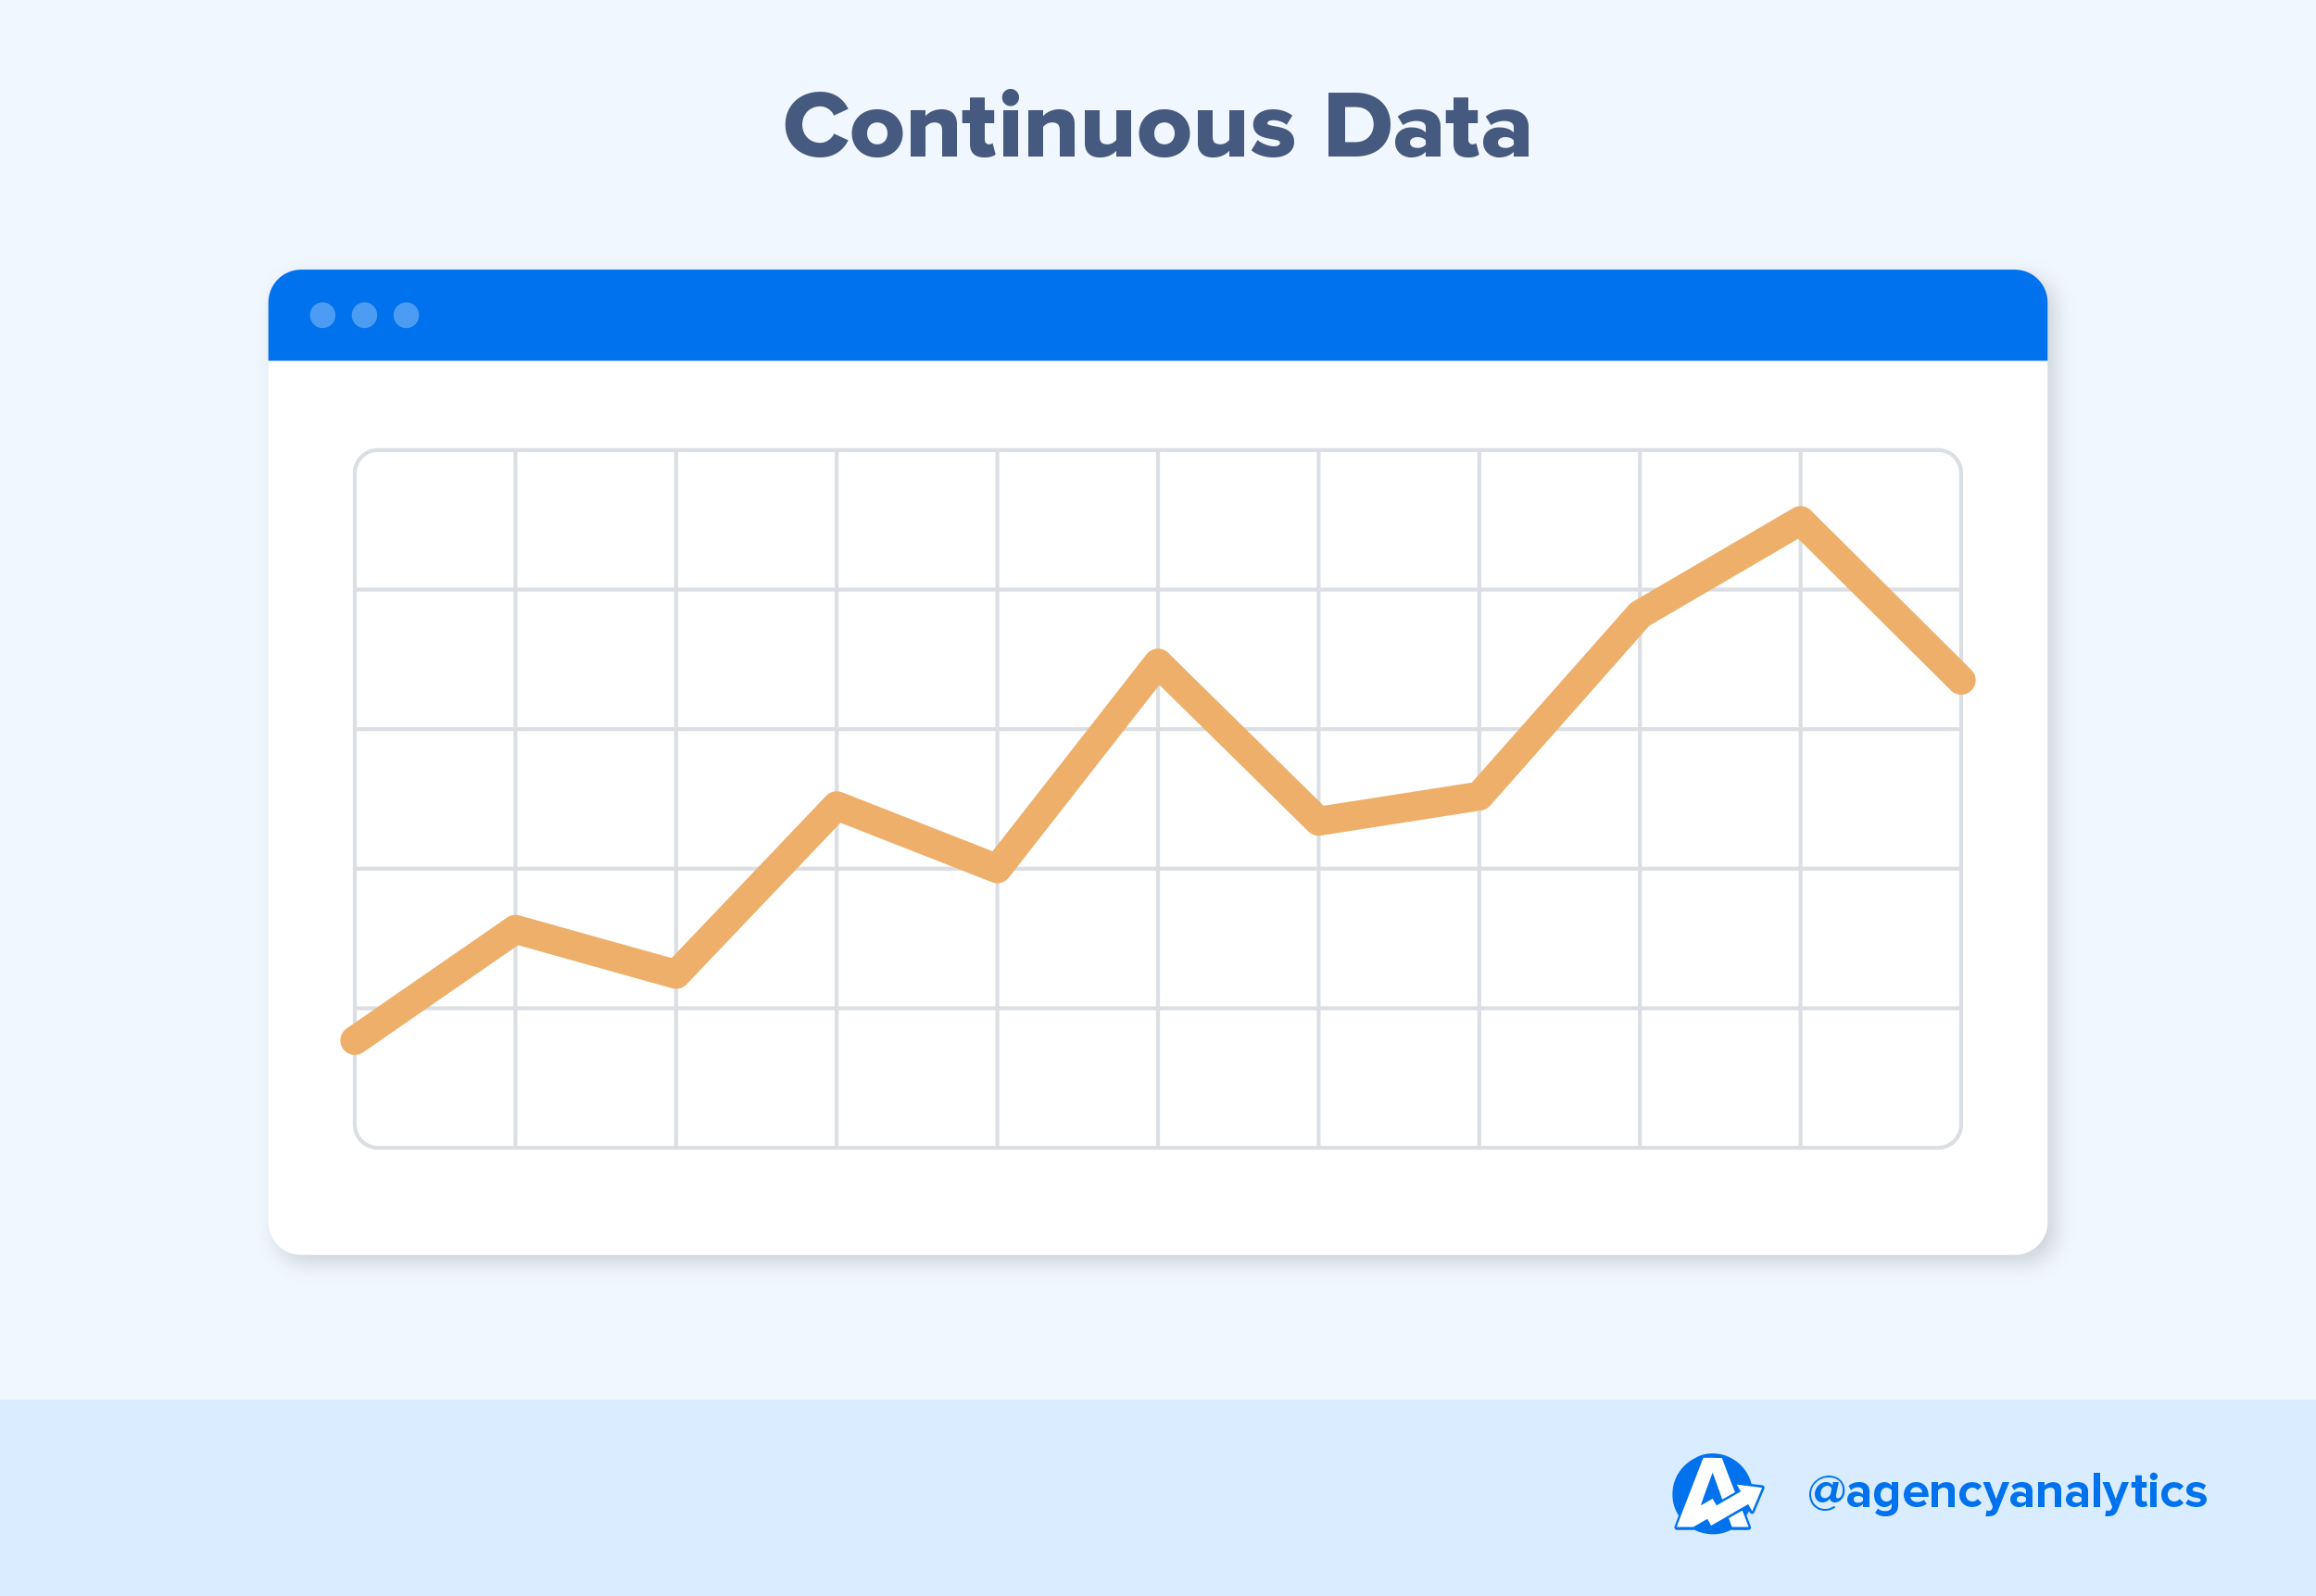
Histograms, line graphs, and control charts are great ways to visually plot continuous data. They reflect a range of different values, making it easier to monitor fluctuations, pinpoint anomalies, and identify opportunities.
Discrete vs. Continuous Data: The Comparison and Differences
Agencies must understand the key differences between discrete and continuous data to make informed decisions. It’s like knowing when to use a ruler versus a stopwatch—both are measuring tools, but they’re meant for different jobs.
So, what sets these data types apart? And how should your agency leverage both to boost client results? Let's break it down in more detail.
Aspect | Discrete Data | Continuous Data |
|---|---|---|
Definition | Countable values that are whole numbers, with no fractions or decimals. | Measurable values that can take any number within a given range, including decimals. |
Key Characteristics | Finite, distinct, and separate values. Changes occur in steps or intervals. | Infinite possible values; changes occur gradually across a scale. |
Visualizations | Bar charts, pie charts, frequency distributions. | Line graphs, histograms, scatter plots. |
Use Cases in Marketing | Tracking specific actions or milestones (e.g., sales made, ads clicked). | Monitoring trends or patterns over time (e.g., ROI, customer lifetime value, audience engagement). |
For reference, here’s a neat graphic visualizing these concepts side-by-side.
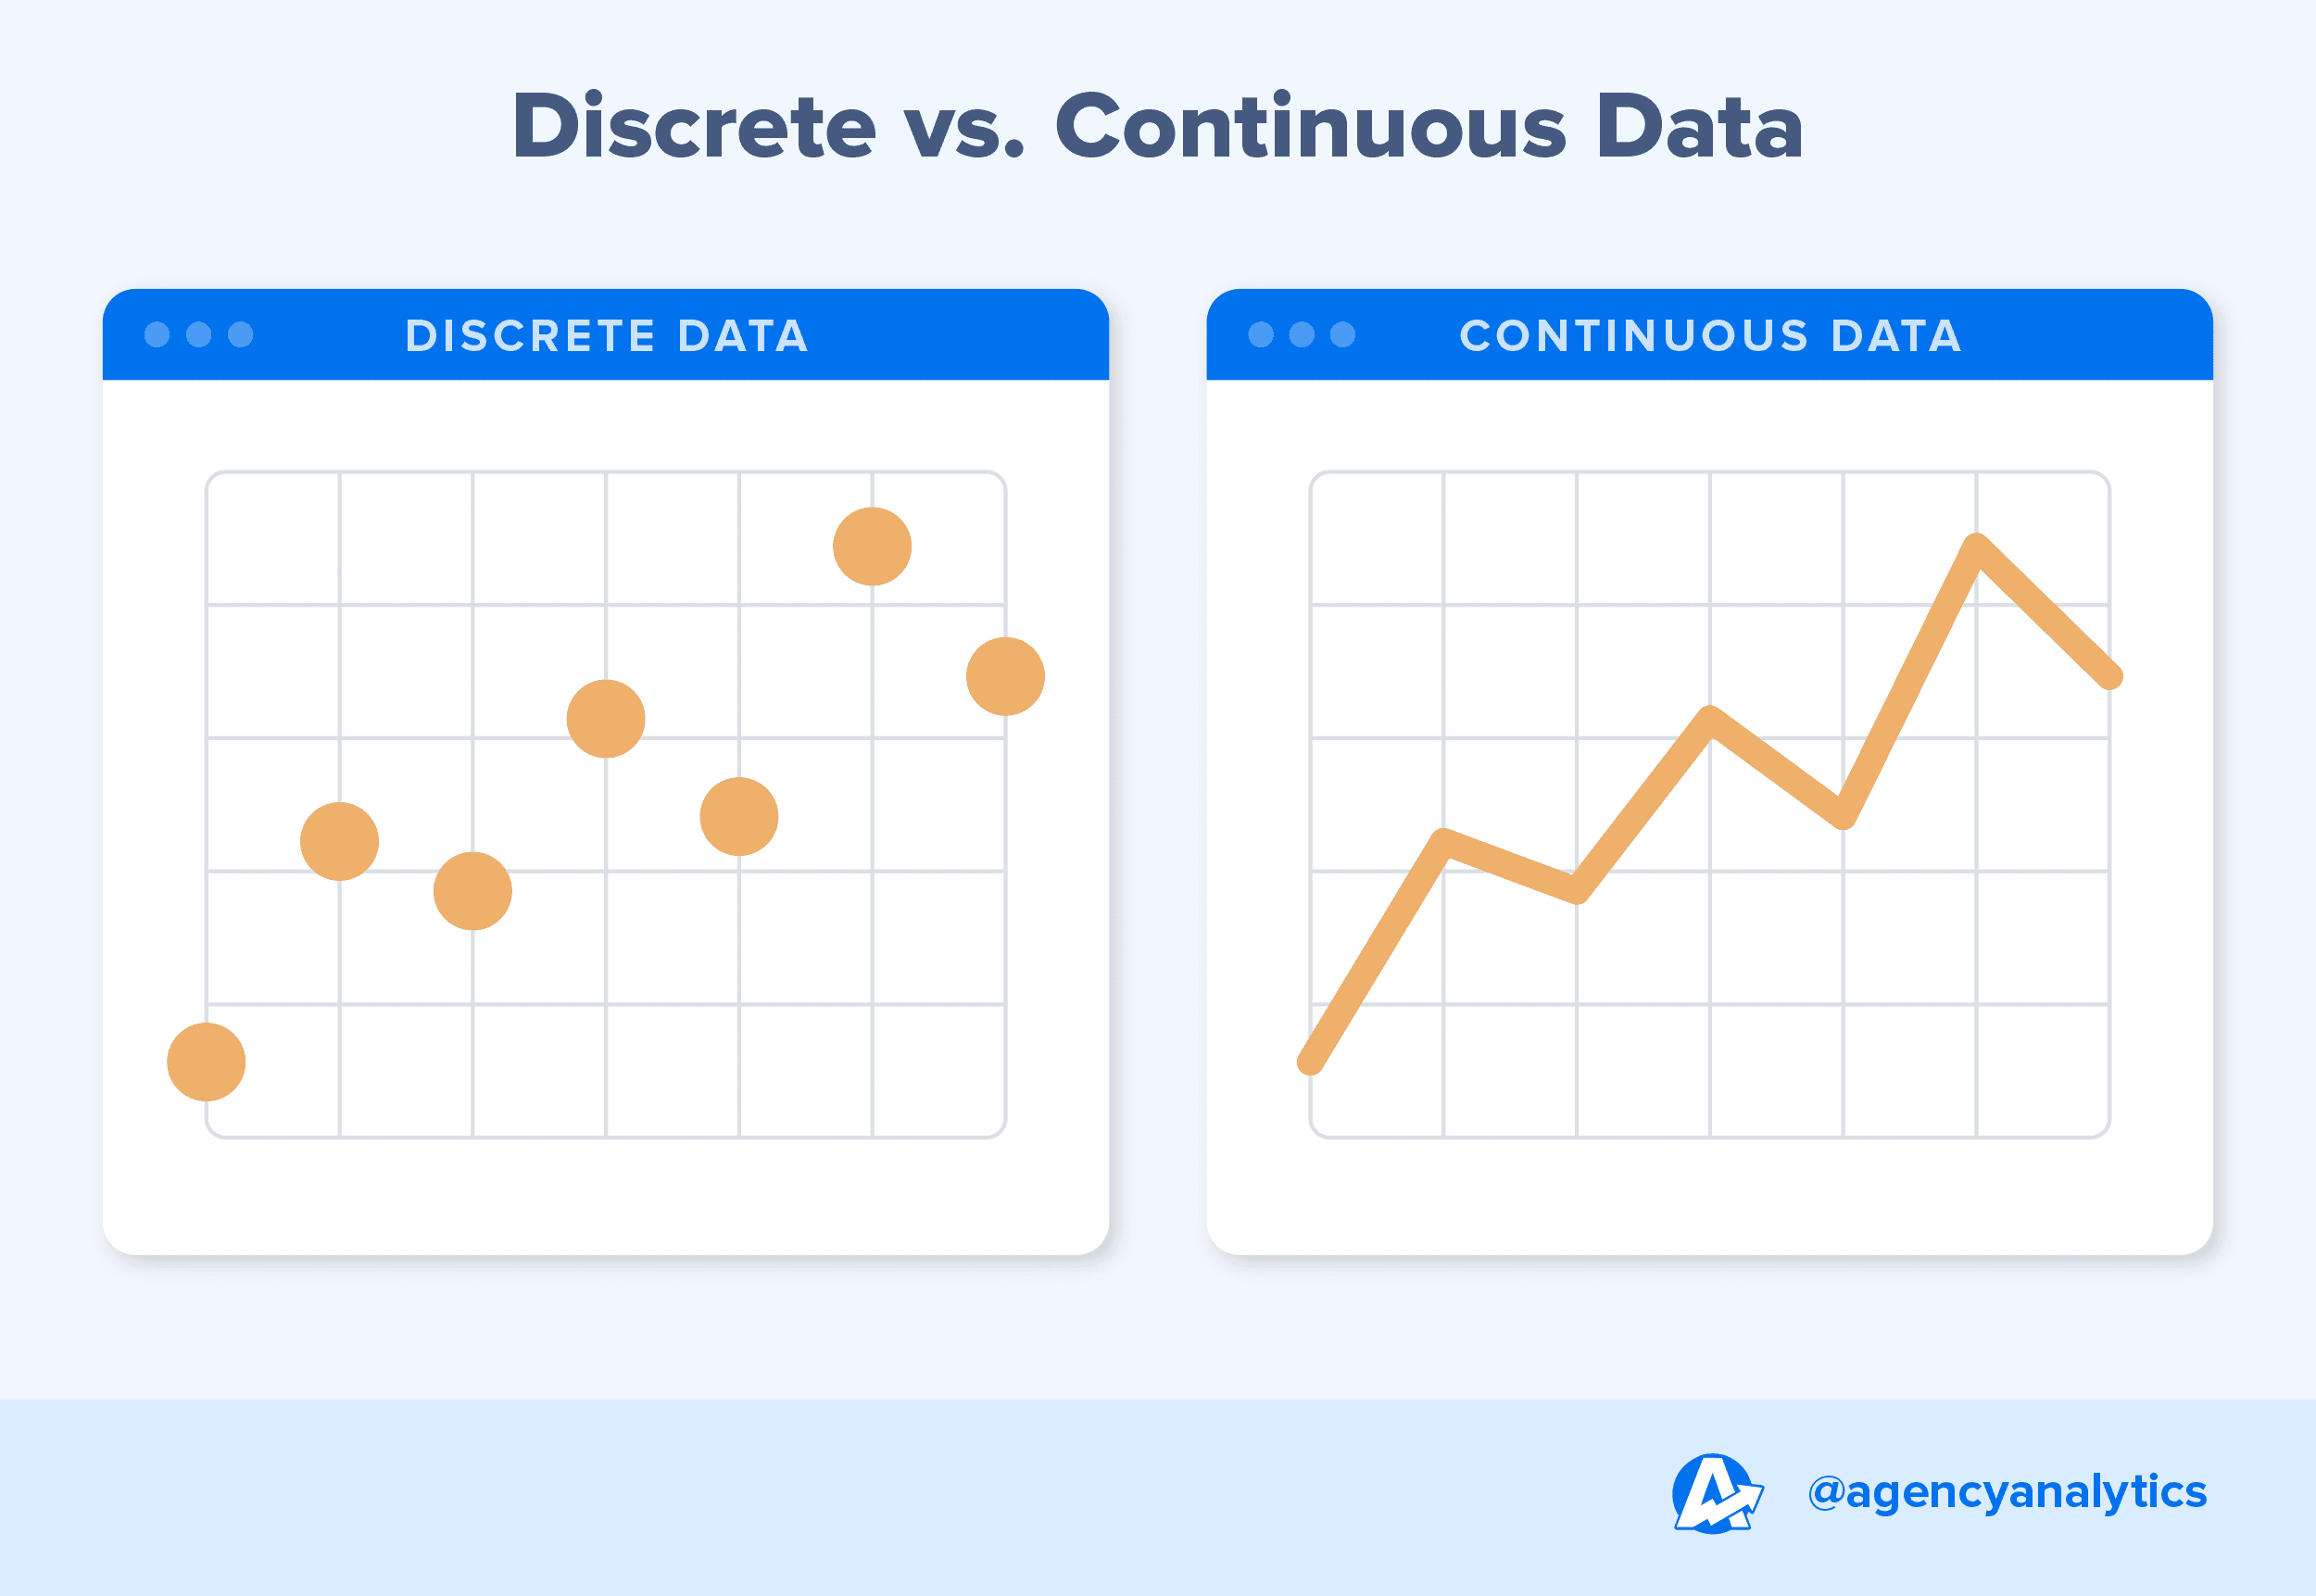
Discrete vs. Continuous Variables
Think of discrete data as your go-to for quick wins and easy client updates. It tracks hard numbers like clicks, views, or downloads—clean and simple, no decimals needed. Want to wow a client with an impressive lead count or online sales? This is the data to focus on.
On the other hand, continuous data is where you’ll discover nuanced insights. It tells the story of trends, averages, and changing performance metrics over time. It’s perfect for identifying performance shifts, optimizing campaigns, and demonstrating long-term progress.
In the end, a strong agency knows how to balance both data types. Whether it’s clicks, conversions, or engagement trends, data helps clients see exactly how their investment is paying off.
Examples of Discrete vs. Continuous Data
Discrete and continuous data play distinct roles, helping teams measure performance, track trends, and optimize campaigns.
Below are examples of how to apply each type in a marketing context.
Discrete Data Examples:
Number of email opens from a newsletter campaign.
Total form submissions on a landing page.
Number of social media shares on a post.
Total purchases made during a flash sale.
Number of advertisement impressions or clicks.
Total leads generated from a webinar.
Count of new followers gained in a week.
Number of customer reviews left after a promotion.

No boring presentations or spreadsheets here! Automate data collection, analyze marketing results, and bring data to life–try AgencyAnalytics today, it’s free for 14 days.
Continuous Data Examples:
Time spent on a website page, measured in seconds or minutes.
Engagement rates over time, such as the percentage of users interacting with a post.
Conversion rates for ecommerce websites, expressed as percentages.
Revenue generated from a seasonal campaign, calculated down to decimals.
Click-through rate (CTR) trends with daily or hourly fluctuations.
Average session duration on a website over a month.
Cost-per-click (CPC) trends for an advertising campaign.
Bounce rates for a specific product page.
Together, these data types are invaluable for crafting strategies, predicting behaviors, and delivering results.
Should You Use Discrete or Continuous Data?
As marketers, we use data to track, test, understand, and validate continuous and discrete data.
It helps us determine what we’re doing right and where we need to course correct. It allows us to segment groups of people and target specific audiences. Additionally, it demonstrates our value to clients.
Most marketing dashboards will include a mix of continuous and discrete data. For more context, let’s take a look at the Google Analytics 4 reporting tool in AgencyAnalytics. At first glance, you’ll be able to quickly identify discrete values from those in a continuous range.

As you’ll see from the above, it’s not a matter of choosing between the two.
Rather, it’s about using both data types to get the most context possible. That exponential time increase in user sessions? Use it to explain trends in finite, categorical data (like the number of returning users or new signups). On the other hand, a noticeable spike in sales could be tied back to an increased time spent on a page after a promotion.
To sum it up, use these data types to tell a complete story. Connect the dots, identify patterns, and tie occurrences to actual outcomes.
How To Utilize Numerical Data
When it comes to discrete and continuous data, there are two main challenges that agencies face:
Collecting and analyzing data (especially with discrete and continuous variables at play).
Perfecting the art of data storytelling.
Not sure how to get past these hurdles? Here are solution-based explanations to consider.
Collect the Right Data
Let’s be real–collecting continuous data is quite a heavy lift.
For starters, it involves piecing together data across multiple platforms and housing it in one place. When you’ve got deliverables to execute and deadlines to meet, this simply isn’t a feasible (or fun) exercise.
There are plenty of possible failure points along the way, too, like:
Data Silos: Platforms that don’t integrate easily, leading to incomplete datasets.
Inconsistent Formats: Data might need to be cleaned or standardized before use.
Human Error: Manual data entry or analysis increases the risk of mistakes.
Aside from this being a time-consuming exercise, there may also be hidden costs for some of these data extraction tools (e.g., add-on charges for platform integrations). And don’t forget–miss any data source, and you won’t get a comprehensive understanding of what’s happening.
Instead of getting bogged down with manual work, use a tool that automatically consolidates those valuable insights in one place. That way, you’ll have a reliable data pipeline at your fingertips, giving you more time to focus on high-level work.
Make Use of Data Storytelling
Here’s another pain point: If you’re manually gathering raw data, that’s just one piece of the puzzle. You still need to figure out what it all means.
When you’re managing a growing roster of clients, it means an increased data volume. And–you guessed it–more numbers to interpret. In these cases, relying on Excel workbooks or free tools won’t cut it. They simply won’t provide the sophistication, visualization capabilities, and automation features you’ll need to get the job done well.
How you share data matters, too–we’ve all dozed off during a boring, numbers-heavy PowerPoint presentation. And most of us have seen clients get a little frustrated when we’re unable to explain something in a way that clicks. Clients aside, your team is a part of the equation, too. Realistically, they don’t want to stare at a screen of clunky numbers, attempting to interpret what it all means. And honestly speaking, they shouldn’t have to.
The solution? Use a client reporting tool that does most of the data storytelling for you. Take AgencyAnalytics, for example. In a few clicks, it’s easy to:
Generate AI-Powered Insights Specific to Each Client Campaign: Use the built-in Ask AI feature to highlight successes, areas for improvement, and even unnoticed wins–all without hours of manual analysis.
Create an AI Summary That Distills Complex Datasets Into Clear, Concise Takeaways: No need to create a manual text overview. Let AI Summary do the heavy lifting and analyze the data for you!
Using the AI features in AgencyAnalytics helps us summarize a client report much faster than reading through results, typing up an email, and sending it to the client. The predictive analytics in Ask AI has certainly increased our productivity, helping us to do things much faster.
Kevin Watts, Founder, Raincross
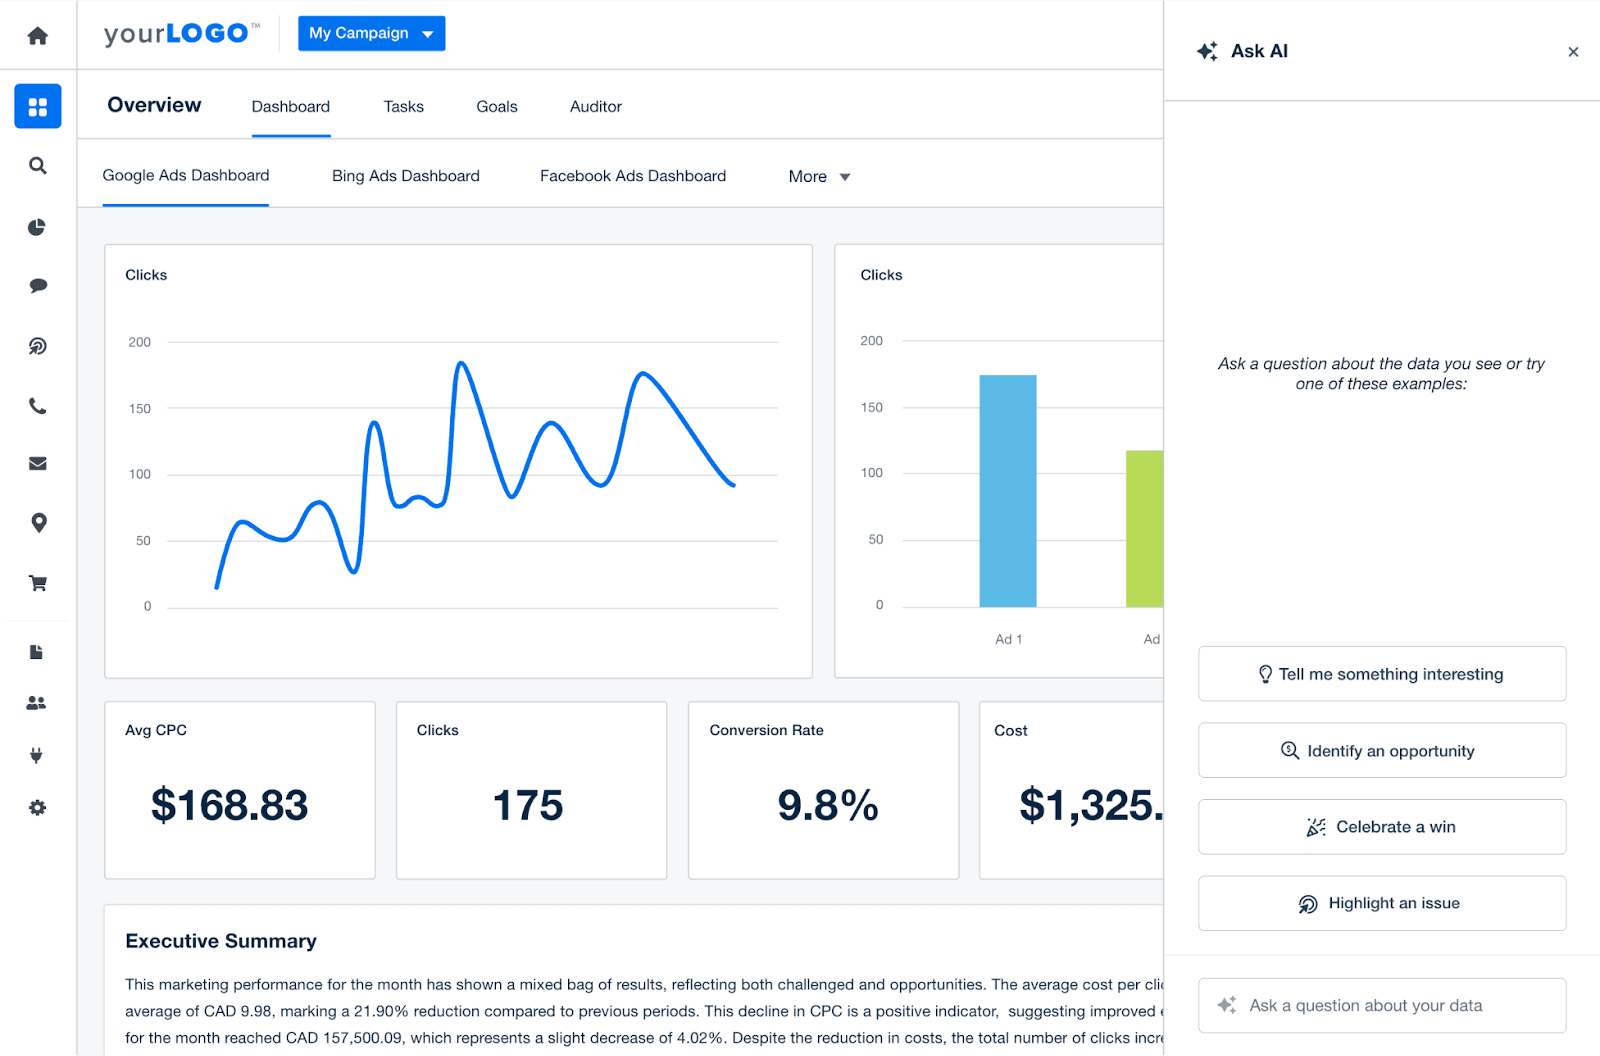
Analyzing data doesn’t have to take all day. Use Ask AI to generate key takeaways and speed up the entire reporting process! Explore everything AgencyAnalytics has to offer–sign up for a free 14-day trial today.
The Shortcut to Mastering Discrete and Continuous Data
To summarize, you’ll need a strong grasp of discrete and continuous to impress clients. Either way, though, they probably won’t care what it’s called.
What truly matters is your ability to collect, monitor, analyze, and present that data effectively. Instead of presenting some unsightly spreadsheet, invest in a robust client reporting tool like AgencyAnalytics. Use it to:
Automate Data Retrieval Across 80+ Marketing Channels: Skip the hassle of switching between platforms or managing excessive manual work. Instead, pull client data into one unified hub.
Generate AI-Powered Insights That Reflect Each Client’s Unique Data: Quickly uncover campaign successes, areas for improvement, and interesting findings–all in a couple of seconds. Even create a text-based summary that gets straight to the point!
Monitor Ongoing Campaign Performance via Real-Time Dashboards: Keep on the pulse of marketing performance through a visual, intuitive interface. Take transparency up a notch by granting login access, allowing clients to check on campaigns whenever they choose.
Move Beyond Campaign-Specific Data and Share Macro Context: Compare client results to reliable industry benchmarks–fueled from data across 150,000+ campaigns on the AgencyAnalytics platform.
Mastering discrete and continuous data doesn’t have to be a struggle. Streamline data collection, uncover actionable insights, and help clients make data-driven decisions–all with one platform.
Ready to improve your operational efficiency? Sign up for a free 14-day trial and see the difference AgencyAnalytics makes!

Written by
Elyse Gagné develops branding and content strategies that unite businesses with their customers. A podcast junkie, you'll find her learning about the latest technologies and brand storytelling techniques while she gardens or hikes.
Read more posts by Elyse GagnéSee how 7,000+ marketing agencies help clients win
Free 14-day trial. No credit card required.


