Average Time on Page
Performance Tracking
Measure, track, and compare all pages and content types.
Optimize
Implement content best practices to improve time on page and conversion rates.
Content Audit
Identify the most popular pages and replicate their success.
Custom Messaging
Leverage user behavior insights for better targeting and segmentation.
Why Average Time on Page Is Important
Average Time on Page provides critical insights into user engagement and content quality. It measures the average time spent on a particular website page and typically varies by content, page type, and industry.
In essence, Average Time on Page indicates the usefulness and value provided by the page based on the average amount users spend on the page. If there’s a sudden increase or decrease, it’s always worth investigating.
Average Time on Page shows the overall performance of a website page at a glance, and improving it drives increased content engagement, conversions, and a better user experience overall. And not only on the specific page–repeat the process and improve similar pages across an entire website.
Stop Wasting Time on Manual Reports... Get Insights Faster With AgencyAnalytics
How Average Time on Page Relates To Other KPIs
Average Time on Page directly impacts other key performance indicators (KPIs) related to user engagement, such as Average Time on Website, Scroll Depth, Engaged Sessions, Page and Session Duration, Bounce Rate, and Dwell Time. For example, Average Session Duration measures the entire length of the user’s session across multiple pages.
Although this KPI falls under the engagement bucket, unlike Bounce Rate–which measures how often users exit pages without taking any additional actions–Average Time on Page measures the time a user spends on that web page. Although Google Analytics 4 adjusted their bounce rate metric to count engaged vs. non-engaged users, it still doesn’t provide as much insight into how engaging a page is.
A change in Average Time on Page could be a big red flag or a waving green flag, depending on the page. But generally, a higher Average Time on Page means better engagement.
One of the ways we utilize AgencyAnalytics is to compare our month-to-month engagement numbers using the reports we send to clients.
How To Calculate Average Time on Page
Many analytics platforms calculate Average Time on Page for marketing agencies, but understanding how this is calculated provides a deeper understanding of this important metric.
Although it may be tempting to look at the website's average time spent per page as an aggregate, understanding the differences between content types–or even the first page vs. the last page visited–helps fine tune and improve average session duration.
Average Time on Page Formula Example
What Is a Good Average Time on Page?
In general, agencies want a higher Average Time on Page because it indicates that the content is engaging, relevant, or useful enough that users are spending more time engaging with the content. The most commonly cited Average Time on Page across all industries and page types is between 52 and 54 seconds.
For blogs, agencies want a higher Average Time on Page. Depending on the length of the blog posts, aim for 3-5 minutes. 10 minutes or above would be amazing.
In some cases, a high Average Time on Page is not ideal. For example, users shouldn’t be spending five minutes on a Checkout page looking for the CTA button.
What Is a Bad Average Time on Page?
Generally, a lower Average Time on Page indicates that users aren’t as engaged as they could be, potentially decreasing conversions.
But sometimes, a lower Average Time on Page is good because it shows that the page quickly guides users to a desired action, for example, a quick intake form that’s easy to fill out before purchasing.
For eCommerce pages, which includes Checkout, Log-in, and Product pages, agencies generally want to aim for 52 to 54 seconds, so anything over 70-90 seconds could be considered bad.
Digging Deeper into Average Time on Page
To dig deeper into Average Time on Page, consider segmenting the data by source, mobile devices, or user demographics. This provides insights into which audiences engage most with the content. Furthermore, comparing average session duration counts across different pages highlights which content resonates most with visitors.
For a holistic view, find average session duration data for the entire website and compare it to individual page durations. This comparison uncovers potential bottlenecks or standout pages, guiding content strategy and optimization efforts.
Why Average Time on Page Matters to Clients
Clients invest in digital strategies to capture and retain their target audience's attention. Average Time on Page serves as a direct reflection of this. If visitors linger on a page, it often suggests the content resonates, successfully holding their interest. Conversely, a brief duration might indicate a mismatch between audience expectations and content delivery.
For clients, this metric acts as a pulse check, signaling whether their content effectively engages their audience. Improved Average Time on Page also shows clients that they’re getting a good return on investment in working with the agency, and benchmarking against industry standards and competitor data will show clients how they compare to their rivals.

Why Average Time on Page Matters to Agencies
For agencies, Average Time on Page isn't just about content resonance—it's about fine-tuning. This metric provides a window into user behavior, guiding content strategies and optimization efforts.
A key goal for agencies is driving more traffic to clients’ websites, and Average Time on Page gives clients a better idea of user behavior on specific pages. When paired with other metrics, such as Session Duration and Scroll Depth, it paints a fuller picture of the user’s intentions and mindstate when interacting with different pages.
If a page underperforms, agencies delve into design, layout, or content elements that might be causing friction. On the flip side, pages with high Average Time on Page serve as blueprints for replicating success. This data also aids in A/B testing, helping agencies determine which content variations drive the most engagement.

Automatically Pull Data From {{integration-count}}+ Marketing Platforms To Create Client Reports in Minutes.
Best Practices Analyzing and Reporting on Average Time on Page
Analyzing Average Time on Page for different pages provides a baseline for optimizing content, identify top-performing content for different types of campaigns, and reporting successes to clients.
Measure Over Time
Monitoring Average Time on Page over time offers valuable insights into the effectiveness of the content and any changes made to optimize it. For example, if an optimized customer login page improves the process and make it as fast as possible for users to sign in, a decrease in Average Time on Page would be a win.
Analyze Across Channels
Different channels and campaigns fit different purposes, and the Average Time on Page will be a reflection of that. Comparing the Average Time on Page for blogs, product pages, login pages, and help pages–for example–will help identify the most engaging pages on a website, then apply the winning aspects to similar pages.
Visualize Performance
One of the best ways to visualize Average Time on Page is tracking it over time and presenting it in the form of a graph or chart. Visuals help illustrate what’s going on beyond the numbers, while adding more context and making the metric easier to understand for visual learners.
Interpret Trends and Anomalies
As with most metrics, any sudden spikes or drops in Average Time on Page should be investigated–especially if it was unexpected. There are many different reasons that could cause a sudden change, and they’re not always obvious–agencies might have to do some digging.
Put In Context
Present the Average Time on Page within the context of other metrics that give a deeper understanding of the story, such as Scroll Depth and conversion rate. Pairing the Average Time on Page with metrics that connect the dots to overall performance provide valuable context.
Align With Client Goals
It’s important to tie Average Time on Page back to the client’s campaign goals and business objectives. If a client’s goal is to increase engagement on their blog, Average Time on Page provides a perfect metric to demonstrate that even visitors are engaging with and absorbing the content.
FAQs About Average Time on Page
Still have questions about Average Time on Page? Don’t worry—we’ve got you covered.
Average Time on Page measures how long visitors typically spend on a website's specific page. It’s a key engagement metric that reveals deeper user interest, helping agencies assess content quality and relevance.
Average Time on Page indicates whether users find a page valuable or engaging. By understanding the types of content that perform best, agencies replicate successful formats and improve underperforming pages.
A low Average Time on Page often signals that users aren’t connecting with the content. This may lead to higher bounce rates and fewer conversions. It also suggests that there are design, content, or formatting issues.
To increase Average Time on Page, use a clear structure, engaging visuals, and internal links to keep visitors interested. Align content with user intent to maintain relevance throughout.
Average Time on Page measures how long users stay on a page, while Bounce Rate tracks how many leave without further interaction. A low Average Time on Page combined with a high Bounce Rate often signals weak or irrelevant content. A high Average Time on Page with a high Bounce Rate likely means users found what they needed without navigating further.
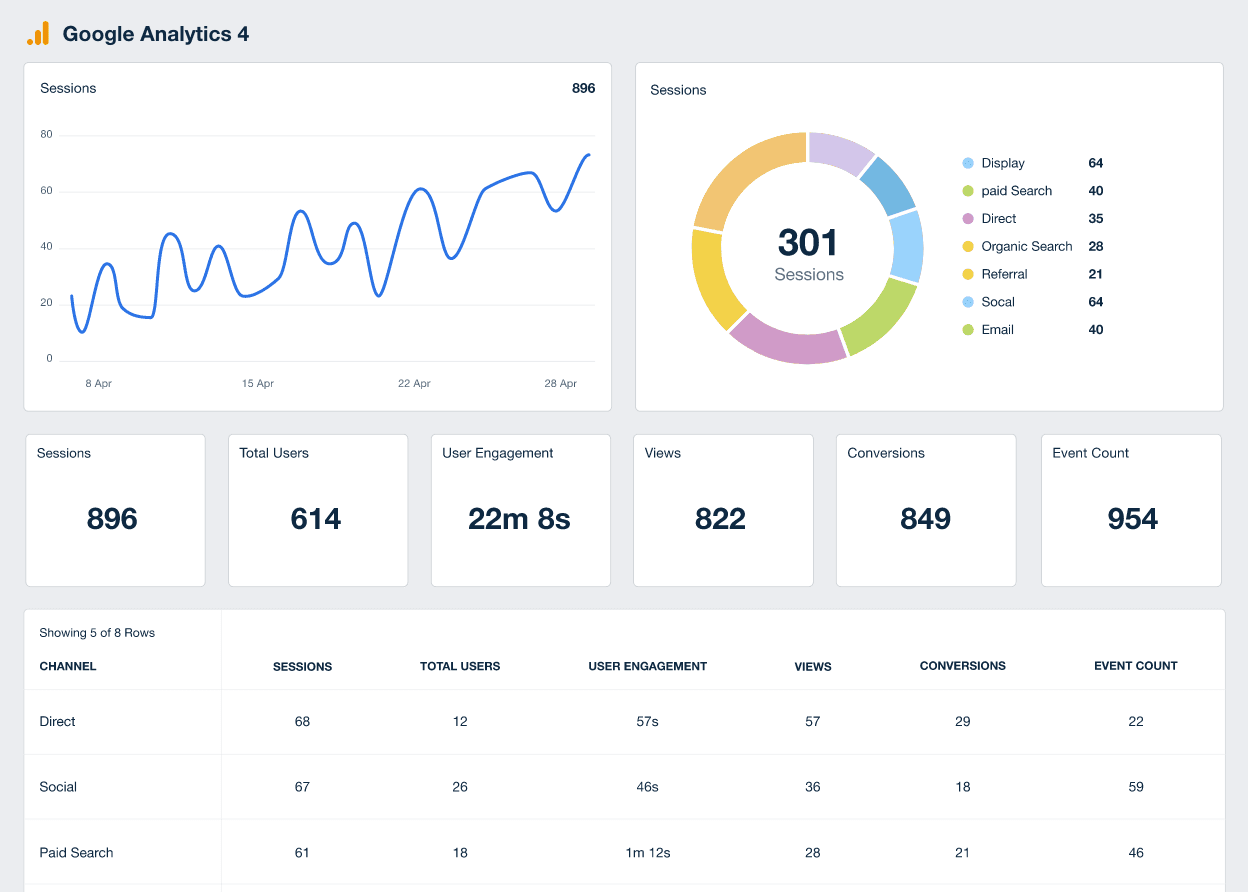
Google Analytics 4 Dashboard Example
Related Integrations
How To Improve Average Time on Page
Improving the Average Time on Page involves different tactics depending on whether the goal is to increase or lower it. Here are 3 quick tips for increasing the Average Time on Page.
Create Engaging Content
Focus on quality, not quantity, and try to use visuals that break up the text to improve readability.
Structure The Content
Use headings, bullet points, numbered lists, and paragraphs to organize the content and optimize it for user experience.
User Recommendations
Recommend similar content and display snippets of the type of content that’s popular with users. Internal links will also help boost overall session duration.
Related Blog Posts
See how 7,000+ marketing agencies help clients win
Free 14-day trial. No credit card required.


