Scroll Depth
CTA Placement
Analyze how far most visitors scroll on web pages to determine the optimal placement of CTAs.
Page Length Analysis
Use Scroll Depth to gauge whether a web page is too long or short.
A/B Testing
Compare Scroll Depths of different page layouts to understand which version resonates most.
Content Optimization
Identify which parts of a web page hold the most interest for users and optimize content accordingly.
Why Scroll Depth Is Important
Scroll Depth is a critical website analytic since it reveals clear patterns of visitor engagement. When visitors consistently engage with an entire page, it suggests that on-page content successfully captures attention.
Conversely, limited scrolling may highlight underlying issues with content or design. By monitoring Scroll Depth, timely adjustments are made to ensure content has maximum impact and inspires user actions, like further engagement or completing a conversion, for example.
Stop Wasting Time on Manual Reports... Get Insights Faster With AgencyAnalytics
How Scroll Depth Relates To Other KPIs
Scroll Depth is intrinsically linked with Bounce Rate and Time on Page. A high Scroll Depth and a short Time on Page might indicate that visitors are quickly scrolling without truly reading the content.
On the flip side, a low Scroll Depth and long Page Time indicate that users focus on the top section, suggesting information overload or a missing CTA.
Scroll Depth also affects Conversion Rates. If a CTA is lower on a page and most visitors don't scroll to it, conversions will suffer.
How to Set Up Scroll Depth Tracking in Google Analytics 4
Implementing scroll tracking in Google Analytics 4 (GA4) is essential for understanding user engagement on a website. Tracking scroll depth involves using Google Tag Manager (GTM) to measure how far users scroll on a page, providing insights into content effectiveness. First, create a new tag in GTM for GA4 scroll depth tracking. Configure the tag to send scroll events to GA4, specifying the scroll depth threshold percentages that matter most to your analysis, such as 25%, 50%, 75%, and 100%. Next, set up a scroll depth trigger in GTM, defining scroll depth units as percentages or pixels to capture the precise points at which user scrolls are measured. This trigger activates the tag to fire scroll events, allowing GA4 to measure scroll depth and report the data. By measuring scroll depth, you gain a clear picture of how content holds user attention, enabling data-driven decisions to optimize user engagement and content strategy.
Since mobile is the name of the game, make sure that you’ve got the proper amount of content to keep readers engaged, either through concise formatting (breaking up content into digestible paragraphs), images to break up the text, and keeping it short enough so that users don’t get scroll fatigue. Keep it concise but informative and always try to pique their interest above the fold.
How To Track Scroll Depth Data
Tools like Google Analytics automatically track Scroll Depth with the help of tracking codes embedded on web pages.
While it’s a challenge to calculate this manually, here’s a formula to provide a better understanding of how it works.
Scroll Depth Formula Example
What Is a Good Scroll Depth?
A good Scroll Depth typically ranges between 60-80%.
This indicates that a substantial portion of website visitors engage with the content, navigating most of the web page's length.
To maintain a good Scroll Depth, focus on quality content, an intuitive design, and continuous improvement based on user feedback.
What Is a Bad Scroll Depth?
An average Scroll Depth below 40% signals potential issues.
Visitors might not find the content compelling, or there could be design flaws causing early drop-offs. Improving Scroll Depth requires an iterative approach. Regularly analyze user behavior, make changes based on those findings, and make improvements for better user engagement.
How To Set Scroll Depth Goals and Benchmarks
By analyzing past Scroll Depths and campaign results, agencies set personalized benchmarks. To hit revenue or conversion goals, consider CTA placements and identify the necessary Scroll Depth.
For a deeper understanding of Scroll Depth, evaluate data based on traffic source or device. For instance, mobile users may scroll differently than desktop users. This segmentation offers insights for content optimization.
Why Scroll Depth Matters to Clients
For clients, Scroll Depth is a test for content effectiveness. If potential customers aren't engaging deeply with their web page, they're likely not absorbing the brand message or product details.
If a website is a primary revenue source, understanding Scroll Depth pinpoints where sales tactics are flourishing or floundering. A strong Scroll Depth implies that visitors see the value, making them more likely to convert. It's not just about how far they scroll; it's about how far they're willing to venture into a brand's narrative.
Why Scroll Depth Matters to Agencies
For agencies, Scroll Depth is a window into user behavior. It identifies which content sections pull users in and which parts may push them away. Every scroll percentage gives a clue about website design, placement of CTAs, and overall user experience.
While clients might view Scroll Depth as an end-result metric, agencies see it as actionable data. It's the feedback loop agencies need, highlighting where improvements are required and whether content strategies are working.

Key Factors That Influence Scroll Depth
Pages with engaging, relevant content that hooks the reader from the start tend to see deeper scrolls. The structure of the content also plays a significant role. Short paragraphs, clear headings, and the strategic use of images can make content more digestible, encouraging users to keep scrolling.
Another critical factor is the page's load time. Faster loading pages keep users' attention and reduce bounce rates, directly impacting how far down they scroll. Additionally, the placement of key information or calls to action can influence scroll behavior.
However, keep in mind that a low scroll depth score is not always a bad thing. If users find what they need quickly, they may not scroll further and may opt to click on a CTA instead, affecting the scroll depth measurements but potentially improving conversion rates.
Best Practices for Analyzing and Reporting on Scroll Depth
By adhering to these best practices, agencies ensure their backlink reports are impactful, insightful, and actionable.
Data Segmentation
Segment Scroll Depth by source, device type, and user demographics. This allows a better understanding of how different audiences engage with content.
Campaign Dissection
Examine Scroll Depth performance across various campaigns. This comparison aids in recognizing which campaigns resonate most with the audience.
Spotting Trends
Evaluate Scroll Depth to identify standout trends or unusual spikes. Recognizing these provides insights into user behavior triggers.
Contextualize With Other Metrics
Present Scroll Depth alongside complementary metrics like Bounce Rate, Time on Page, and Conversion Rate to understand the complete picture.
Time-Based Analysis
Assess Scroll Depth over varying periods to identify consistent patterns or seasonal fluctuations.
Actionable Insights
Offer recommendations based on Scroll Depth metrics. If certain page sections have low Scroll Depth, suggest content optimization strategies or design changes.
Discover the Client Reporting Platform Trusted by Over {{customer-count}} Marketing Agencies
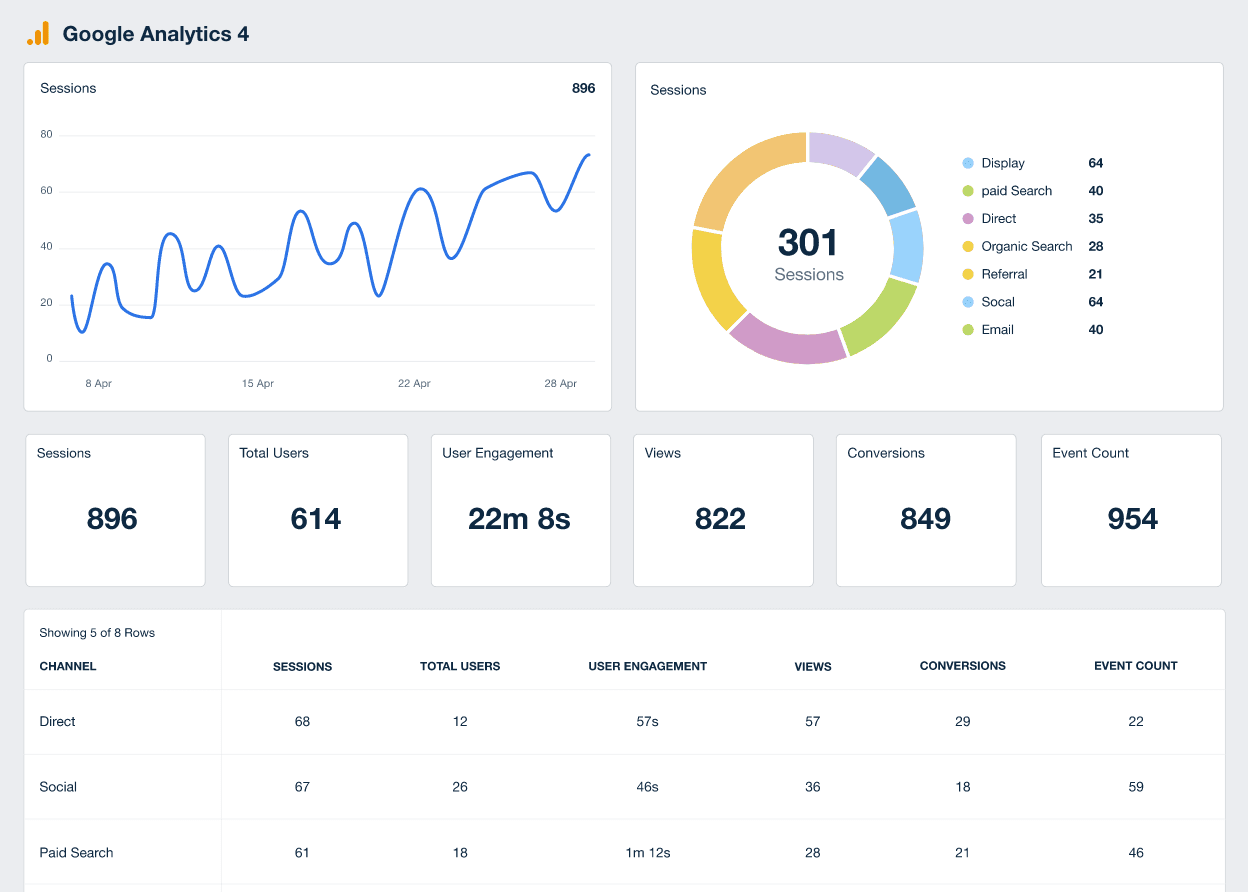
Google Analytics 4 Dashboard Example
How To Improve Scroll Depth
Better Scroll Depth leads to deeper engagement. By optimizing the content layout and design, the duration and depth of site interaction significantly improve.
Eye-Catching Headlines
Create catchy headlines that immediately captivate user interest, prompting them to delve deeper into the content.
Interactive Elements
Incorporate quizzes, polls, or other interactive elements to engage users and extend scroll duration.
Responsive Design
Ensure mobile optimization and optimal site speed, which makes it easier for users to scroll.
Related Blog Posts
See how 7,000+ marketing agencies help clients win
Free 14-day trial. No credit card required.


