Average Session Duration
User Engagement
Evaluate how long visitors remain engaged with website content, indicating content relevance and quality.
Bounce Rate Insight
Combine with bounce rates to understand visitor behavior, distinguishing between brief visits and meaningful interactions.
Content Optimization
Guide improvements in website content and layout to enhance user experience and prolong sessions.
Client Reporting
Demonstrate value in client reports by linking longer session durations to effective marketing strategies and ROI.
Why Average Session Duration Is Important
Average Session Duration stands as a crucial metric in understanding how visitors interact with a website. It goes beyond measuring the quantity of traffic and focuses on the quality of engagement. When visitors spend more time on a site, it often reflects well-crafted content and a user-friendly interface, which are key to a successful online presence.
This metric becomes especially important in evaluating the effectiveness of content and design choices. Watch out for short durations, which might prompt a review of content relevance or website usability. Average Session Duration offers a window into the user experience, providing actionable insights for in-depth website optimization.
Stop Wasting Time on Manual Reports... Get Insights Faster With AgencyAnalytics
How Average Session Duration Relates To Other KPIs
Average Session Duration interacts with other key performance indicators (KPIs) to provide a holistic view of digital campaign performance. While Average Session Duration refers to the total time spent engaging with a website, other factors help determine the quality of that engagement. For example, a high Bounce Rate coupled with a low Average Session Duration often indicates that the content is not resonating with the audience, suggesting a need for content optimization.
Similarly, this metric correlates with Conversion Rates. A longer session duration signals a higher likelihood of conversions, as it implies that users are engaging with the content, potentially leading to more bottom-of-funnel actions like purchases or sign-ups. In contrast, a shorter session duration may indicate that visitors are not finding what they need, which negatively impacts conversion rates.
Factors Affecting Average Session Duration
Several key factors impact Average Session Duration, including content quality of blog posts and product pages. Engaging and relevant content keeps users on a web page longer, increasing the session's average duration.
The website’s layout and ease of navigation also play a significant role. If users find locating information or navigating to the previous page challenging, they are more likely to leave the site. Similarly, website performance and page load speed significantly affect the Average Session Duration. Faster, more responsive sites encourage users to explore more content in the same time frame.
Finally, understanding the audience is key. An audience overview report reveals preferences and tendencies, enabling more targeted content and design adjustments.

Engagement is the metric that we look at the most. If we are reaching and interacting with people, that typically hits the goal for our customers.
How To Calculate Average Session Duration
To accurately measure Average Session Duration, divide the total duration of all sessions within a given time frame by the number of sessions in that period. This calculation provides a clear picture of how long, on average, visitors are staying on the website. But don’t worry about having to calculate this manually, it’s easy to find Average Session Duration in Google Analytics and other web analytics platforms.
Average Session Duration Formula Example
What Is a Good Average Session Duration?
A good Average Session Duration typically ranges from two to five minutes. This duration indicates that visitors find the website content engaging and valuable, spending sufficient time to absorb the information presented. Longer sessions suggest effective content and user-friendly website design, key indicators of a successful digital strategy.
What Is a Bad Average Session Duration?
A bad Average Session Duration is generally under one minute. This short duration implies that visitors are not finding the content compelling or relevant, or may be encountering usability issues. Such brief sessions signal the need for a thorough review and potential overhaul of content strategy and website design.
How To Set Average Session Duration Benchmarks and Goals
Identify trends and set realistic, achievable targets for Average Session Duration by assessing past performance. Additionally, it’s possible to back-calculate the required Average Session Duration to meet specific revenue or engagement goals. This approach allows for tailored benchmarks that align with unique business objectives and audience behavior, providing a more customized strategy for measuring success.
GA4 Average Session Duration for SMB Websites
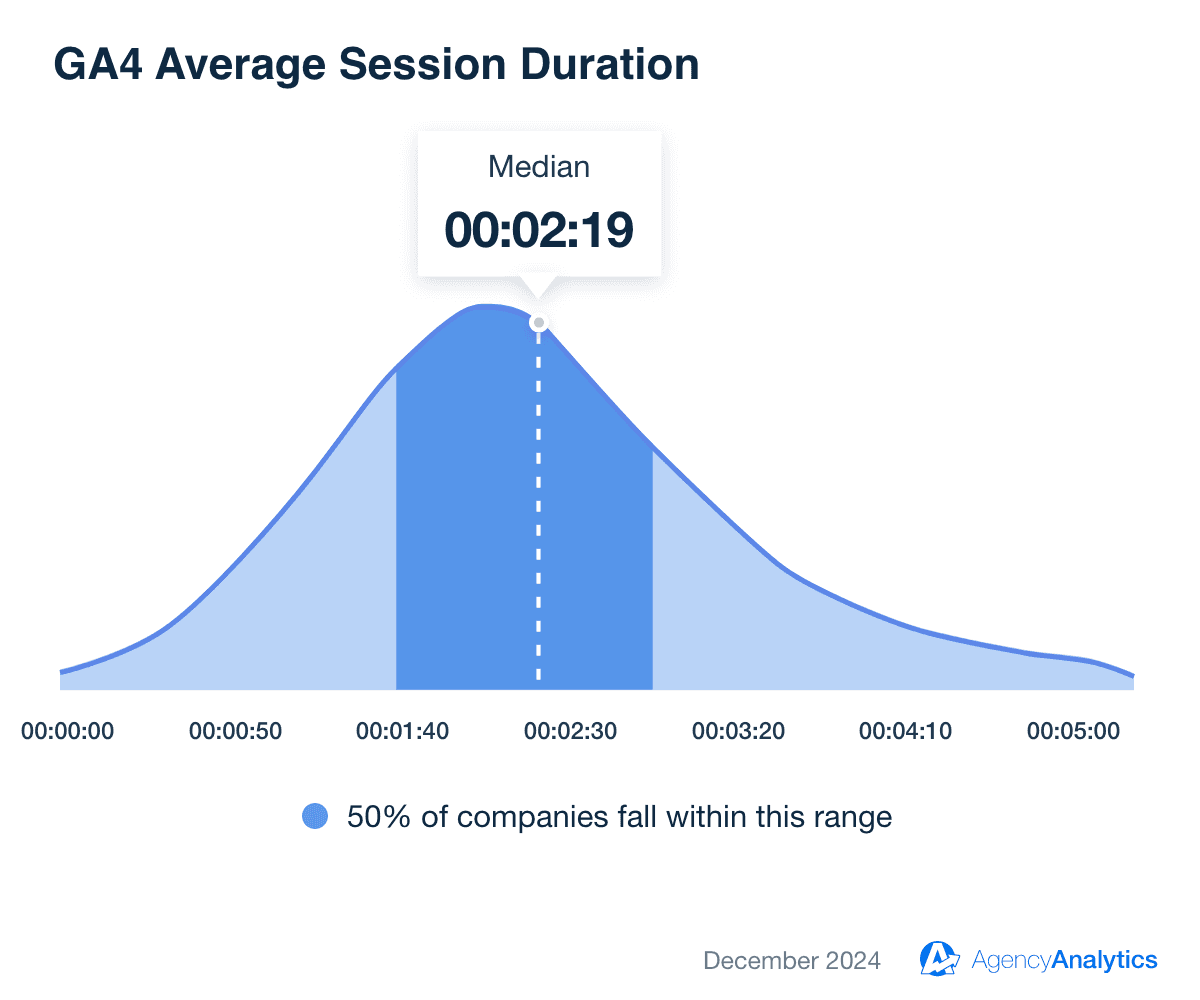
The median value for GA4 Average Session Duration currently sits at 2:19, based on performance benchmarks from over {{campaign-count}} campaigns managed by {{customer-count}}+ marketing agencies. This figure reflects the typical range for SMBs, where session durations often vary depending on the type of website and industry.
Understanding how an Average Session Duration compares to industry standards helps agencies assess the quality of user engagement and identify opportunities to enhance content or improve website navigation.
Access detailed performance benchmarks and see how campaigns measure up. Get started with a 14-day free trial.
Why Average Session Duration Matters to Clients
From a client's perspective, Average Session Duration is a key indicator of customer engagement and content resonance. It reflects how well a website captures and maintains the interest of its visitors.
Clients see this metric as a direct measure of content effectiveness and user experience quality. A longer average session suggests that visitors are thoroughly exploring the website, which is often a precursor to higher conversion rates and customer loyalty.
Clients view this metric as a gauge of their return on investment in content and web design, making it a crucial element in assessing the success of their digital marketing strategy.

Why Average Session Duration Matters to Agencies
For marketing agencies, Average Session Duration is a vital metric for evaluating and refining their strategies. It provides insights into how well the content and user interface design are performing from an engagement standpoint.
Agencies use this metric as a benchmark to test different content formats, layouts, and user journeys. A high Average Session Duration is often a sign of effective storytelling and user engagement, which agencies leverage to showcase their expertise in creating compelling digital experiences.
This metric also helps agencies identify areas for improvement, ensuring that their strategies continually evolve to meet user expectations, increase Average Session Duration, and reach business goals.

Save Time and Money by Automating Your Client Reporting
Best Practices When Analyzing and Reporting on Average Session Duration
Understanding the average time users spend on a website or web page helps marketers tailor content and design to better meet user needs. This deep dive into engagement patterns helps refine strategies, ensuring advertising efforts are reaching and resonating with the target audience.
Ensure Data Accuracy
Reliable data forms the backbone of meaningful analysis, guiding strategic decisions. This involves regular checks and validation of analytics tools to maintain data integrity.
Analyze Average Session Duration Over Time
Analyzing Average Session Duration over time provides a longitudinal view to understand how changes in content or design influence visitor behavior, influencing future strategies.
Measure ASD by Campaign
Measure Average Session Duration across various campaigns to evaluate which campaigns resonate best with the audience, guiding future marketing efforts.
Put Average Session Duration in Context
Put Average Session Duration in context by comparing it with industry benchmarks, understanding audience demographics, and considering the nature of the website.
Visualize Average Session Duration
Visualize Average Session Duration performance using charts and graphs to highlight trends and key points, making data more accessible.
Include Actionable Recommendations
Suggest specific steps for improvement, like content optimization or UX enhancements, providing clients with clear guidance for enhancing user engagement.
Engagement is the most important factor in GA4. AgencyAnalytics has helped us seamlessly incorporate GA4 reporting for our clients. We are excited to see how we can expand our GA4 reporting by identifying and reporting on a slew of new KPIs.
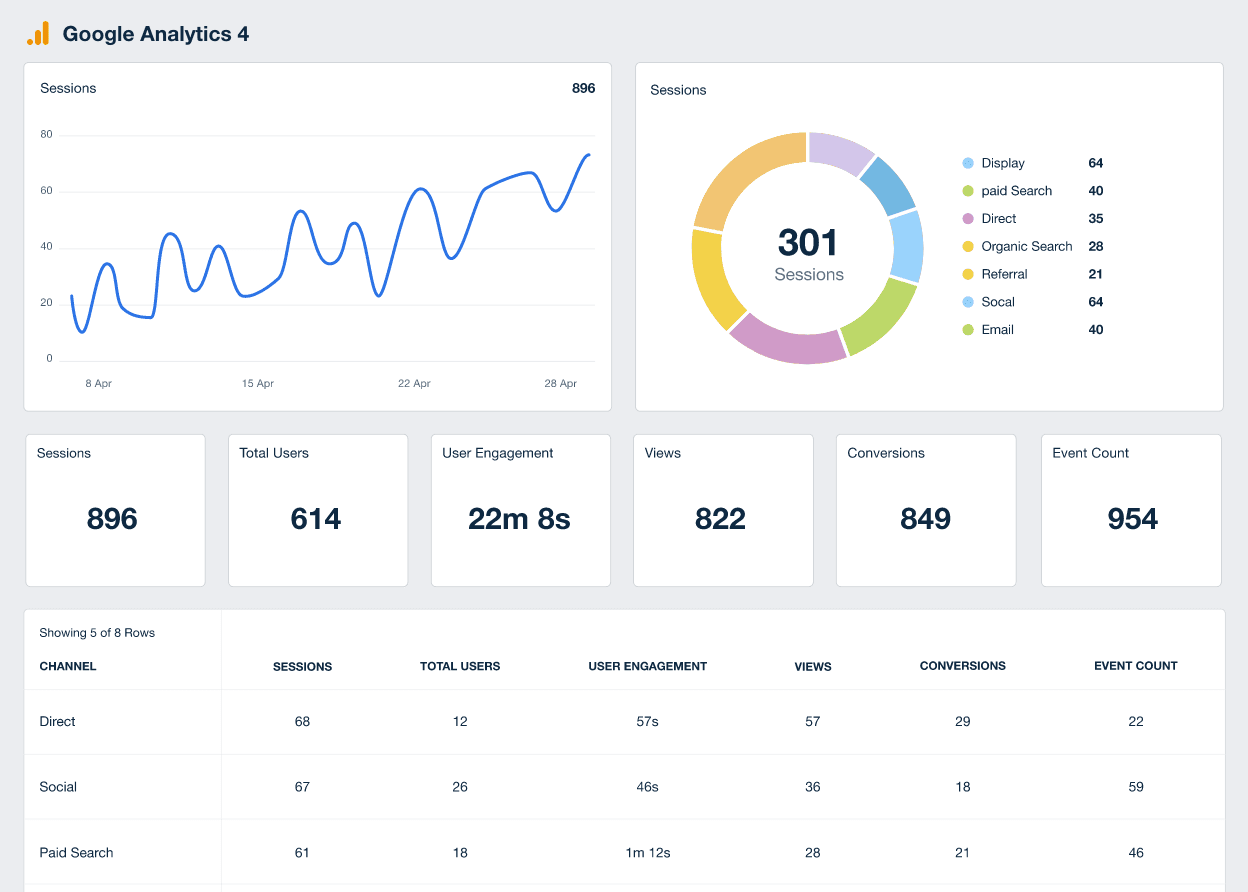
Google Analytics 4 Dashboard Example
Related Integrations
How To Improve Average Session Duration
Boosting Average Session Duration is key to enhancing user engagement and website effectiveness. The following tips are designed to keep visitors interested and engaged for longer periods, improving the overall website performance.
User-Friendly Design
A clean, intuitive, and responsive design ensures the website is easy to navigate, loads quickly, and is accessible across various devices. A seamless user experience keeps visitors on the site for longer periods.
Regular Updates
Frequently update the website with new content, features, or design elements. Regular updates give visitors a reason to come back and explore new content, increasing their session duration over time.
Interactive Elements
Incorporate interactive features such as videos, quizzes, or infographics. These elements make the website more engaging and encourage visitors to spend more time exploring different sections of the site.
Related Blog Posts
See how 7,000+ marketing agencies help clients win
Free 14-day trial. No credit card required.


