Engaged Users
Track User Interactions
Measure user engagement and interaction across various content types.
Evaluate Content Effectiveness
Assess how users interact and engage with website and app content.
Improve User Retention
Monitor returning users and track user engagement over time.
Campaign Performance
Tracking user engagement helps evaluate the impact of marketing campaigns.
Why Engaged Users Are Important
Engaged Users is a vital KPI for assessing content effectiveness, improving user experience, and meeting marketing objectives. Measuring user engagement helps determine how well content connects with the audience. High engagement means users find the content valuable, leading to more interactions, repeat visits, and higher Conversion Rates.
Monitoring Engaged Users reveals which content types drive the most interaction, guiding future campaign improvements. This insight is crucial for strategies to boost user engagement and enhance customer engagement. High engagement fosters brand loyalty and strengthens audience relationships, which is essential for long-term success.
By focusing on Engaged Users, agencies improve user engagement, calculate user engagement accurately, and measure engagement effectively. This KPI is also integral in understanding the customer journey, as it tracks highly Engaged Users, Daily Active Users (DAU), and Monthly Active Users (MAU).
Stop Wasting Time on Manual Reports... Get Insights Faster With AgencyAnalytics
How Engaged Users Relate To Other KPIs
High user engagement often correlates with an improved Conversion Rate, as Engaged Users are more likely to complete desired actions such as purchases or sign-ups.
User engagement metrics also impact the Bounce Rate. A lower bounce rate typically indicates users find the content compelling enough to explore further and stay on as active users rather than leaving the site quickly. This metric, therefore, indicates content effectiveness and site usability.
Average Time on Page is another KPI influenced by Engaged Users. The more users engage, the longer they stay on a page, consuming content and interacting with various elements. This prolonged interaction helps in understanding user interests and improving content strategy.
Key Factors That Impact Engaged Users
Engaging articles, captivating videos, and interactive elements keep users interested and encourage repeat visits, creating highly Engaged Users. When users find content valuable and engaging, they are more likely to interact with it, boosting user engagement and contributing to overall customer engagement.
A user-friendly website with easy navigation, fast load times, and mobile responsiveness enhances the user experience. Whether interacting with a social media app, product, or service platform, users who seamlessly navigate and interact with the site are more likely to stay engaged. This ease of use is crucial for maintaining high user interaction and satisfaction levels.
Personalized recommendations, targeted emails, and dynamic content based on user behavior help engage users more deeply, enhancing the overall customer journey. When users feel that content is specifically curated, their engagement levels increase, leading to higher Daily Active Users and Monthly Active Users.
KPIs allow us, as an agency, to demonstrate our value to the client. Ultimately, what is their ROI from our efforts? When you can clearly demonstrate this month over month, it increases your retention rate and keeps clients paying you month after month.
How To Calculate Engaged Users
Calculating Engaged Users involves tracking user interactions such as Clicks, Shares, Comments, and time spent on the site.
Engaged Users Formula Example
What Is a Good Engaged Users Rate?
A generally accepted benchmark is that 20-30% of total users actively engage with the content regularly, which indicates strong engagement. High engagement rates suggest the content resonates well with a client’s audience, leading to positive interactions and higher retention rates.
What Is a Bad Engaged Users Rate?
A bad Engaged Users rate typically falls below 10%. Low engagement rates signal the content does not capture the audience’s interest, leading to fewer interactions and potential churn. They indicate a need to reassess content strategy, usability, and personalization efforts to improve user engagement.
How To Set Engaged Users Benchmarks and Goals
Review historical data and past engagement metrics to identify trends and patterns and establish a baseline for current performance. This will help you to understand typical engagement levels over time and provide a solid foundation for setting realistic goals.
Next, compare engagement metrics with industry standards. Research industry benchmarks to see how your metrics compare to competitors'.
Break down engagement metrics by demographics, behavior, and platform usage to define specific and relevant benchmarks for each user group, ensuring targeted and effective improvement strategies.
Conduct a comparative analysis comparing current engagement metrics with previous campaigns or periods to understand the impact of new strategies and identify areas needing adjustment.
Finally, regularly review and adjust goals based on performance to ensure benchmarks remain realistic and aligned with overall business objectives.
Why Engaged Users Matter to Clients
Engaged Users are crucial for clients because they indicate how well a product or service connects with its audience. High engagement means users find the content valuable, leading to more interactions, repeat visits, and higher conversion rates. For instance, on apps like X (formerly Twitter), highly Engaged Users will share Posts, participate in events, and create content that generates further interest.
When clients focus on measuring user engagement, they identify what features or pages resonate most with their customers. This analysis helps tailor offerings to enhance user experience, increasing the usage and effectiveness of their platform. Engaged Users often lead to higher subscriptions and more consistent revenue, as satisfied customers are more likely to invest money in a company they feel connected to.
Why Engaged Users Matters to Agencies
By analyzing Engaged Users, agencies identify which aspects of a campaign resonate with the audience. This analysis allows agencies to fine-tune their strategies, ensuring that the content and features offered meet the needs and interests of the target customers. Engaged Users also provide valuable insights into customer behavior, helping agencies generate more effective and targeted marketing efforts.
Additionally, high user engagement often translates into increased usage and subscriptions, directly impacting client revenue. By demonstrating their ability to boost user engagement, agencies build stronger relationships with clients, prove their worth, and secure long-term partnerships.

Stop Wasting Time on Reports. Get Marketing Insights in Minutes With AgencyAnalytics.
Best Practices When Analyzing and Reporting on Engaged Users
Conducting a comprehensive analysis of Engaged Users through various lenses helps set the stage for more effective and efficient advertising campaigns. Here are the best practices to consider:
Ensure Data Accuracy
Regularly audit your engagement data for accuracy. Use reliable tools and methodologies to ensure data integrity, avoid skewed insights, and make informed decisions.
Analyze Over Time
Analyze user engagement trends weekly, monthly, and quarterly. Identify patterns and shifts in user behavior to understand how changes in content, features, or campaigns affect engagement.
Compare Across Channels and Campaigns
Measure and compare user engagement across different platforms, such as apps, social media, and web pages. Determine which channels are most effective and allocate resources to maximize impact.
Put in Context
Relate engagement metrics to specific events, feature launches, or content updates. Understanding the context helps pinpoint what drives user interactions and what might need improvement.
Align to Client Goals
Ensure your engagement metrics and analysis align with the client’s business objectives. Tailor your strategies to meet these goals, demonstrating how improved engagement supports their success.
Visualize Performance
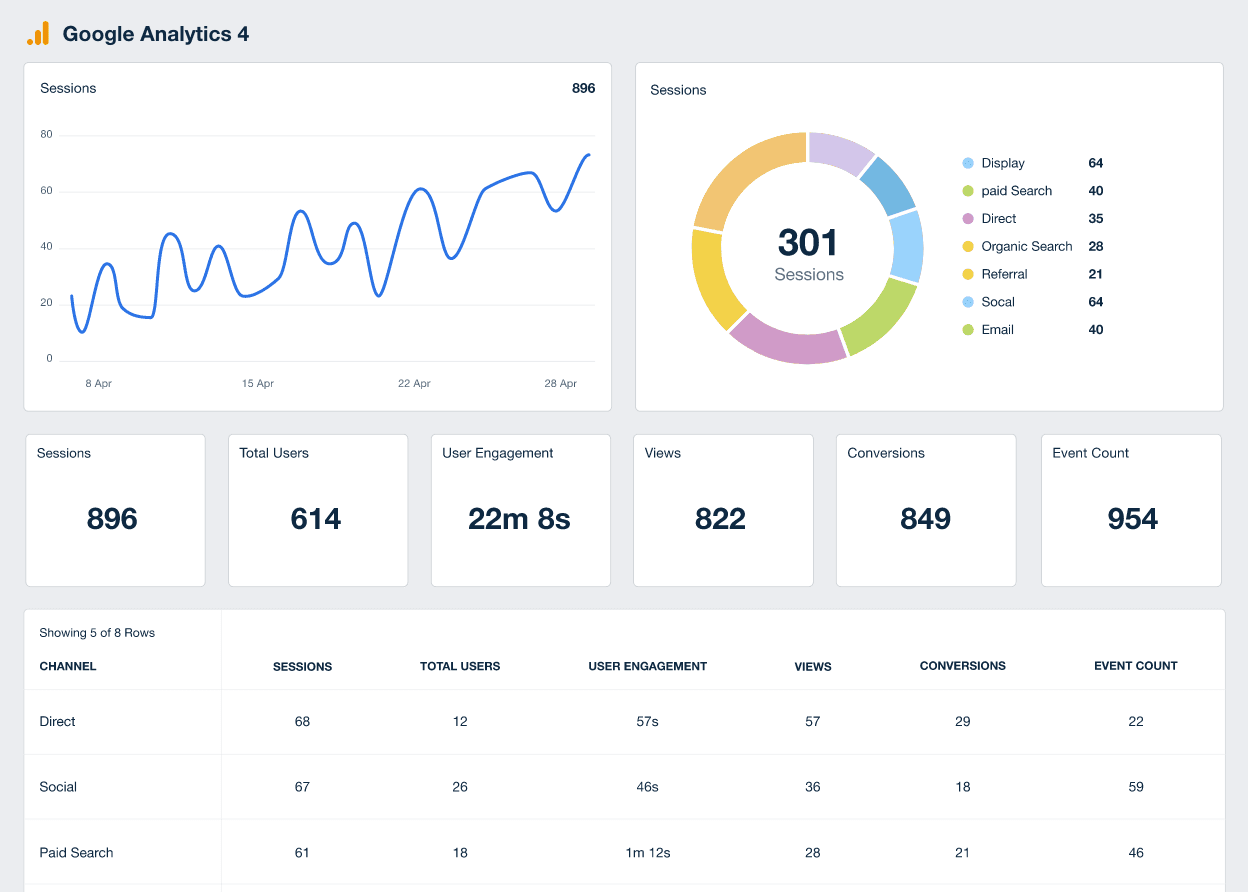
Present engagement data using charts, graphs, and dashboards. Visual tools make communicating findings to clients and stakeholders easier and facilitate better decision-making.
KPIs keep us accountable. KPIs provide the client transparency into what work we deliver and most importantly, KPIs demonstrate that we are on track and achieving mutually agreed upon goals.
Google Analytics Dashboard Example
How To Improve Engaged Users
To improve Engaged Users, focus on implementing these actionable strategies:
Create High-Quality Content
Deliver valuable and relevant content that resonates with the target audience. Regularly update blogs, videos, and social media posts to keep users interested and engaged.
Optimize User Experience
Ensure the website or app is user-friendly, with fast load times, easy navigation, and mobile responsiveness. A smooth user experience encourages more interaction and repeated visits.
Personalize Interactions
Use data to tailor content and recommendations to user preferences. Personalized emails, targeted ads, and customized content help connect with users, boosting engagement.
Related Blog Posts
See how 7,000+ marketing agencies help clients win
Free 14-day trial. No credit card required.


