Monthly Active Users (MAU)
Campaign Monitoring
Evaluate the impact of marketing campaigns on website traffic and user engagement.
Customizing User Experience
Understand user behavior, including frequently used features or engaging content.
Traffic Goals
Use MAU to guide realistic objectives and strategic planning for long-term growth.
Client Reports
Showcase MAU in client reports to highlight the effectiveness and ROI of marketing strategies.
Why Tracking Monthly Active Users Is Important
Monthly Active Users quantifies active user engagement, giving concrete data on a website or app’s reach within a monthly window. Whether assessing the impact of a newly launched campaign or evaluating the success of a feature roll-out, MAU serves as an important metric to measure user engagement. The key insights provided by active users data helps fine-tune website, app, and marketing strategies for improved results.
In addition to gauging overall engagement, MAU plays a crucial role in predicting long-term user trends and platform sustainability. An upward trend in MAU signals a growing, healthy user base, while fluctuations may prompt a deeper dive into user experience or market shifts.

Stop Wasting Time on Manual Reports... Get Insights Faster With AgencyAnalytics
How Monthly Active Users Interact with Other KPIs
Monthly Active Users is closely linked with Daily Active Users (DAU) and Weekly Active Users (WAU). A disparity between high MAU and lower DAU/WAU indicates broad reach but weak daily engagement. In contrast, higher DAU/WAU relative to MAU suggests a loyal but limited user base. This analysis assists in pinpointing whether a marketing focus on user acquisition or retention is needed.
The interaction between MAU, Churn Rates, and Conversion Rates offers valuable insights. A simultaneous increase in MAU and drop in Churn Rate typically points to successful user retention strategies. Additionally, a high MAU correlating with rising Conversion Rates indicates effective user engagement, with more users completing targeted actions. These relationships are crucial for understanding the effectiveness of a platform in meeting its goals.

Top Factors That Influence Monthly Active Users
Several critical factors will impact Monthly Active Users, both positively and negatively. First, user experience stands out as a primary determinant; a seamless, engaging, and value-driven experience encourages repeat usage.
Secondly, new feature deployment and product enhancements directly correlate with how many users remain engaged with a platform month after month. New features often re-engage dormant users as much as they attract new ones. Marketing and promotional strategies also play a crucial role; effective campaigns can significantly increase visibility and drive user growth.
Lastly, external factors such as market trends and competitor actions can influence the patterns of active users, necessitating continuous analysis and strategic agility to maintain and increase user engagement.
GA4 helps measure engagement more accurately than UA. This is the biggest difference we have found so far. We are excited to see how we can expand our GA4 reporting by identifying and reporting on a slew of new KPIs.
Calculating MAU
Calculating Monthly Active Users is intricate due to its dynamic nature and the need for precise user tracking. However, there is no need to calculate Monthly Active Users manually, as this data is readily available in Google Analytics 4. The platform automatically aggregates user data, providing a streamlined and accurate way to track Monthly Active Users.
What Is a Good DAU to MAU Ratio?
A good DAU to MAU ratio typically falls around 15-20%. This indicates a healthy level of daily engagement compared to the monthly user base. Consistently high ratios suggest strong user retention and daily platform value.
What Is a Good WAU to MAU Ratio?
For WAU to MAU, a ratio of around 50-60% is considered good. This signifies that a significant portion of the monthly user base returns weekly, reflecting consistent user engagement.
How To Set MAU Benchmarks and Goals
Agencies often leverage historical data to calculate MAU and set customized benchmarks and goals. Analyzing past user growth patterns–especially the rate of acquiring new users versus retaining existing users–helps inform realistic growth targets. For instance, a steady increase in existing users warrants higher MAU goals.
Calculating Required MAU for Revenue Targets
To back-calculate the required MAU for specific revenue targets, agencies start by understanding the Average Revenue Per User (ARPU). The number of active users is quickly determined by dividing the revenue target by ARPU.
Granular Insights into MAU
Digging deeper into MAU involves segmenting the user data. Examining the behavior patterns of new users versus existing users reveals areas for improvement or highlights successful strategies. Additionally, tracking the user journey and interaction points within the platform provides more nuanced insights into how and why specific trends in MAU are occurring, guiding targeted marketing efforts.
Why Monthly Active User Data Matters to Clients
MAU data reflects a brand's reach and resonance with the audience. This metric serves as a barometer of market presence, especially for clients involved with social media companies, SaaS platforms, or apps. Clients look at MAU to understand how effectively their brand or product retains relevance in a competitive digital space.
MAU data also influences client decisions on product development and customer experience improvements. A rising MAU suggests the strategies are effective, encouraging further investment in similar areas. Conversely, a declining MAU is an early warning sign, prompting a re-evaluation of marketing tactics or product offerings.

Why Monthly Active User Metrics Matter to Agencies
MAU data isn't just a metric; it's a storytelling tool for agencies. It helps paint a picture of how well an agency's strategies drive engaged users.
Agencies use MAU data to benchmark their performance against industry standards and previous campaigns. This data provides insights into user behavior trends, enabling agencies to refine their marketing strategies. Additionally, consistent growth in MAU demonstrates an agency’s competence in expanding and maintaining a user base.

Better, Faster & Easier Client Reports Are Just a Few Clicks Away
Best Practices When Analyzing and Reporting Monthly Active Users
In-depth analysis helps identify what attracts and retains users, setting the stage for more targeted and successful campaigns. It's not just about counting users but understanding user behavior and preferences.
Timeframe Analysis of MAU
Tracking MAU over various periods reveals trends and patterns in user behavior, identifying strategies that provide long-term sustainability.
Assess MAU by Channel
Comparing MAU across different campaigns and channels, like social media, email, or apps, highlights which platforms are most effective in engaging users and focuses marketing efforts.
Put MAU in Context
Contextualizing MAU with other metrics, key performance indicators, and prevailing market conditions offers a comprehensive perspective on performance.
Visualize MAU Performance
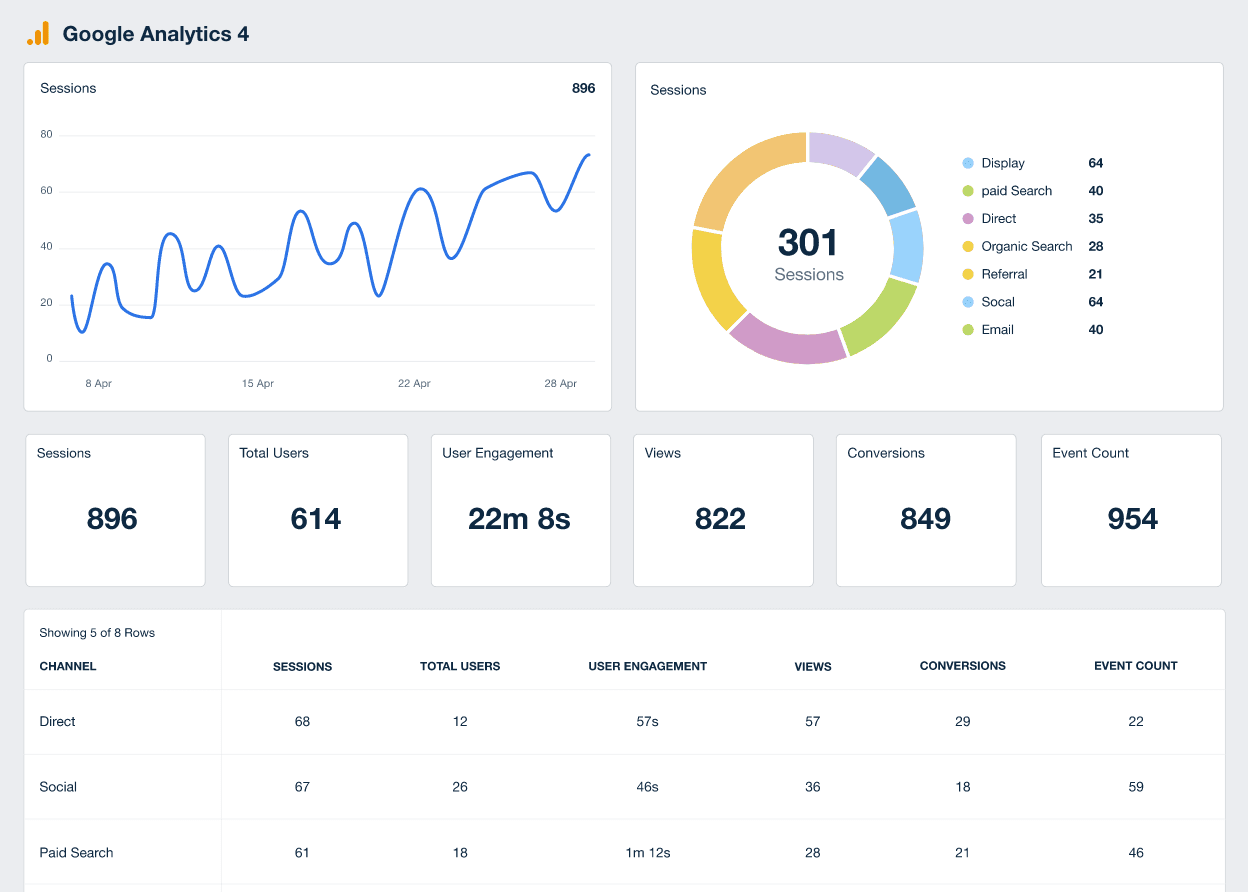
Visualizing MAU data through graphs or dashboards makes it easier to communicate trends and insights to clients or team members, facilitating more informed discussions.
Align MAU with Client Goals
Ensure that MAU aligns with the client's broader business goals. This alignment confirms that user growth contributes to the client's overall objectives.
Provide Recommendations Based on MAU Data
Include actionable recommendations based on MAU analysis. Suggest specific strategies to enhance user engagement, acquisition, or retention, tailored based on MAU trends.
Google Analytics 4 Dashboard Example
Related Integrations
How To Increase Monthly Active Users
Increasing MAU is vital for sustained platform growth and user engagement. These actionable tips provide strategies to effectively increase MAU, ensuring a broader and more engaged user base.
Engage Regularly
Regular updates, interactive content, and responsive communication keep users returning. Tailoring content to user preferences increases the likelihood of frequent platform visits and longer engagement periods.
Optimize Onboarding
For online platforms and apps, streamlining the user onboarding process significantly reduces initial drop-offs. An intuitive, welcoming, and informative onboarding experience increases user activity and encourages new users to explore more and return.
Personalize Experiences
Personalizing unique user experiences leads to greater user satisfaction. Customized content, recommendations, and notifications based on user behavior and preferences can significantly boost MAU.
Related Blog Posts
See how 7,000+ marketing agencies help clients win
Free 14-day trial. No credit card required.


