Average Revenue Per User (ARPU)
Target Segments
ARPU identifies lucrative customer groups for focused advertising.
Pricing Strategy
Guides adjustments to pricing models or subscription tiers.
Client Reports
Demonstrates ROI and value to clients using ARPU metrics.
Campaign Optimization
This metric offers a reliable way to gauge the efficacy of campaigns.
Importance of Average Revenue Per User
ARPU provides a focused, transparent figure that reflects a company's ability to generate revenue from its customer base. It condenses the income per user into a single figure, offering a straightforward assessment of a company's revenue-generating capability. When the Average Revenue Per User rises, it validates the effectiveness of marketing campaigns and product offerings.
ARPU also informs high-impact business decisions. From shaping advertising strategies to modifying pricing models, this metric offers data essential for strategic planning. A fluctuating ARPU merits attention, indicating the need to adjust business tactics for optimal revenue growth.
Beyond SaaS and eCommerce models, ARPU also plays a role in monetization strategies. When you link ARPU with advertising revenue and Daily Active Users (DAU), you create a composite view that offers compelling insights into both user engagement and monetization effectiveness.

Stop Wasting Time on Manual Reports... Get Ecommerce Insights Faster With AgencyAnalytics
How ARPU Relates to Other KPIs
ARPU provides a clearer understanding of a company’s financial performance. For instance, it's instrumental in predicting Monthly Recurring Revenue (MRR) trends. A rising ARPU usually foreshadows a growing MRR, indicating successful customer monetization. On the flip side, a low ARPU alongside a high Customer Acquisition Cost (CAC) flags operational inefficiencies, urging immediate action to recalibrate marketing strategies.
Lifetime Value (LTV) is another metric that amplifies the significance of ARPU as it indicates how much revenue customers will generate over the long haul. A rising ARPU often correlates with increased LTV, affirming a business's long-term sustainability and competitiveness.
While ARPU and Average Order Value (AOV) deal with revenue, they focus on different aspects. ARPU gauges the revenue per paying user over a set period, often revealing trends in customer spending. On the other hand, AOV looks at the income from individual transactions during the same period, providing a snapshot of immediate spending behavior. Understanding the distinction between these metrics is essential for a nuanced view of revenue generation.

KPIs allow us, as the agency, to demonstrate our value to the client. There are basic KPIs such as spend, clicks, impressions, ranking, etc., but the real KPIs every client wants to know are leads and/or sales. We like to include both in our monthly reports. Ultimately, what is their ROI from our efforts? When you can clearly demonstrate this month over month, it increases your retention rate and keeps clients paying you month after month.
How To Calculate ARPU
Calculating ARPU is surprisingly straightforward. The primary aim is to break down total revenue into a per-user figure over a given time period, often monthly or yearly. Doing so provides actionable insights into customer value, painting a financial portrait of the user base.
Calculate Average Revenue Per User by dividing the total revenue generated by the total number of current users or existing customers. Whether it's a software service with recurring subscriptions or a retail business with individual sales, this formula remains universally applicable.
ARPU Calculation Formula
What Is a Good ARPU?
A good ARPU indicates that the business effectively monetizes its user base, often resulting from successful marketing campaigns or high-value product offerings. When ARPU increases over time, it validates that customer relationships are deepening, making the business more sustainable.
What Is a Bad ARPU?
A declining or low ARPU can be alarming. It might signify customer dissatisfaction, suboptimal pricing models, or the need to reassess the marketing approach. A declining ARPU demands immediate investigation to determine the root cause.
How To Set ARPU Benchmarks and Goals
Agencies often set custom benchmarks using historical client data. By reviewing ARPU trends from past quarters or years, agencies can establish realistic–yet challenging–ARPU goals. Additionally, agencies may back-calculate the required ARPU to hit specific revenue targets, serving as a bespoke yardstick for performance measurement.
ARPU can be segmented based on customer demographics, product types, or geographic locations to acquire more granular insights. Breaking down ARPU this way helps identify which segments are the most profitable or need improvement. Moreover, analyzing segmented ARPU changes over different periods offers invaluable insights into market trends and customer behavior.
Why Average Revenue Per User Matters to Clients
For clients, Average Revenue Per User is the pulse check on the value each customer brings into the business. A strong ARPU indicates that product or service quality investments are paying off.
Clients look at ARPU as an index of how well their brand resonates with the customer, often influencing pricing strategy, upselling, or loyalty programs. Plus, in the case of investors or stakeholders reviewing business performance, ARPU serves as a concise and compelling financial indicator that can either make or break investment opportunities.

Why Average Revenue Per User Matters to Agencies
In the agency world, ARPU is the translator between marketing campaigns and tangible financial outcomes. High ARPU levels validate an agency’s strategies, confirming that campaigns are not just driving clicks or engagement but actual revenue.
It’s about connecting the dots between customer acquisition and revenue generation. ARPU allows agencies to fine-tune their efforts in real-time, prioritizing resources toward marketing channels or customer segments that maximize revenue. Moreover, an increasing ARPU trend becomes a powerful sales point for agencies when pitching additional services to clients.

Turn Data Chaos into Client Success Stories with AgencyAnalytics.
Best Practices for Analyzing and Reporting ARPU
Analyzing Average Revenue Per User offers a comprehensive view of how well advertising efforts translate into one-time and recurring revenue. This sharpens decision-making for more efficient and impactful campaigns. Reporting ARPU is about presenting a narrative that aligns with client objectives. This adds depth to your report, showing that you’re not just delivering numbers but crafting a strategy to meet the client’s ambitions.
Time-Based ARPU Trends
Examine ARPU on a timeline, whether monthly or annually. This identifies patterns and informs seasonal marketing efforts. It’s a direct gauge of how strategies impact customer value over time.
Channel and Campaign-Specific ARPU Insights
Different marketing channels contribute to ARPU in varied ways. Breaking down ARPU by channel and campaign reveals which are more lucrative, guiding where to allocate budget and resources for maximum yield.
Spotting ARPU Anomalies
Keeping an eye on sudden spikes or drops in ARPU can be insightful. These anomalies often indicate market trends or issues that require immediate attention, providing an opportunity for timely adjustments.
The Importance of Visualization
Charts, graphs, and timelines make ARPU data more digestible and actionable. Visual aids distill complex information into easy-to-understand formats, aiding in quicker decision-making. A time-series graph showing ARPU variations quickly indicates the success of specific campaigns or seasonal trends.
Context Matters for ARPU
The power of ARPU becomes fully evident when viewed alongside other key performance indicators like Customer Acquisition Cost, Conversion Rates, AOV, or Monthly Recurring Revenue. Juxtaposing metrics illustrates the true cost of customer interactions and their return elements.
Aligning ARPU With Client Goals
ARPU isn’t just a metric; it’s a business lever. When reporting, correlate how changes in ARPU directly affect a client’s broader business goals, such as profit margins or expansion plans. If a client’s goal is to break into a new market, a segment-specific ARPU can serve as a leading indicator of whether the market will be profitable.
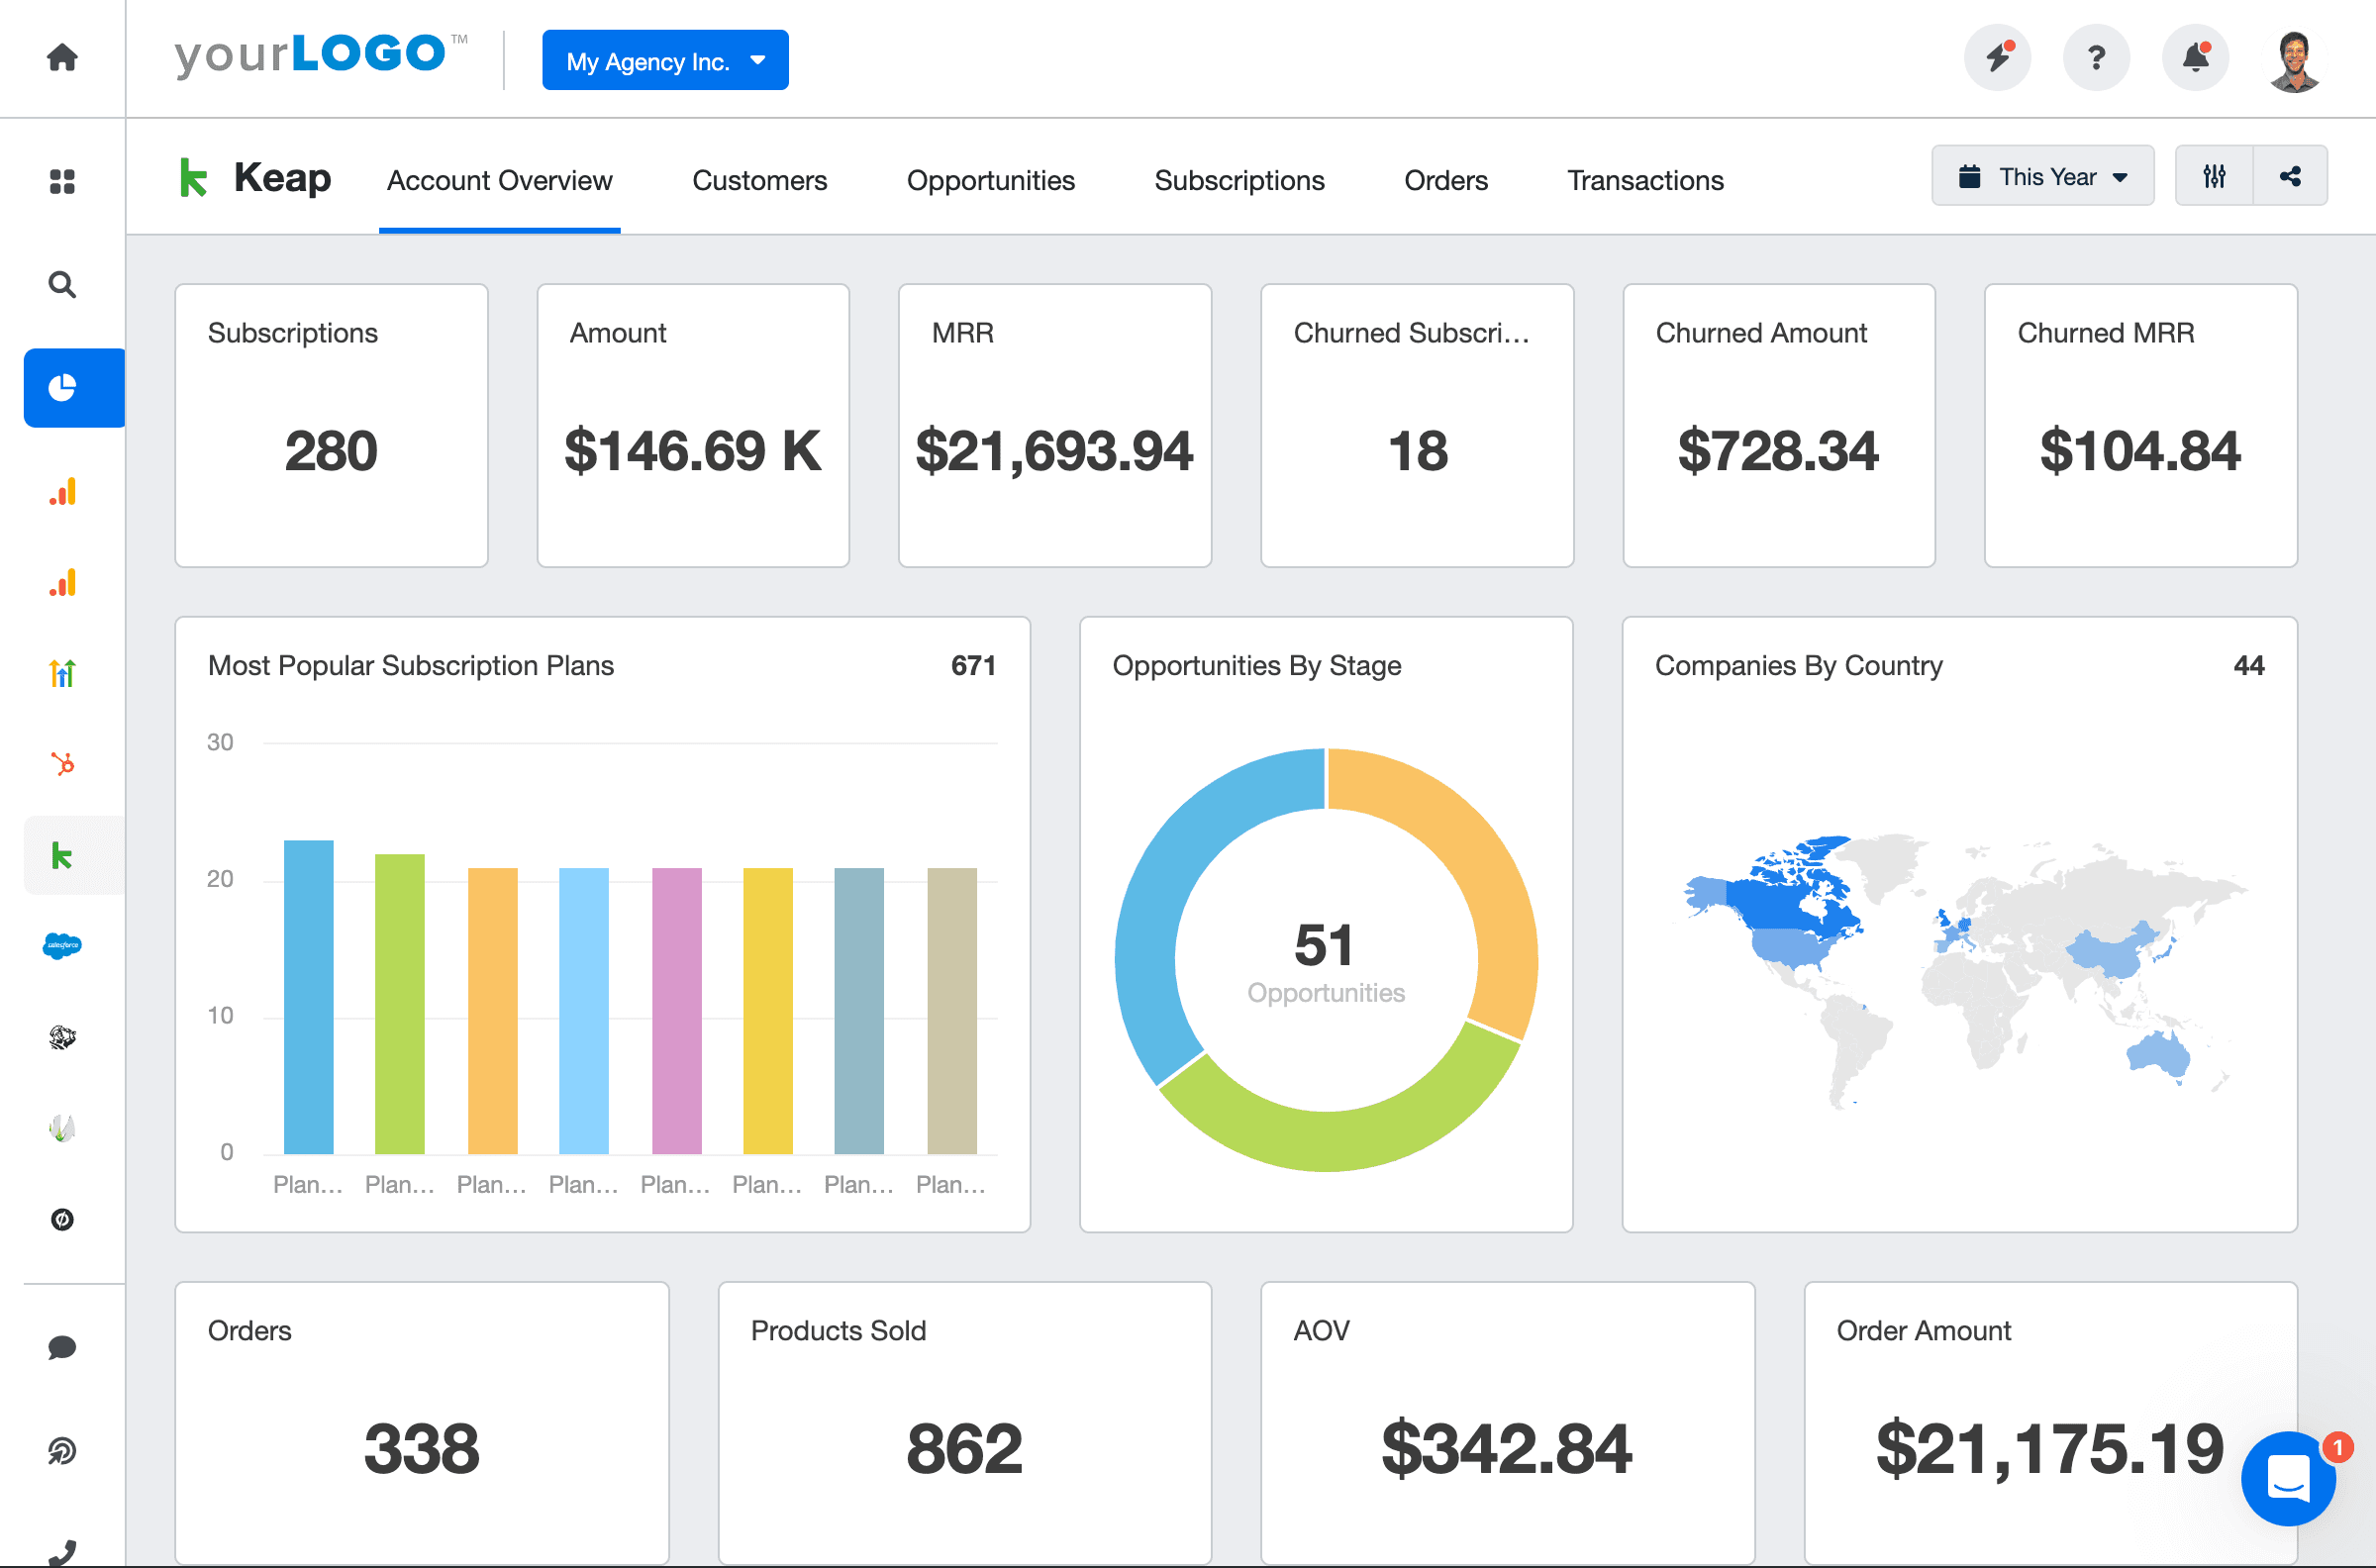
Keap Dashboard Example
Related Integrations
How To Improve ARPU
Average Revenue Per User is a tangible indicator of business performance, directly impacting the bottom line. Elevating this metric directly correlates with an uptick in revenue.
Optimize Pricing
Adjusting pricing tiers or offering add-ons motivates customers to spend more, boosting ARPU.
Cross-Sell Wisely
Suggesting complementary products during the purchase cycle increases the total transaction value.
Target High-Value Users
Identify customer segments with a history of higher spending and tailor campaigns, promotions, or features to them.
Related Blog Posts
See how 7,000+ marketing agencies help clients win
Free 14-day trial. No credit card required.


