Stripe metrics: 16 top KPIs you should track


Table of Contents
- Key takeaways
- Why Stripe works well for ecommerce metrics
- The types of Stripe data available to your agency
- Where Stripe’s own reporting falls short
- The top 16 Stripe metrics your agency should track
- Connect the Stripe integration in three steps
- What to include in your Stripe dashboard
- Streamline your clients’ key metrics in one place
7,000+ agencies have ditched manual reports. You can too.
Free 14-Day TrialTable of Contents
- Key takeaways
- Why Stripe works well for ecommerce metrics
- The types of Stripe data available to your agency
- Where Stripe’s own reporting falls short
- The top 16 Stripe metrics your agency should track
- Connect the Stripe integration in three steps
- What to include in your Stripe dashboard
- Streamline your clients’ key metrics in one place
7,000+ agencies have ditched manual reports. You can too.
Free 14-Day TrialIf you manage clients that rely heavily on online transactions, it’s likely they use Stripe and you want to know which metrics are worth reporting on.
As with most platforms, you’ll have a suite of insights at your disposal, whether from raw Stripe data, Google Analytics, or an external data source.
But copying and pasting numbers out of the back end of a platform isn’t enough to tell the data-driven story of what’s happening. When the end of the month rolls around, your client needs relevant metrics to measure their ecommerce performance. That’s the only way to make strategic decisions and adjust their marketing sails if required.
This guide covers the Stripe data your agency has access to, where Stripe’s own reporting runs out of road, and the 16 metrics worth putting in front of a client every month. From ecommerce payments and refunds to monthly recurring revenue (MRR) and churn rate, here’s what to send your clients and how to build a dashboard around it.
Key takeaways
Stripe covers eight broad categories of data, from transaction volume and revenue trends to geographic sales and checkout A/B tests.
The 16 metrics worth reporting split into five groups: payment, customer, refund, subscription, and subscription churn analytics.
Stripe’s own dashboards are technical and can only be exported as CSV, so they don’t sit alongside your client’s PPC or web analytics data.
Stripe is used by over 3.1 million users and is the second most popular payment processor, which makes it a common integration across an ecommerce client roster.
The AgencyAnalytics Stripe dashboard connects in three steps and pulls payment, subscription, and customer data into the same report as every other channel.
Why Stripe works well for ecommerce metrics
There are more than a few reasons why Stripe is the preferred ecommerce integration for over 3.1 million users, and the second most popular payment processor on the market today.

Stripe is a payment processor used by eCommerce businesses. The software handles credit card payments, digital wallets, and other online payment methods. It’s also a strong fit for your clients with subscription businesses, since it has tools to manage recurring payments and the financial metrics that go along with them.
Whether you’re exploring reporting options or are a seasoned Stripe user, here’s how the platform, and the direct integration with AgencyAnalytics, benefits your clients.
Track payments, subscriptions, and monthly recurring revenue
Your ecommerce clients need a seamless, integrative solution to conduct online transactions, which is where Stripe comes in.
Your client can facilitate online transactions through the platform, monitor subscriptions, and estimate monthly recurring revenue (MRR). With those insights, your clients are in a much better position to grow their businesses, scale more effectively, and reach the most profitable customer segments.
Seeing the revenue flow in doesn’t provide the level of actionable analytics most marketing agencies need to optimize client campaigns. Combine these data points instead, and create reports that go beyond the raw numbers.
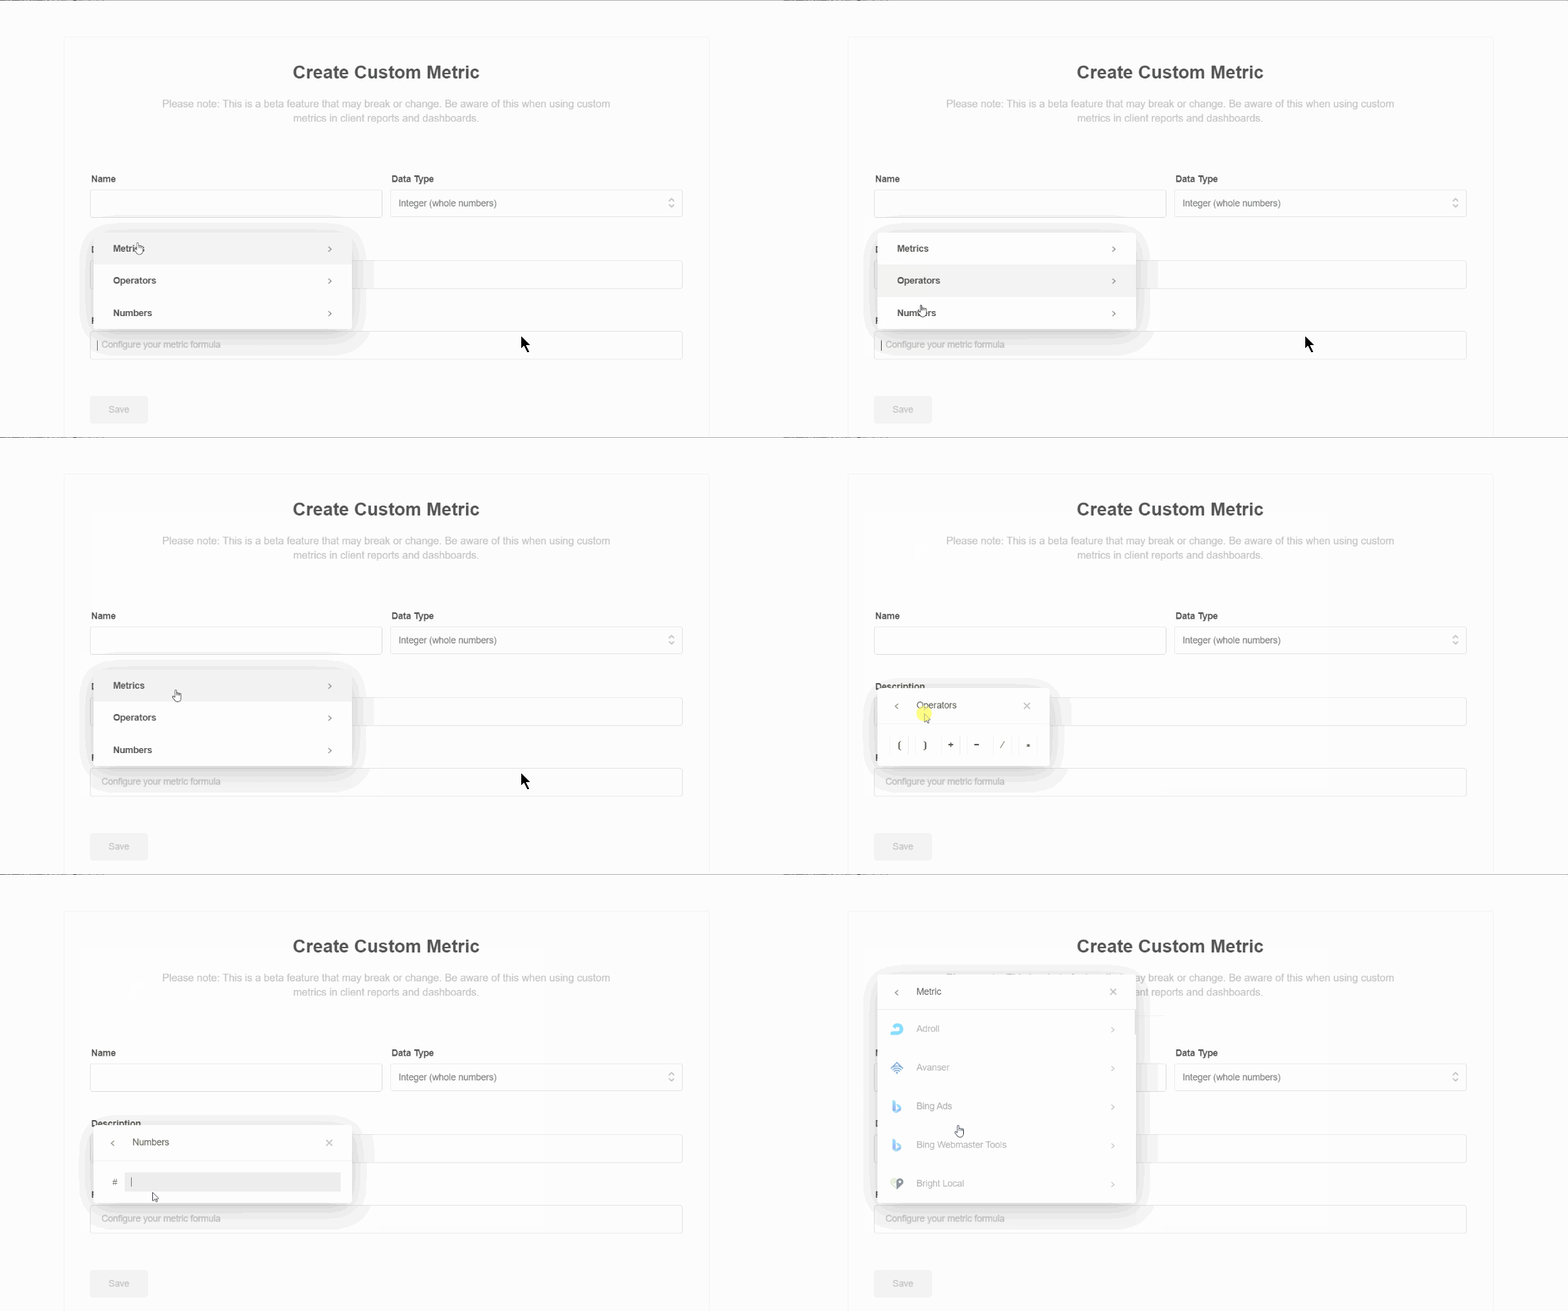
For example, compare the total revenue generated in Stripe against paid ad spend to show the return on the marketing investment. Practically any metric inside the AgencyAnalytics platform can be calculated and transformed into a meaningful custom metric.
Agency Tip: Not all numerical insights are worth reporting on, especially if they don’t tie into your client’s goals or long-term vision. Before pulling random metrics from a data source and sending it to your client, understand the difference between KPIs vs. metrics. That way, you’ll share Stripe data that ties into their long-term goals.
Monitor customer refund trends and infer potential issues
Online transactions are essential pieces of the digital commerce puzzle, but what about refunds? Stripe does the heavy lifting and keeps track of them for you.
Refunds have to be factored in to understand your client’s net profit and set realistic financial projections. Noticing an upward trend in the number of refunds? It could indicate a product or service issue, or it could be that what’s promised in the marketing materials isn’t what the client delivers.
A high refund rate may also point to shortcomings in the customer journey, such as a lack of support after completing a transaction, which is a sign to investigate further.
Either way, a high refund rate is a warning sign that something in the purchase path isn’t aligning correctly and needs to be addressed.
Agency Tip: Stripe data shouldn’t be considered in isolation when trying to understand the bigger marketing picture. To get the most out of client reporting, use data blending and draw insights from other key parameters (such as SEO metrics from Google Analytics or custom metrics if applicable). That way, you’ll make more informed decisions and lead your clients toward success.
The types of Stripe data available to your agency
Digital marketing agencies use Stripe to research new ways to optimize their ecommerce clients’ businesses. For example, they’ll look at the Stripe payment gateway data and determine ways to improve the checkout process, such as reducing cart abandonment rates and increasing conversion metrics.
Customer spending habits directly influence your client’s overall revenue growth. Use this information to help your agency develop data-driven marketing strategies and understand what is driving the business forward, like:
Making decisions about the actual value of new customers, including those with recurring revenue products
Adjusting acquisition campaigns by understanding how much customers are willing to spend on a product and how long they are likely to stay with your clients
Understanding which products are most popular with customers and determining whether or not to offer discounts on certain products
So what types of Stripe data does the platform provide within its dashboards and reports? There are eight categories to work with.
Transaction data
Transaction Volume: The number of transactions processed over a specific time period.
Transaction Value: The total monetary value of transactions processed.
Revenue insights
Revenue Breakdown: Detailed breakdown of revenue by product, service, or subscription plan.
Revenue Trends: Trends in revenue over time, including growth or fluctuations.
Customer behavior
Customer Demographics: Insights into the demographics of paying customers, such as age, location, and gender (if available).
Customer Acquisition: Stripe data on how customers are acquired, through marketing channels, referrals, or other sources.
Subscription metrics
Subscription Growth: Key metrics related to the growth of subscription-based services, including new subscribers, churn rate, and retention.
Subscription Revenue: Revenue generated from subscription plans and the breakdown by plan type.
Payment method data
Preferred Payment Methods: Information on the most commonly used payment methods among active customers, such as debit card transactions.
Payment Conversion Rates: Conversion rates for different payment methods, helping agencies improve checkout rates and overall ecommerce conversion rate optimization.
Geographic insights
Regional Sales Data: Sales data broken down by geographic region or country.
Currency Analysis: Information on the currencies used for transactions and their impact on your clients’ average revenue.
Refund data
Refund Rates: Insights on refund requests and rates, helping identify product or service issues.
A/B testing insights
Checkout Optimization: Stripe data related to A/B testing of checkout processes, aiming to help improve conversion rates.
Where Stripe’s own reporting falls short
Stripe offers dashboards and summaries for payment data in real time. The range of analytics helps clients to:
Identify recent activities that might require immediate action, such as unanswered disputes
Refund a payment or cancel a subscription
Manage the flow of money coming in and out under the Payments tab
Invite team members with different levels of access to manage the business

While Stripe analytics dashboards offer a wide range of data, they are also highly technical and difficult to add to your clients’ larger marketing reports. Reports can be downloaded in a CSV format, but within Stripe, you won’t be able to connect your clients’ ecommerce data to marketing data sources like their PPC campaigns, for example.
The most predominant metrics our clients look for are cost per lead and cost per acquisition (or cost per sale for ecommerce).
Ryan Kelly, CEO, Pear Analytics
The top 16 Stripe metrics your agency should track
Your ecommerce clients can’t make strategic decisions without being guided by the correct Stripe data. A KPI, or Key Performance Indicator, measures the success of an organization in achieving its goals. It offers a clear metric for assessing performance and guiding strategic actions.
Not sure where to begin? Here are the top 16 Stripe metrics to include in your client’s monthly reports, grouped into five areas.
Payment analytics
What’s an ecommerce business without payment analytics? Here’s what to track to help your clients meet their revenue goals.
Metric | Description |
|---|---|
Number of Payments | Use this Stripe data to understand how many online transactions successfully went through. |
Payment Average | The average payment amount across multiple customers shows your client how people are spending, which informs any future pricing changes. |
Discount Amount | Discounts are a good way to incentivize new or existing customers. Keep track of the total discount amount per month to understand how enticing your client’s discounts come across. Also use this metric to determine whether any discount adjustments should be made, for example if discounts are eating too much revenue. |
Discount Average | This metric provides a gauge of the discount amount that subscribers most commonly access. |
Customer analytics
Keeping tabs on Stripe customer analytics is a vital part of any business. Here are the most important ones to keep in mind.

Metric | Description |
|---|---|
New Customers | Your clients may have a new customer KPI to meet each month or quarter. Track this Stripe metric so you know how to advise on any changes or improvements to your client’s marketing strategy. |
Existing Customers | For clients with subscription-based businesses, monitoring the number of existing customers is especially important. Use this metric to gauge customer satisfaction, future projections, and any possible brand loyalist incentives. |
Number of Disputes | Disputes happen when a customer queries a card transaction. While this may occasionally occur, an unusually high number of disputes may indicate fraudulent transactions, which you should look further into. |
Refund analytics
For any business, it’s normal to process refunds from time to time. An uptick in refunds is a cause for concern, though, and could indicate a product or service issue.
Here are the Stripe refund analytics to pay attention to, and to analyze or contextualize further if needed.
Metric | Description |
|---|---|
Refund Amount | This metric directly affects your client’s bottom line and net profit, so watch for any significant changes. Keep your client’s customer service and sales teams in the loop where applicable, as an increase in this amount may point to a possible product or support issue. |
Refund Average | There may be fluctuations in monthly refunded amounts, which is why you should monitor refund average over time. |
Subscription analytics
When your clients depend on subscriptions to keep their businesses afloat, you need to provide them with information that matters. Use these Stripe subscription metrics to better gauge what’s happening.
Metric | Description |
|---|---|
Monthly Recurring Revenue (MRR) | Use this metric to track how much revenue your client can expect to receive per month based on newly onboarded or existing subscriptions. MRR is helpful for financial projections, strategic planning, and setting targets. |
New Subscribers | Clients with business growth goals will likely aim to onboard new subscribers. Track this Stripe metric to identify any significant growth or decline. If your client runs new marketing initiatives, this number shows how they performed. |
Trial Conversion Rate | If your client offers a free trial before customers commit to a subscription, add Stripe’s trial conversion rate to their tracking radar. |
Average Revenue per Subscriber (ARPS) | ARPS shows your clients how much they can expect to make from each subscriber in their database, on average. It’s calculated by taking your client’s MRR divided by their total number of active subscribers. |
Subscription churn analytics
As your agency knows, you can’t improve what you don’t track. It’s crucial to understand why churn happens and to put measures in place to reduce it.
Whether it’s an automatic reorder or a SaaS subscription, close any gaps in your client’s customer support system that these subscription churn metrics identify.
Metric | Description |
|---|---|
Churned Subscriptions | Use churn rate to understand the percentage of subscribers that stop doing business with your client. This may be because of dissatisfaction, failure to renew a previous subscription, or a move to a competitor’s platform. |
Retention Rate | Retention rate is a percentage metric that gauges the number of customers retained over a period of time. Customer retention keeps subscription-based businesses going, which is why you should keep an eye on this metric. |
Subscriber Lifetime Value | A measure of how much revenue your client can expect from a customer between the start and end of their subscription period. |
Agency Tip: Tracking Stripe data is only one part of the puzzle when it comes to ecommerce success. Incorporate a variety of marketing tactics (such as ecommerce email marketing and monitoring website health through Google Analytics). That way, you’ll be able to report on micro conversions, build your client’s brand reputation, and increase the likelihood of future transactions.
Connect the Stripe integration in three steps
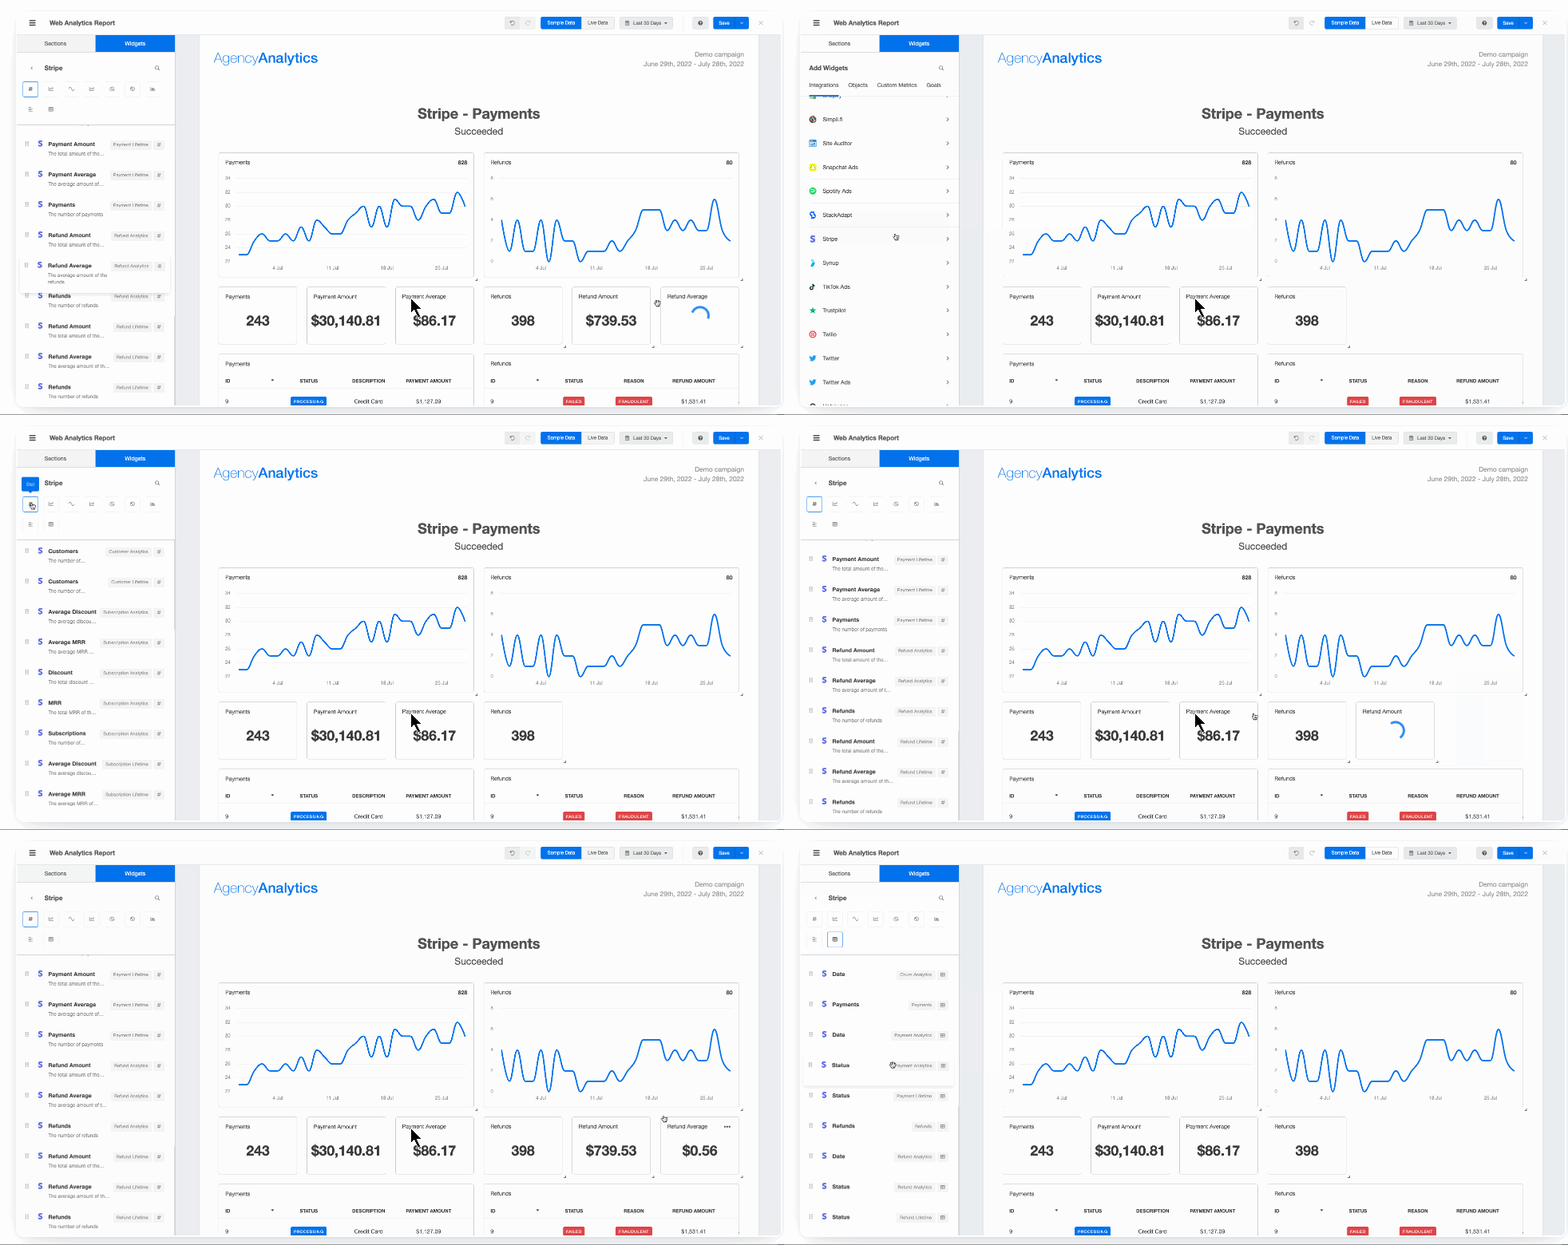
As you can see in the .gif below, setting up the Stripe integration for your ecommerce clients is straightforward. All you need to do is follow these three steps:

Navigate to the campaign you want to connect to the Stripe integration.
Click on Integrations from the menu bar, then select Stripe from the list of integrations. You’ll first be prompted to connect a new account, which requires entering your Stripe credentials.
Once you enter the login credentials, the integration is complete, and your client’s Stripe payments and subscription data will be imported and displayed within the dashboard.
What to include in your Stripe dashboard
Aside from creating custom metrics, the AgencyAnalytics Stripe dashboard offers critical ecommerce analytics to measure the success of your agency’s strategies.
Here are the dedicated sections to build into your Stripe dashboard so you’re meeting your client’s ecommerce goals.
1. Account overview
The first tab in your Stripe analytics dashboard showcases insights into your client’s overall financial performance. This is where the total amount of payments and refunds processed and the current MRR for active subscriptions are shown.

Widgets include both active and lifetime Stripe data to give you the complete picture. We recommend tracking the following metrics:
Active Subscriptions
Current MRR
Current Average MRR
Discounts Applied
Average Discount
Top Subscription Prices
All Subscription Statuses
Customers by Country
Total Payments Processed (Lifetime)
Total Payment Amount Received (Lifetime)
Average Payment Amount (Lifetime)
Total Number of Refunds Issued (Lifetime)
Total Amount of Refunds Issued (Lifetime)
Average Refund Amount (Lifetime)
2. Payments
Next, show how payments, refunds, and gross revenue retention have increased over time with easy-to-understand data visualization that helps marketing agencies and clients alike. For example, use line graphs to track and communicate the client’s business growth over a period of time.

Set a specific date range, or use the compare feature to see how successful and failed payments have changed month over month or year over year. Include widgets such as:
Payments (Line Graph)
Refunds (Line Graph)
Total Payments
Total Payment Amount
Average Payment Amount
Total Refunds
Total Refund Amount Recent Payments
Recent Refunds
Payment Details (Table)
Refund Details (Table)
3. Customers
The last tab in your client’s Stripe dashboard is dedicated to their customers. This section provides a quick overview of your client’s current customer base and lets them track its growth over time.
Use this part of your Stripe dashboard to offer user-friendly visualizations that pinpoint your client’s best geographic locations. Highlight active customers, paying customers, and any information on rich customer profiles to gain insights on how to engage with potential new customers.

Widgets to include in this section:
New Customers During Set Period
New Customers by Country
New Customer Details (including name, description, email, country, and date)
Streamline your clients’ key metrics in one place

Your agency may currently rely on combing through the data in your client’s Stripe account, or on free options such as Google Data Studio reporting. That isn’t always sustainable. Scaling agencies need to plan for the increasing demands that come with growth.
And even though Stripe data provides real value, one data source isn’t enough to understand the overall marketing picture. Whether you’re driving demand or running an ecommerce conversion rate optimization program, it’s too time-consuming to pull metrics manually from Google Analytics, Facebook, and other ecommerce tools every month.
Consolidate these metrics in one place instead. With AgencyAnalytics, you can use the customizable Stripe reporting dashboard to streamline that data with the click of a button.
From tracking Stripe conversion metrics to ecommerce analytics, AgencyAnalytics makes client reporting straightforward.
Create white-labeled reports with data visualization tools and give your clients the power to make informed decisions. Try AgencyAnalytics today, free for 14 days (no credit card required).
Faryal Khan is a multidisciplinary creative with 10+ years of experience in marketing and communications. Drawing on her background in statistics and psychology, she fuses storytelling with data to craft narratives that both inform and inspire.
Read more posts by Faryal KhanWhat other agency experts are reading

The Top 39 eCommerce KPIs That Drive Growth
Master eCommerce KPIs and learn how they tie into campaign and client performance with this practical, insightful guide. Drive growth, success, and client satisfaction.

17 important Facebook metrics to track: The complete guide
Track the 17 most important Facebook metrics in 2025—from reach to ad performance—and learn where to find them to optimize campaigns and client reporting.

12 email marketing KPIs you should track & share with clients
Email marketing KPIs help marketing agencies understand campaign effectiveness and target audience engagement, aligning with client goals.