Churn Rate
Customer Satisfaction
Gauge how effective products or services are at meeting customer needs.
Customer Retention
Identify when and why customers leave and address their pain points to entice them to stay.
Customer Segmentation
Analyze the churn behavior of different customer segments and develop targeted strategies.
Product or Service Improvements
Determine if customers are leaving due to lacking features or support and fix those gaps.
Why Churn Rate Is Important
Churn Rate is a key metric that contributes to the long-term viability of a business. By measuring the rate at which a business loses customers, the Churn Rate not only reflects customer satisfaction (or more accurately, the lack of it) but also customer loyalty and retention.
In advertising, customer churn is a critical metric for evaluating the success of a campaign, especially if one of the campaign’s goals is focused on customer re-engagement, retention, satisfaction, or loyalty.
Churn Rate is calculated in numerous contexts depending on the business and vertical. For example, customer churn represents the loss of subscribers to a software platform or the number of regular customers who are now purchasing from a competitor.
Since customer retention is generally more cost-effective than customer acquisition, Churn Rate is an essential indicator for achieving sustainable growth.
Stop Wasting Time on Reports. Get Marketing Insights Faster & Drive Results.
How Churn Rate Relates To Other KPIs
Customer Churn Rate has a direct impact on many important KPIs related to customer engagement, satisfaction, and retention.
Firstly, Churn Rate is the inverse of Customer Retention Rate (CRR), which means when the Churn Rate is falling, the Customer Retention Rate is increasing and vice versa.
A low Churn Rate would typically influence higher Customer Lifetime Value (CLV) and lower Customer Acquisition Cost (CAC), given that existing customers are being maintained over time. High Customer Churn Rate would have the opposite effect, raising the cost of acquiring new customers and necessitating the funneling of additional funds into continuing campaigns.
The Long-Term Ramifications of Customer Churn Rate
A high monthly Churn Rate doesn't just indicate lost customers; it forecasts eroding recurring revenue streams. The term "revenue Churn Rate" is central here, quantifying the financial impact of each churned customer. It's not just about the current month’s revenue; it's the loss of all potential future revenue from that individual.
Churned customers mean less incoming revenue, reducing the funds available for essential scaling activities such as product development, marketing, and hiring talented employees. As a result, high customer churn changes a company's overall growth trajectory, constraining it from reaching its full potential and competitive edge. Reduced investment capability creates a ripple effect, making it even more challenging to lower customer churn in the future. So, the financial burden of churn is not just immediate but has long-term implications that may stall or even reverse business growth.

The Benefits of Negative Churn Rate
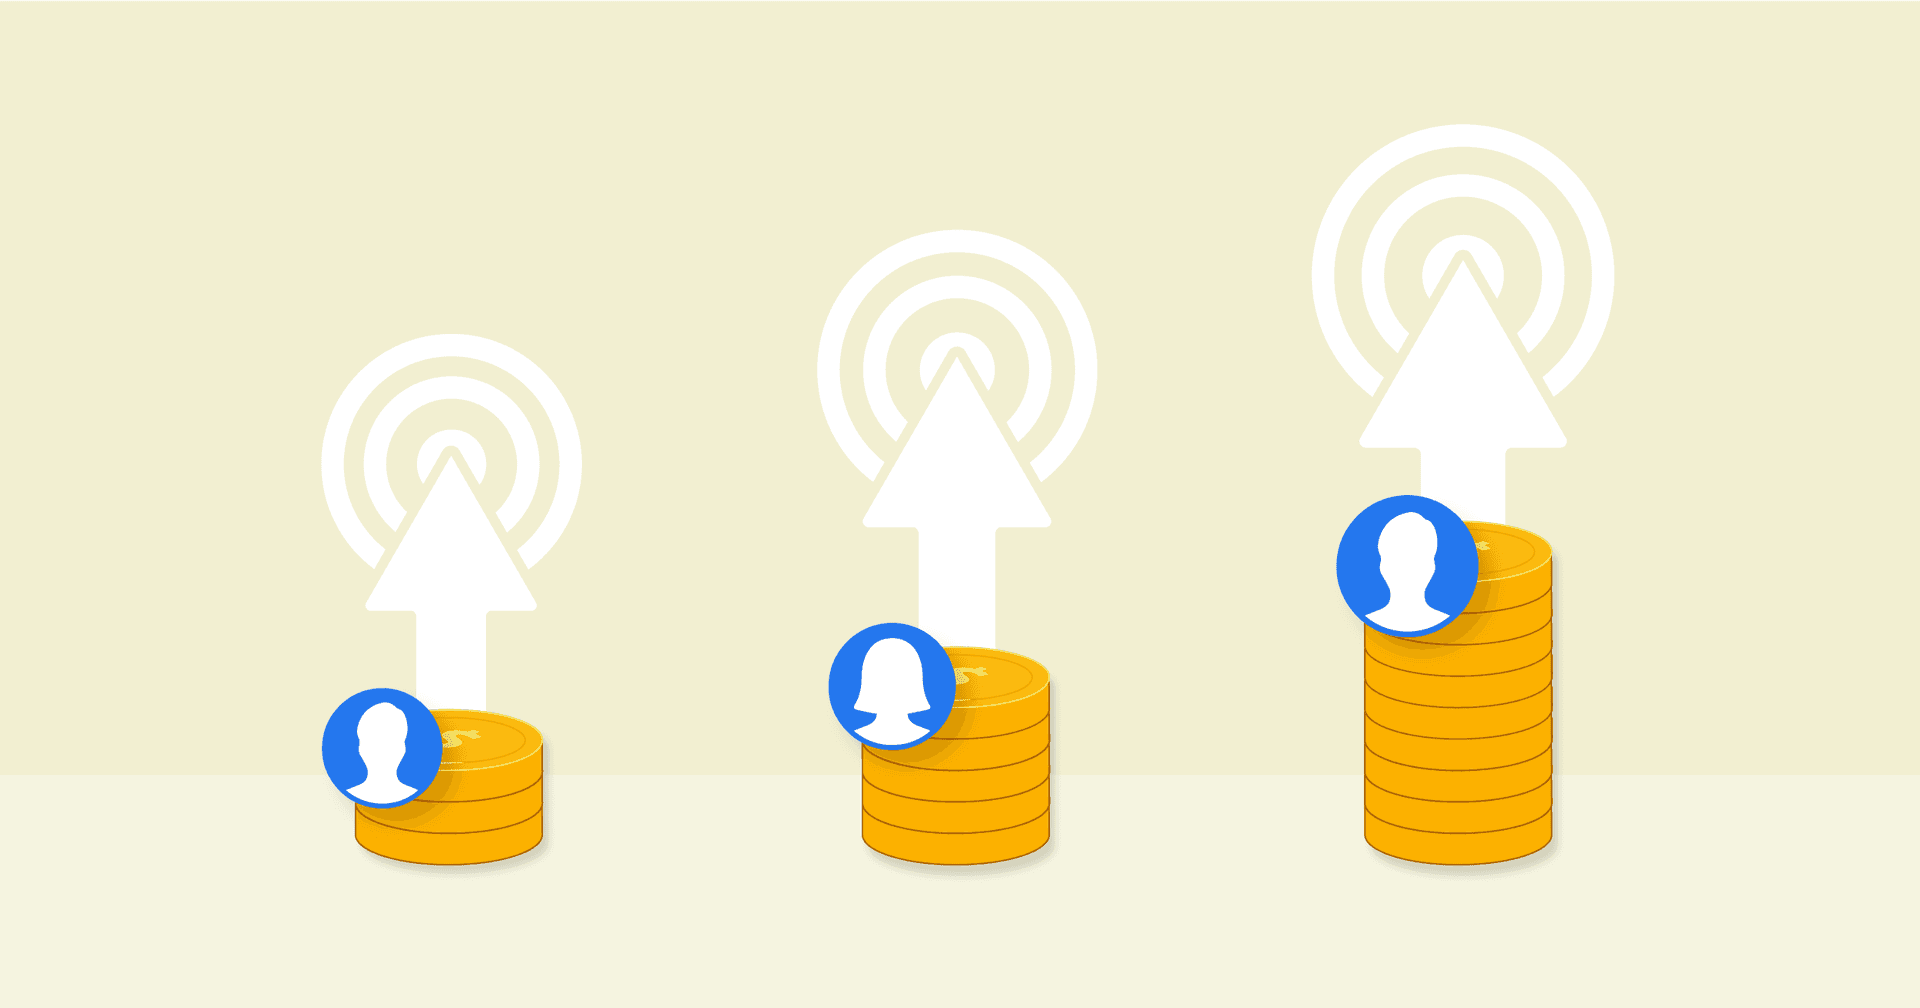
Negative Churn Rate, otherwise referred to as Net Negative Churn, occurs when the value gained from existing customers through upsells, cross-sells, or additional purchases exceeds the revenue lost from churned customers within a specific time frame. In other words, even if some customers leave, the overall revenue from the remaining customer base actually increases.
This is often seen in subscription-based models where customers not only retain their subscriptions but also opt for more expensive plans or additional features. Negative Churn Rate is a strong indicator of customer satisfaction and product value, suggesting that a business is not only retaining but also maximizing revenue from its existing customer base.
After defining the goals and objectives with our client, we identify the key metrics for the campaign. We typically look at CTR, Conversion rate, cost per conversion and ROAS after a match-back process. We also take a look at the lifetime value of a customer to show the efficacy of long-term ROI. We compare these stats over time and chart out the progress using graphs. This also highlights our efforts in continued optimization of the campaigns.
How To Calculate Churn Rate
Churn Rates are relatively easy to calculate. Marketing agencies calculate how many customers have stopped doing business with the agency or a client's business.
To calculate churn rate, first define the time period. The agency needs to decide whether to look at the Churn Rate for the last week, month, or quarter when calculating churn rate.
Next, find the number of subscribers or customers lost during that time by subtracting the number of customers at the end of the period from the number of customers at the start.
To calculate customer Churn Rate, divide the number of lost customers by the total number of customers at the start of the period. Finally, multiply by 100 to turn the Churn Rate into a percentage.
To calculate the gross revenue Churn Rate, apply the same formula but focus on the monetary value contributed by customers rather than the number of customers.
Customer Churn Rate Formula Example
What Is a Good Average Churn Rate?
In general, the lower the Churn Rate, the better, but the Churn varies wildly based on the business and vertical.
A good average Customer Churn Rate for a subscription-based model depends on the industry. For consumer-focused companies, a Churn Rate of 5-7% is generally favorable. In the B2B sector, around 5% is considered healthy. However, these figures are not universal. For example, a SaaS company often aims for a Customer Churn Rate below 3%.
Most businesses aim to have a Churn Rate that decreases over time and will monitor it closely.
What Is a Bad Average Churn Rate?
Generally, a higher Churn Rate is bad for business, especially when customer churn exceeds new customer acquisition. If the agency notices the Churn Rate increasing over time, that is a red flag, and it requires investigating to find out why.
A Churn Rate exceeding 10% signals trouble, but the specific threshold for concern depends on the industry. In mobile apps, a 20-30% Customer Churn Rate is usually problematic. It's critical to recognize that industry standards differ substantially; what's acceptable in one sector may be cause for concern in another.
How To Set Churn Rate Benchmarks and Goals
If industry benchmarks are not readily available benchmarks, agencies often rely on historical data for benchmarking. Analyze the client’s performance over the last quarters or years and find the trends.
Another approach is to work backward and calculate the required Churn Rate to achieve specific revenue targets, providing a tailored benchmark. For example, if the client’s current churn rate is 14%, setting targets to reduce that over the next two quarters shows a steady progression toward improved client retention. This way, revenue contribution to business growth comes from both acquisition and increased customer loyalty.
For a nuanced understanding of Customer Churn Rate, segmentation is also key. Evaluate churn by customer lifetime value, product type, pricing tier, or geographic location. Another useful approach is categorizing churn based on reasons for customer departure. This segmented data offers actionable insights, equipping businesses to implement targeted retention strategies.

Why Churn Rate Matters to Clients
Churn Rate is a critical metric for clients focused on sustainable revenue growth. High customer churn indicates they are losing existing customers and is a problem that needs investigating. After all, how much recurring customers pay has a direct impact on the client’s bottom line.
It is typically easier and more cost-effective to retain and re-engage existing customers than to acquire new customers, so, Churn Rate should matter to all clients because it reflects customer satisfaction (or the lack of it).
For businesses that rely on a subscription model, such as SaaS services and platforms, customer churn is an essential metric for forecasting recurring revenue, growth, and profitability.

Why Churn Rate Matters to Agencies
Churn Rate is important to agencies because it helps identify problem areas in the journey of their clients’ customers. If a campaign has been successful in acquiring new customers for a client, but the customers are leaving shortly after interacting with the product, bigger discussions need to take place with the client’s internal team.
Agencies calculate Churn Rate to address their own business growth. Low Customer Churn Rate also helps an agency attract new clients, as satisfied clients often become advocates for the agency through recommendations and word-of-mouth. High customer satisfaction is an effective competitive advantage.
A high Churn Rate is usually indicative of one or more factors, including satisfaction with the agency’s quality of work, client communication and relationships, agency responsiveness, or a client's financial constraints.

Better, Faster & Easier Client Reports Are Just a Few Clicks Away
Best Practices When Analyzing & Reporting on Churn Rate
Analyzing Churn Rate from multiple perspectives establishes a robust framework for customer retention and satisfaction. Follow these best practices to give clients a well-rounded, easy-to-understand, and actionable view of their Churn Rate.
Measure Churn Rate Over Time
Assessing Churn Rate over time offers valuable insights into whether customer satisfaction is increasing, decreasing, or remaining stable over time. The goal is to see Churn Rate decrease over time, and if it’s not, detect problems early and prevent them from becoming bigger issues.
Analyze Churn Rate Across Campaigns
Not all channels or campaigns are created equal, and the level of customer satisfaction often varies. Comparing the Churn Rate of different acquisition programs identifies the most effective marketing platforms with the highest customer satisfaction, guiding efforts to those areas.
Interpret Trends and Anomalies in Churn Rate
Any sudden or unexpected change in Churn Rate is worth investigating, whether it’s good or bad. A sudden spike in Churn Rate could indicate issues with the product or service, or a new competitor entering the market.
Put Churn Rate in Context
Consider Churn Rate within the context of other related metrics to get the full picture. Customer Lifetime Value (CLV) and Customer Acquisition Cost (CAC) are very important to providing additional context.
Visualize Churn Rate Performance
Numbers on a spreadsheet are daunting, so turn those digits into easily digestible visuals. Trends in Churn Rate will become more apparent, and clients will quickly grasp how fluctuations in Customer Churn Rate correspond to other metrics or campaign changes.
Align Churn Rate to Client Goals
Finish off the report by showing clients how Churn Rate connects to their specific business objectives, whether it’s increased customer satisfaction, greater CLV, or a lower Product Return Rate. Showing that Churn Rate helps clients achieve their goals will validate the agency’s marketing efforts.
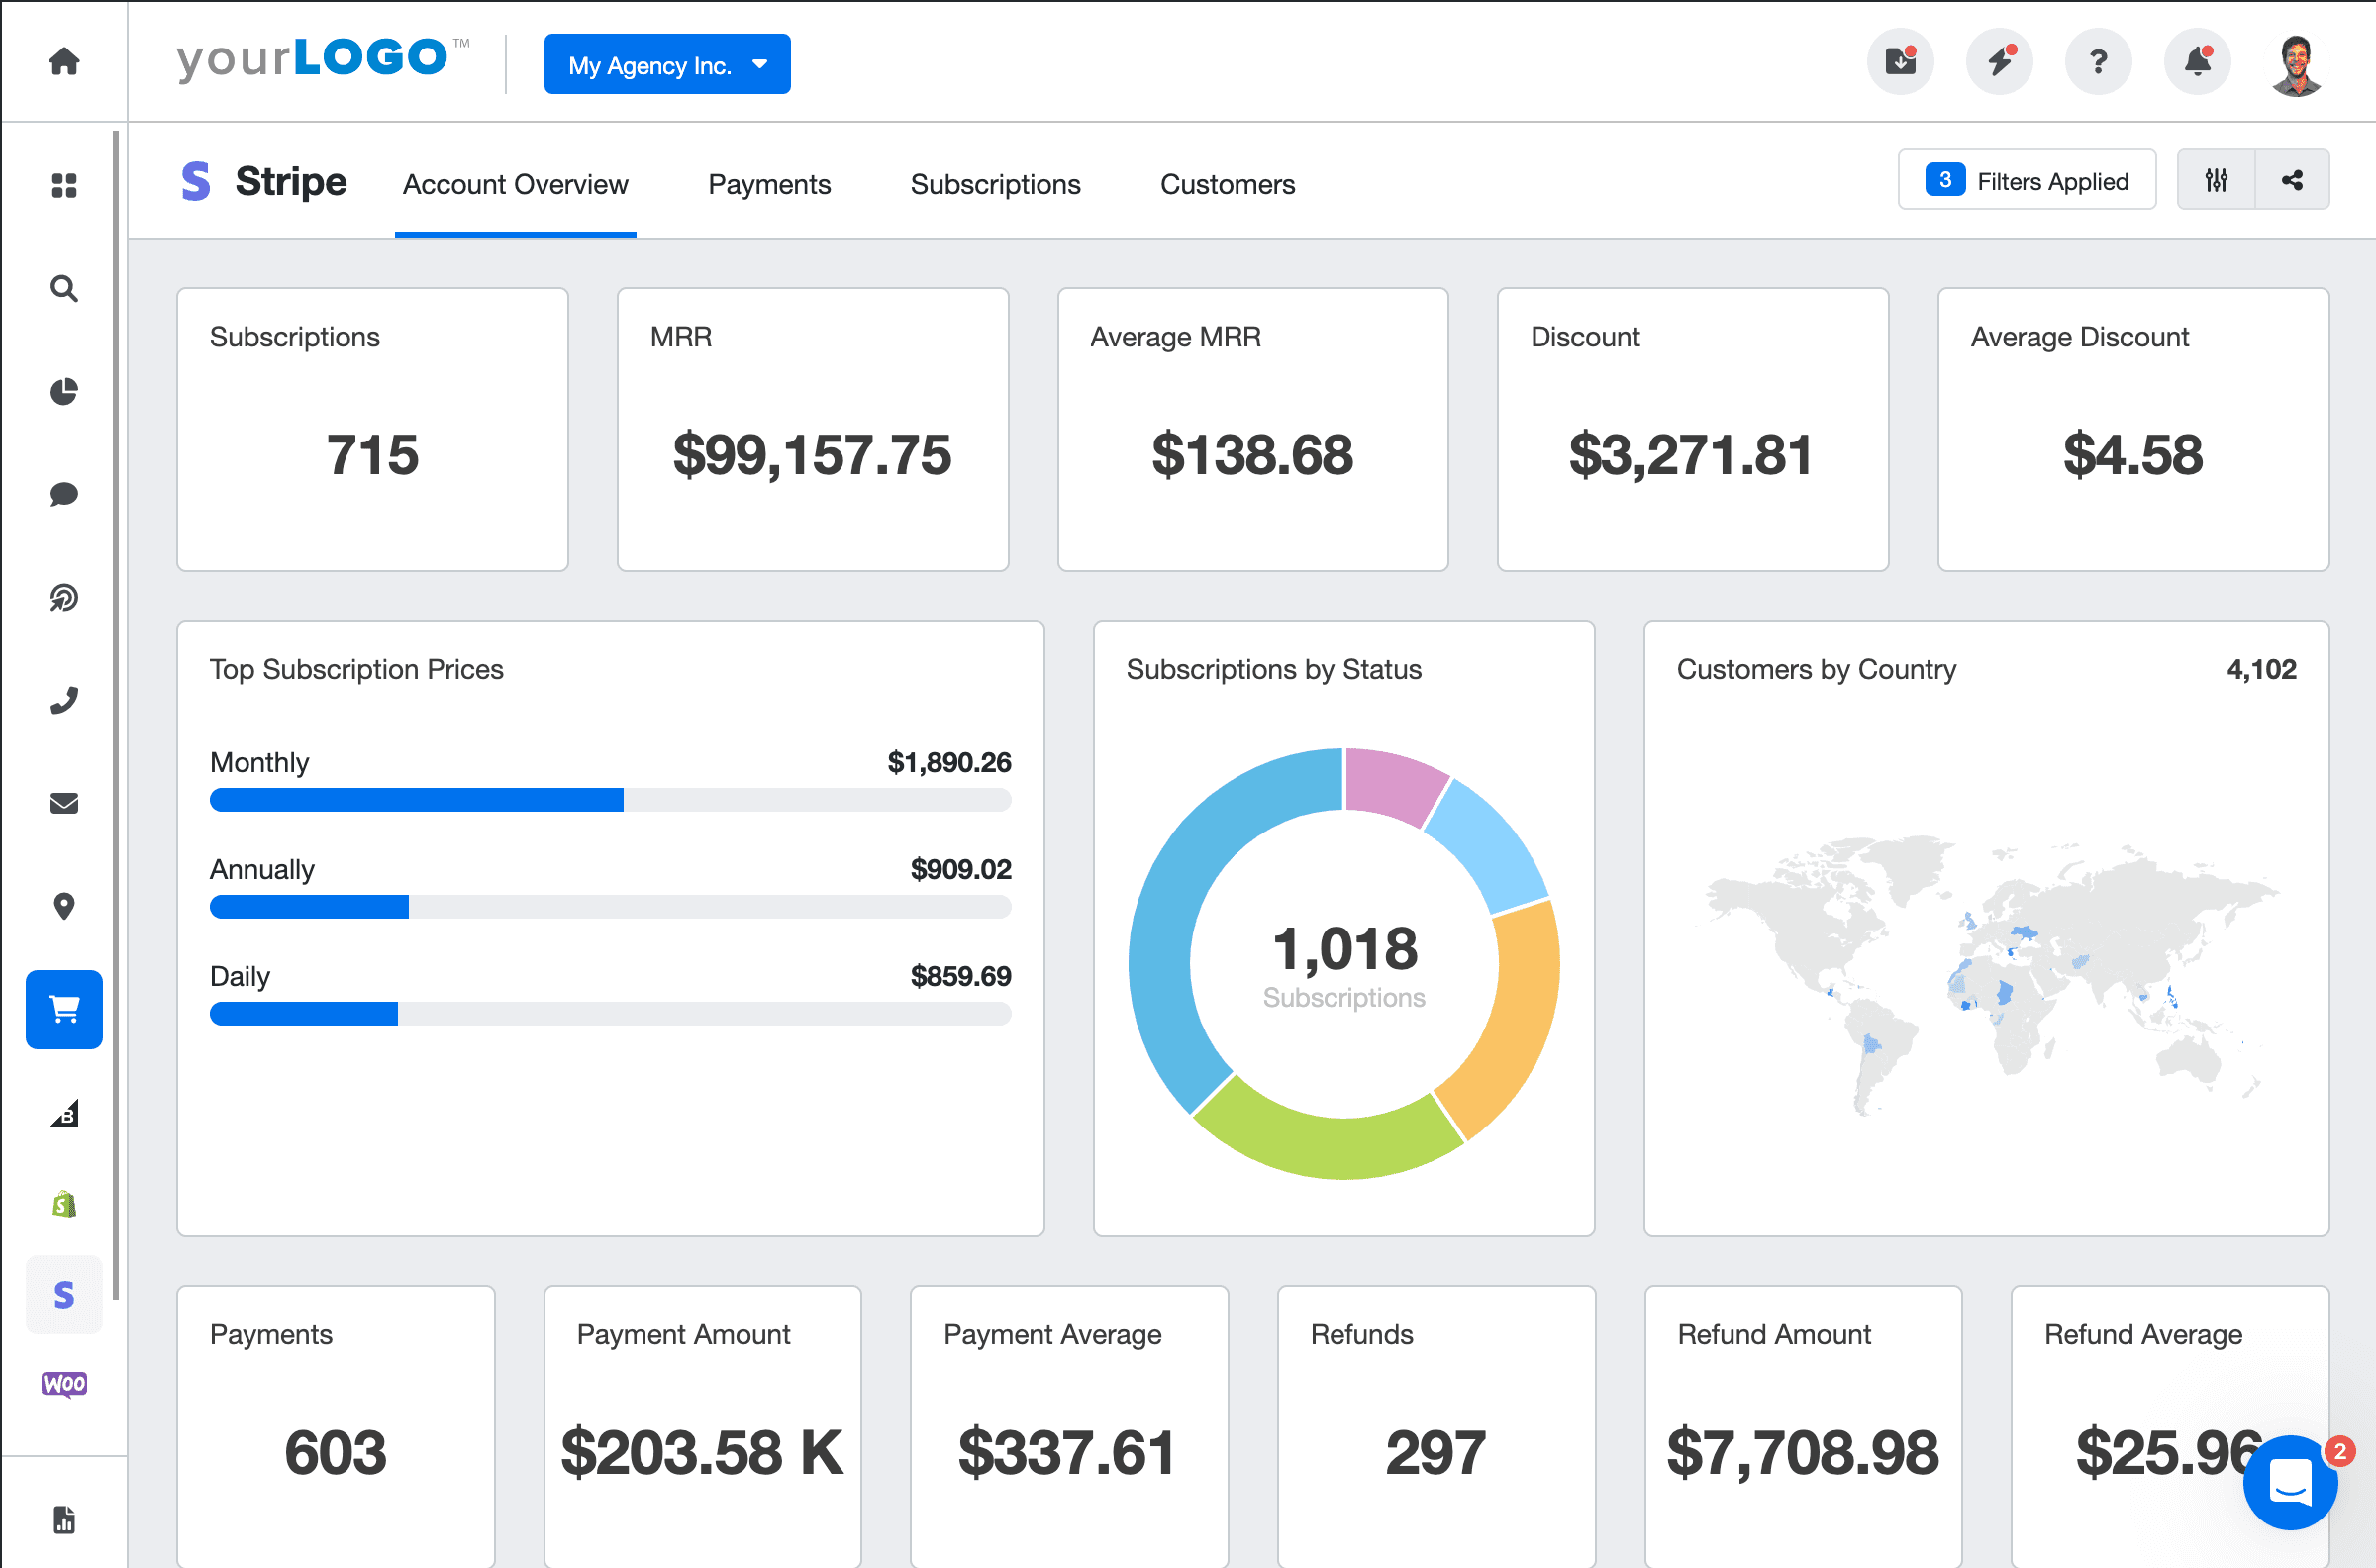
Stripe Dashboard Example
Related Integrations
How To Improve Churn Rate
Lowering customer churn leads to increased revenue and greater CLV. Here are 3 tips for improving Customer Churn Rate.
Personalized and Targeted Campaigns
Leverage data to segment customers and deliver customized strategies to increase retention and customer satisfaction.
Improve Customer Engagement
Regularly engage with customers and do it often. It can be anything from a weekly newsletter or interacting with comments on social media posts.
Outstanding Customer Support
Provide exceptional customer service that ensures customer satisfaction. Listen to feedback and resolve issues quickly in a friendly and knowledgeable way.
Related Blog Posts
See how 7,000+ marketing agencies help clients win
Free 14-day trial. No credit card required.


