Net Revenue Retention (NRR)
Performance Tracking
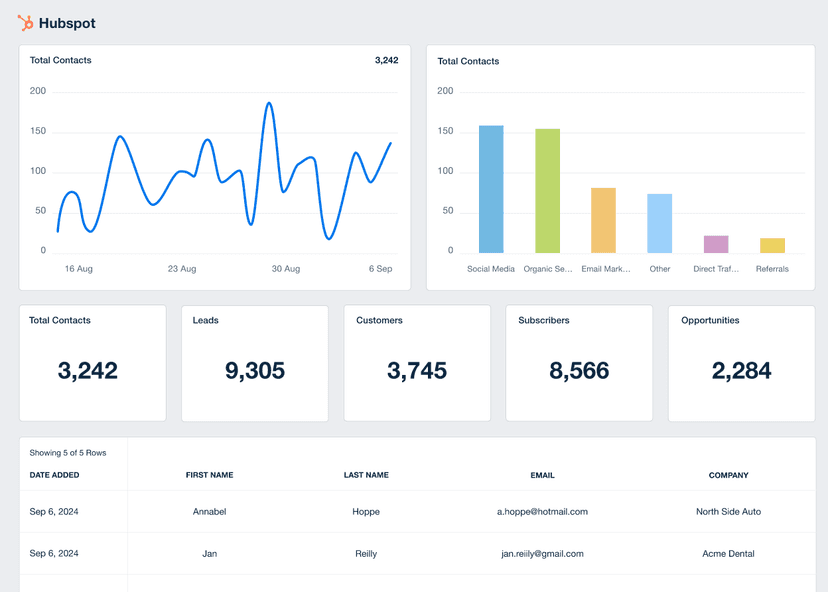
Monitor NRR to gauge financial health and customer satisfaction.
Revenue Forecasting
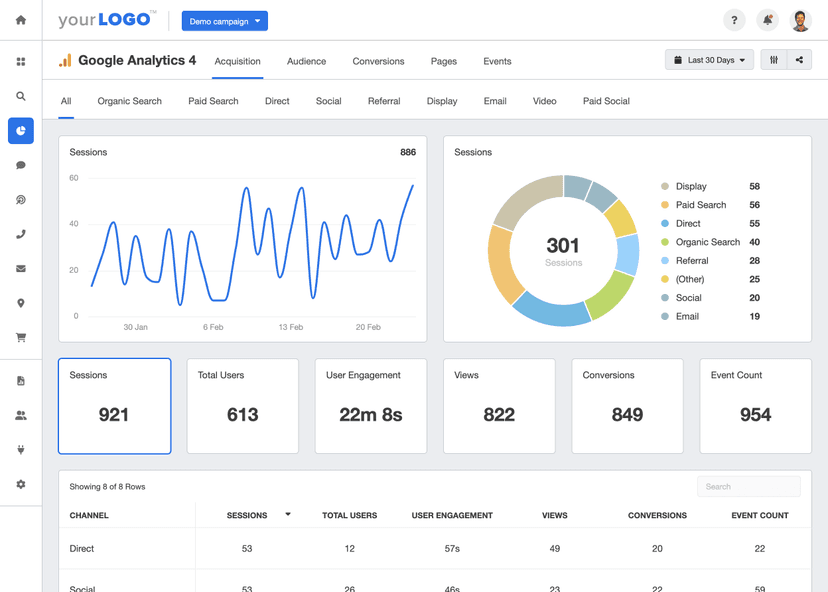
Use NRR for predicting future revenue and growth potential.
Client Reporting
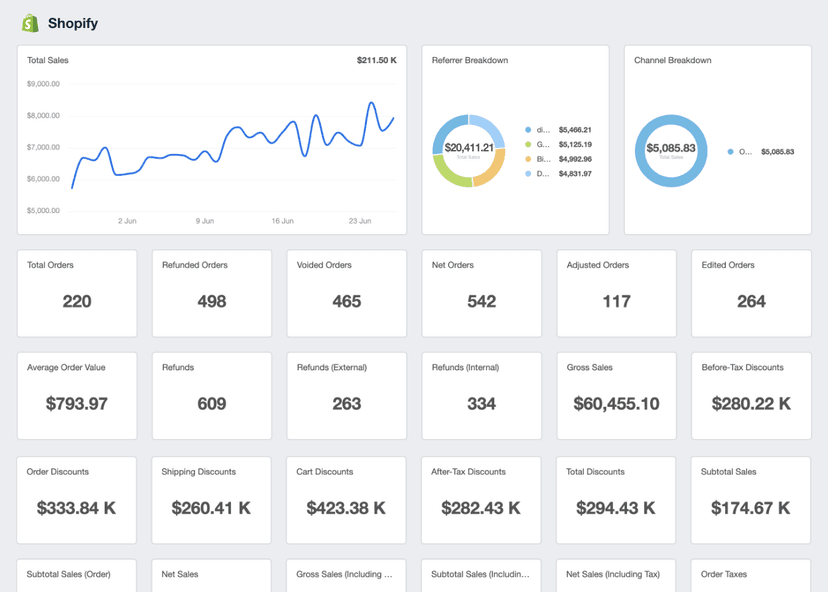
Highlight NRR in reports to showcase long-term client value.
Customer Insights
Analyze NRR to gain insights into customer behavior and preferences.
Why Net Revenue Retention Is Important
Net Revenue Retention assesses a business's financial stability and growth potential. NRR transcends traditional revenue tracking by encompassing various factors, highlighting the stability and growth potential through existing customer bases. As such, a strong NRR suggests effective customer satisfaction and loyalty strategies, pivotal for sustainable growth.
High Net Revenue Retention rates often signal future revenue stability. It's a more nuanced predictor than acquisition metrics, indicating the current success and long-term viability. NRR's focus on current revenue, expansion revenue, and churn underlines the importance of profitable growth strategies that lead to recurring revenue.

Stop Wasting Time on Reports. Get Marketing Insights Faster & Drive Results.
Net Revenue Retention and Its Correlation With Other Metrics
Net Revenue Retention, also known as Net Dollar Retention, is a metric deeply interconnected with several other key performance indicators, particularly for SaaS businesses.
Gross revenue retention and annual recurring revenue are closely linked to NRR. While gross revenue retention focuses on the baseline stability of revenue, NRR adds an additional layer by accounting for revenue fluctuations due to upsells and downsells. This relationship offers a multifaceted view of financial stability.
Customer churn and revenue churn are also critical factors influencing NRR. High customer churn rates negatively impact NRR, indicating a loss of customer base and revenue.
Custom satisfaction scores and daily, weekly, and monthly active users also play a role. An increase in active, satisfied users typically leads to higher revenue retention opportunities, positively impacting NRR. These metrics collectively offer insights into customer engagement levels, usage trends, and potential revenue growth areas.

Key Factors That Impact Net Revenue Retention
For many SaaS businesses, product and service quality directly affect NRR. Superior quality and continuous improvement lead to enhanced customer loyalty and reduce the likelihood of downgrades or cancellations, driving a stronger NRR rate.
Pricing strategies are another critical factor. Competitive and value-based pricing enhances customer retention, positively affecting NRR. Pricing should also be considered in the context of market conditions and competition. In a highly competitive market, customers have more alternatives, which may increase churn rates if a business fails to effectively differentiate. Adapting to market changes and customer needs is essential for maintaining a strong NRR.
Lastly, effective customer communication and support significantly influence NRR. Proactive customer engagement, addressing concerns, and providing value-added services are all actions that enhance customer loyalty.
How To Calculate Net Revenue Retention
Net Revenue Retention is calculated by assessing the revenue from existing customers over a specific period, taking into account expansions, contractions, and churn.
To calculate NRR, start with the total revenue from existing customers at the beginning of a period. Add any expansion revenue gained from these customers during the period through upsells or cross-sells. Then, subtract any revenue lost due to churn or downgrades. Divide this result by the total revenue at the beginning of the period, and multiply by 100 to get the NRR percentage.
Net Revenue Retention Formula Example
What Is a Good NRR Rate?
A good average Net Revenue Retention rate is typically above 100%, indicating that the revenue from the existing customer base is growing. When the business is gaining more from expansion revenue than it is losing from churn, this is a strong indicator of healthy customer relationships and effective upsell strategies.
What Is a Bad NRR Rate?
A bad average NRR rate falls below 100%, signifying that a business is losing more revenue from churn and downgrades than it is gaining from expansions. This situation calls for immediate attention to customer success strategies and an in-depth analysis of the reasons behind the lost revenue.
How To Set Net Revenue Retention Benchmarks and Goals
Net Revenue Retention benchmarks help businesses, especially SaaS companies, assess the effectiveness of product and marketing efforts to retain and grow revenue from an existing customer base. These benchmarks provide insights into how well a business manages customer success and minimizes lost revenue.
However, benchmarks vary by industry, company size, and market conditions. Therefore, it's essential to view historical NRR trends within the business and set realistic goals for improvement. This involves analyzing past performance to identify patterns and areas for customer success interventions. Incremental improvements in NRR significantly impact monthly recurring revenue and overall financial health.
To align NRR with broader financial objectives, back-calculate the necessary improvements in NRR to meet top-line revenue targets. This involves determining how much revenue needs to be retained and grown from the existing customer base to reach desired financial outcomes. For instance, if a company aims to increase its total revenue by 50%, calculate the required NRR rate that would contribute to this goal, considering factors like expected new customer acquisition and Average Revenue Per User (ARPU).

Net Revenue Retention vs. Gross Revenue Retention
Gross Revenue Retention (GRR) focuses strictly on the retained revenue, excluding any expansion revenue. GRR is calculated using the gross revenue retention formula, which essentially takes the starting revenue, subtracts any lost revenue due to churn, and divides this figure by the starting revenue.
This calculation provides a baseline understanding of how well a business is maintaining its existing revenue streams, without the influence of additional earnings from upsells or cross-sells. By contrast, NRR includes expansion revenue, making it a critical indicator for overall SaaS business health.

Why Net Revenue Retention Matters to Clients
Clients view NRR as a critical indicator of their business's health. Its significance lies in its ability to provide a comprehensive view of a company's financial health and customer relationship strength. Taking a step beyond the gross revenue retention formula, it offers a more nuanced understanding of how well a business is managing its existing customer base.
High NRR rates are indicative of strong customer loyalty and effective upselling strategies, both of which are crucial for long-term business sustainability.

Why Net Revenue Retention Matters to Agencies
For agencies, NRR is equally important but for slightly different reasons. It serves as a barometer for the effectiveness of the strategies they implement for clients. A rising NRR under an agency's guidance showcases its ability to acquire new customers with a strong product-market fit, foster customer retention, and facilitate revenue growth.
Agencies prioritize NRR as it directly reflects the impact of their efforts on a client’s long-term business health. A growing NRR signifies successful client campaigns, and indicates rising customer engagement and revenue growth.

The 'Land and Expand' Strategy in SaaS Businesses
Central to SaaS product management is the "land and expand" strategy, where the initial sale, or the 'land,' is just the beginning of the customer journey. The 'expand' component is where NRR gains its significance.
After landing a client, the focus shifts to expanding their usage. Here, the goal is to deepen the customer's engagement with the product, often through upselling additional features, cross-selling related products, or enhancing the customer's usage and reliance on the product.
This strategy directly influences NRR, as it aims to grow the revenue from existing customers, a key factor in this metric.
Discover the Client Reporting Platform Trusted by Over {{customer-count}} Marketing Agencies
Best Practices When Analyzing and Reporting on Net Revenue Retention
Enhancing Net Revenue Retention is a goal that guides strategic decisions. That’s why the "land and expand" mantra–central to many SaaS strategies–hinges on the effective analysis and reporting of NRR.
Accuracy in Data Measurement
Ensuring that all revenue streams from upsells, cross-sells, downgrades, and churn are accurately captured and categorized is critical. A clear understanding of growth is what makes Net Revenue Retention important to growing businesses.
Trend Analysis Over Time
Examine NRR trends over time to develop a dynamic view of customer behavior and business health. This long-term perspective helps identify patterns and anomalies in revenue retention and growth, aiding in strategic planning and forecasting.
Channel and Campaign Comparison
Compare NRR across different channels and campaigns to uncover insights into the most effective strategies for product-fit alignment, customer retention, and revenue expansion. This enables the efficient allocation of resources to customer segments.
Contextualize NRR
Put NRR into context with other business metrics and market conditions. Understanding how external factors like market trends and internal changes like product updates affect NRR provides more actionable insights.
Visualization for Clarity
Visualize NRR data through charts and graphs to ease comprehension and communication. These visual aids make it easier to convey complex data to stakeholders, facilitating clearer discussions and decisions.
Alignment With Business Goals
Aligning NRR analysis with overall business goals ensures that retention strategies contribute to the company's broader objectives. This alignment helps in prioritizing initiatives that have the most significant impact on NRR.
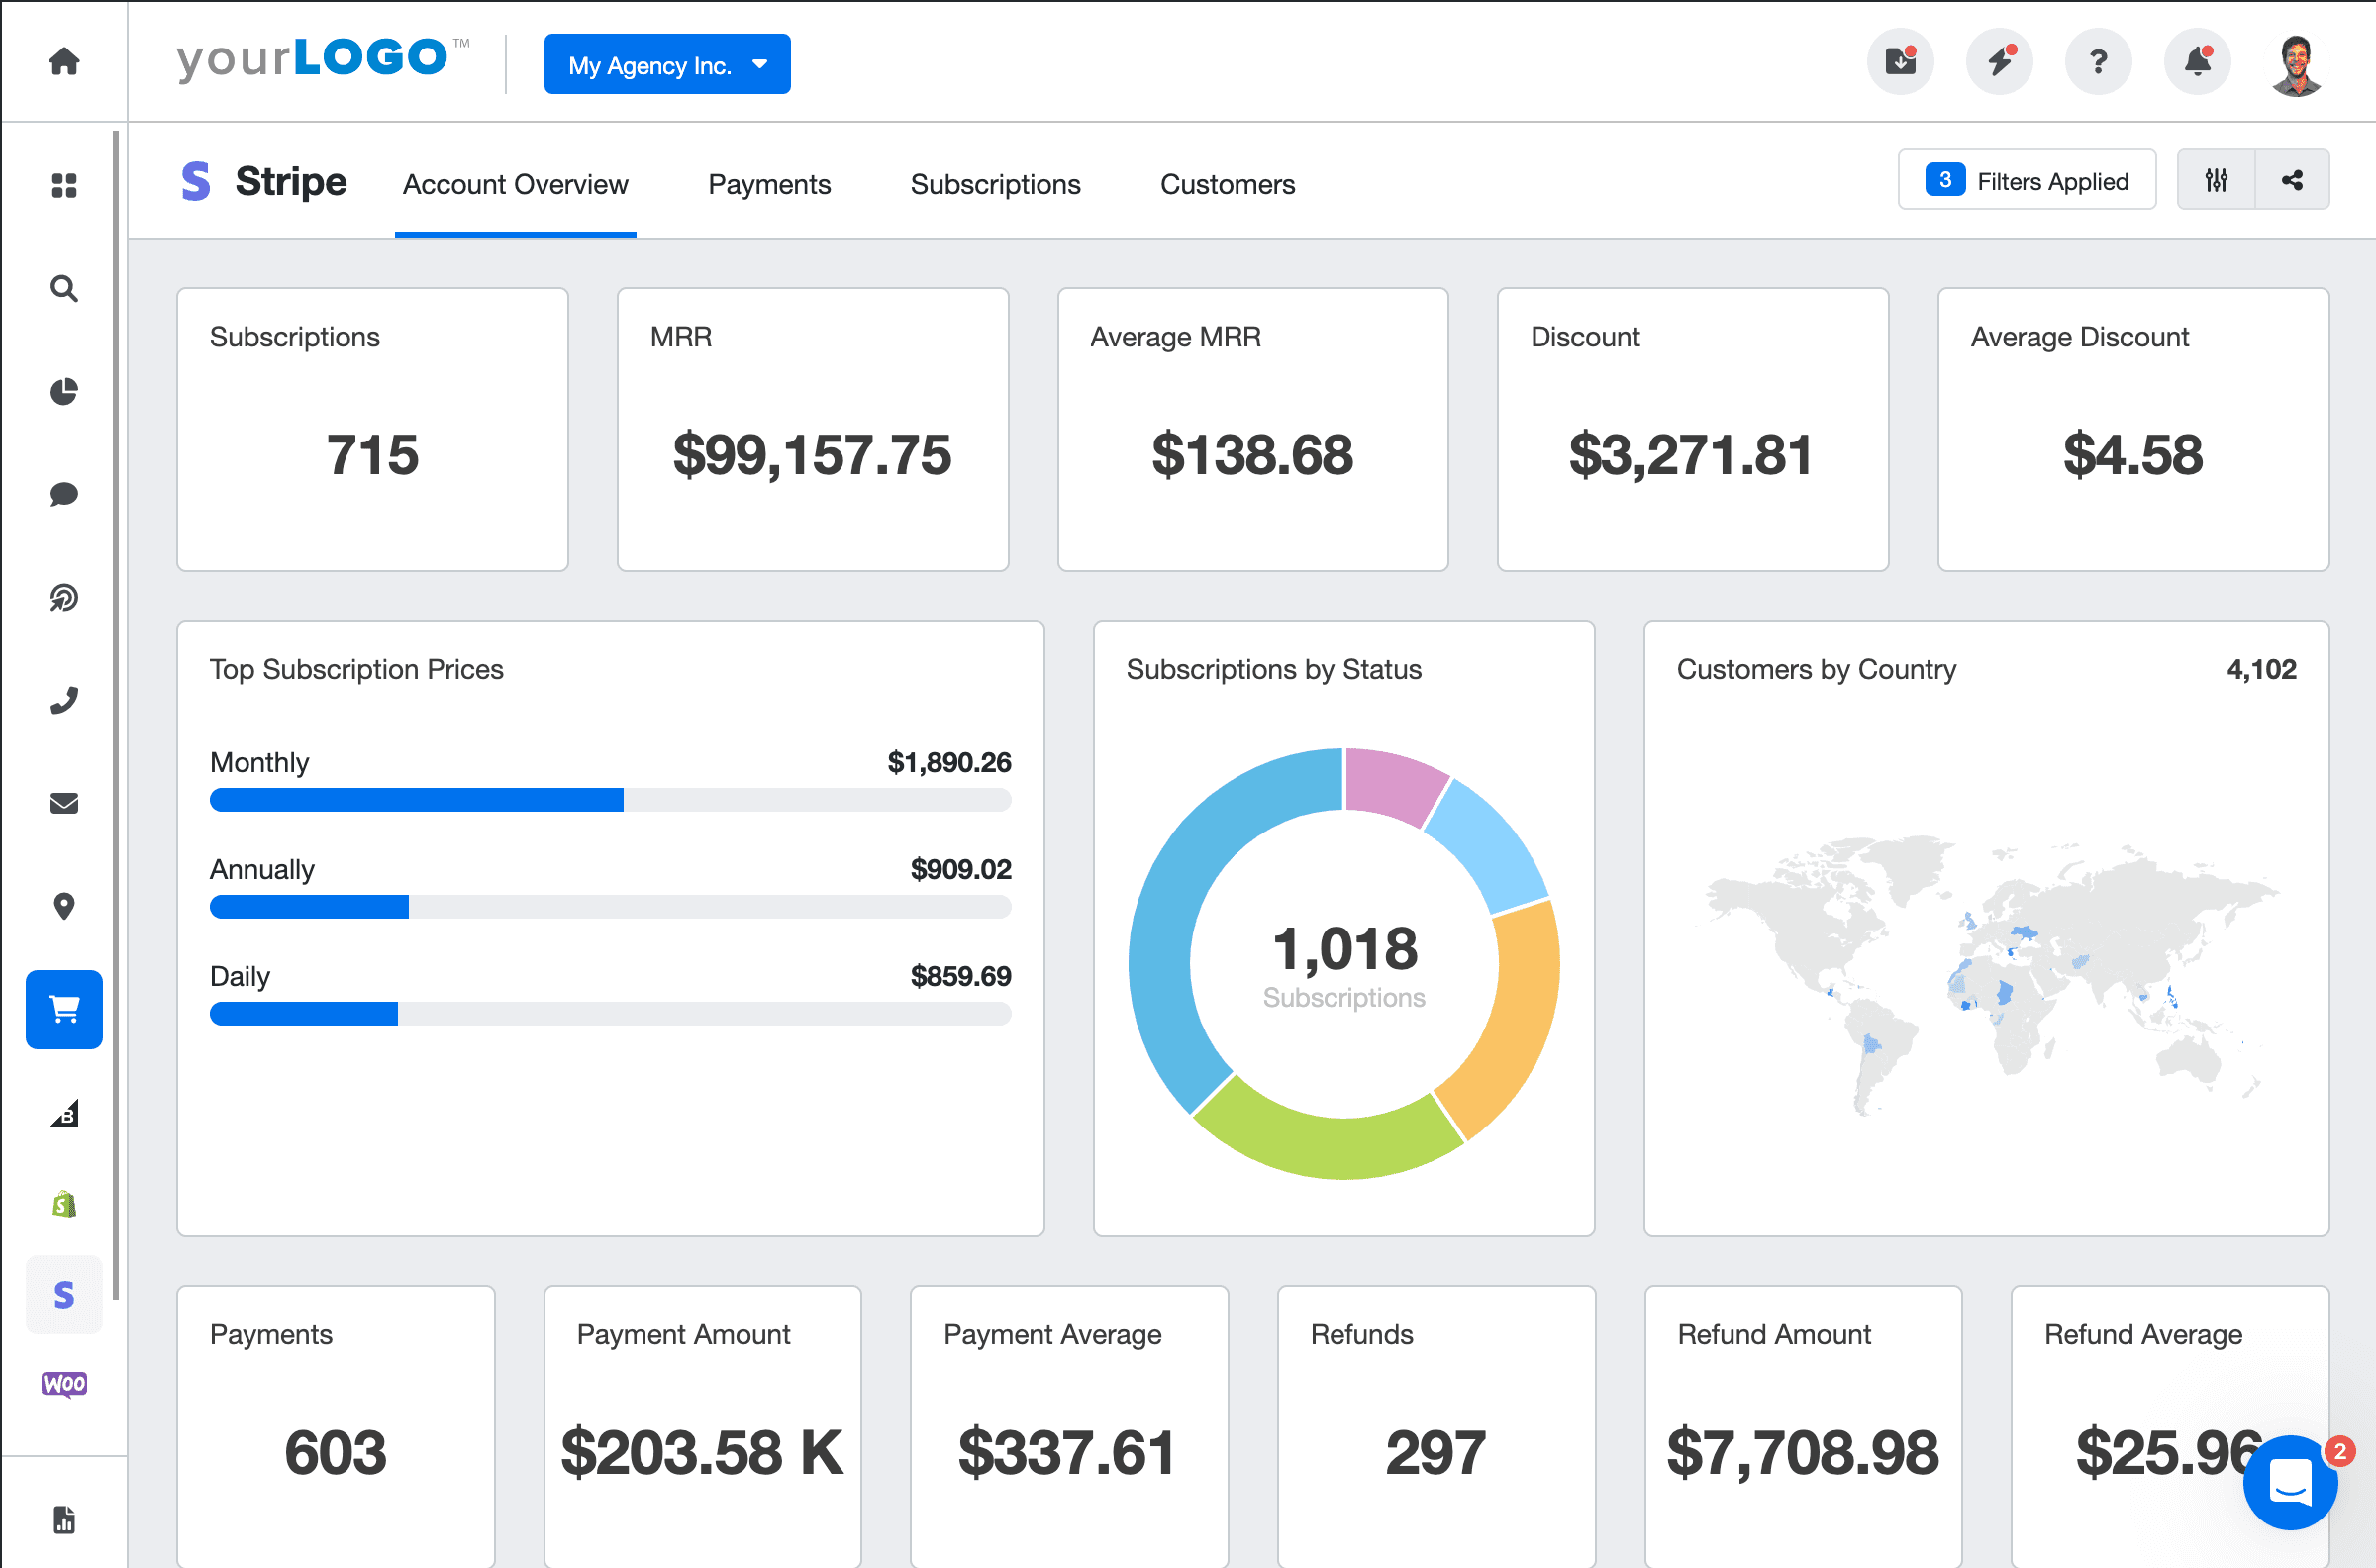
Stripe Dashboard Example
Related Integrations
Tips for Increasing Net Revenue Retention
Improving Net Revenue Retention is critical for the long-term success of any business, especially those in sectors where customer relationships directly impact revenue. Here are three strategies that effectively enhance NRR:
Deepen Customer Engagement
Understand customer needs, provide personalized experiences, and maintain regular communication. Enhanced engagement often leads to higher customer satisfaction, positively influencing NRR by reducing churn and encouraging upsells.
Refine Pricing Strategies
Regularly review and refine pricing strategies. This includes considering value-based pricing models that align with customer perceptions of value, increasing both customer retention and the opportunity for revenue expansion.
Optimize Customer Success Programs
Optimize customer success programs by addressing customer issues promptly, and proactively offering solutions and recommendations that enhance user experience and encourage additional purchases or upgrades.
Related Blog Posts
See how 7,000+ marketing agencies help clients win
Free 14-day trial. No credit card required.


