Table of Contents
QUICK SUMMARY:
Tracking the right business metrics is essential for marketing agencies to showcase their strategic value and drive client success. By monitoring key metrics such as click-through rate and average order value, your agency provides data-driven insights that guide clients toward better decision-making. In this article, we'll cover the most impactful business metrics to track, ensuring your agency’s efforts align with client goals and prove your position as a trusted, results-oriented partner.
On any given day, your team is busy crafting catchy ads, writing engaging social media posts, and strategizing enticing email marketing campaigns. Amid the whirlwind of tight deadlines, setting up a robust system for tracking key business metrics such as customer acquisition cost or net profit margin might get overlooked.
Without knowing what business metrics to track or how to save time on tracking them, you may find yourself scrambling to piece together fragmented data to quantify the impact of your team’s hard work. The last thing you want is your clients questioning whether your marketing strategies are genuinely effective … or merely a series of fortunate creative experiments!
In this post, we’ll share a list of revealing business metrics your team should start tracking to guide your clients in making the best decisions for their business while helping your agency solidify its reputation as a valuable strategic partner. We'll also share a five-step process for effectively reporting these numbers to your clients.
What Are Business Metrics?
Business metrics are quantifiable measures used to assess a marketing project's performance, progress, or quality. In other words, they’re numbers that give you a clear picture of what’s working (or what sadly isn’t). Let’s look at why tracking business metrics matters in the context of an agency/client relationship.
Why They Matter to Your Agency
According to the AgencyAnalytics Marketing Agency Benchmarks Survey, the number one client retention strategy for agencies is transparency and effective communication.
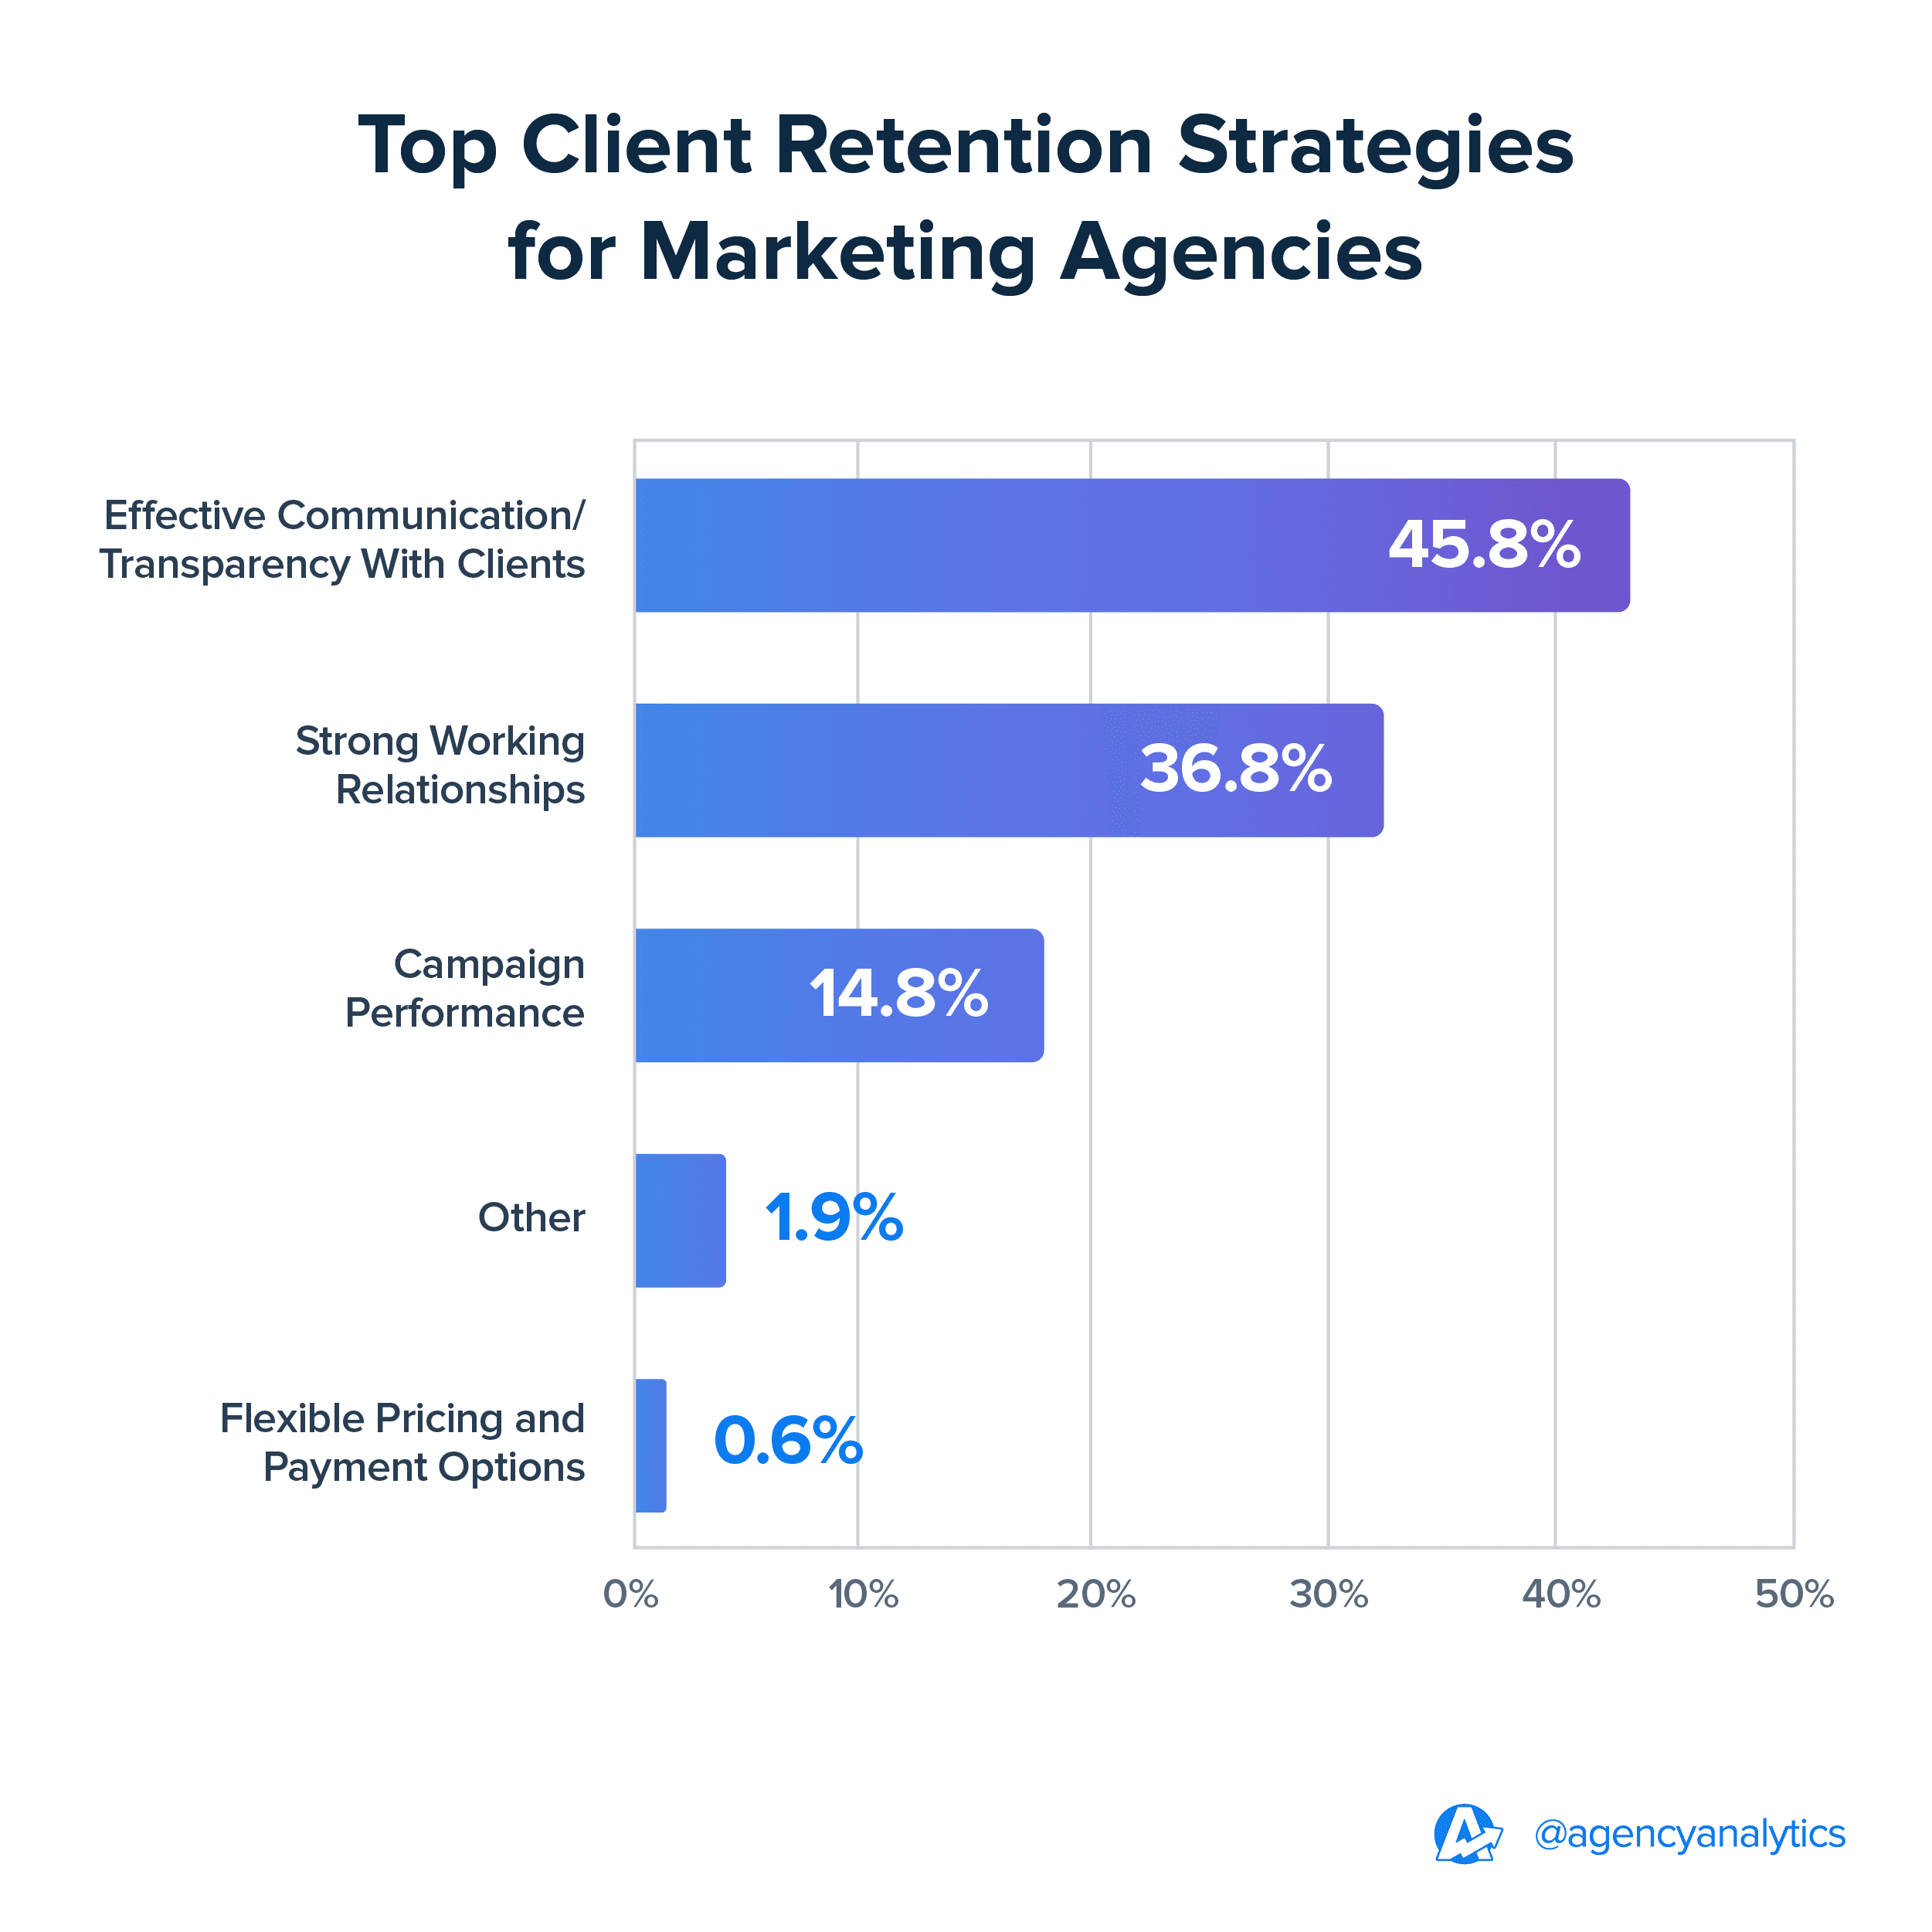
Tracking important business metrics makes good business sense. It’s a way for your agency to highlight the results of its collaboration and influence. Tracking key metrics:
Enhances Customer Satisfaction: Trust is the foundation of strong client relationships. Regularly presenting precise and accurate data ensures complete transparency, accountability, and trust, translating into client loyalty.
Presents Opportunities for Improvement: Reviewing metrics helps your agency identify inefficiencies and adjust tactics in real-time, showcasing your team's adaptability.
Increases Competitive Advantage: Tracking key marketing and sales metrics on behalf of your clients shows them that their success is your biggest priority. This will set your agency apart from competitors who rely solely on creative intuition.
Strengthens Your Agency’s Portfolio: Business metrics are handy numbers to have on hand! They add credibility to marketing materials like your case studies to help you appeal to more high-profile clients.
Why They Matter to Your Clients
On the client side, tracking business metrics:
Clarifies Business Performance: Clients have a clear understanding of how their business is performing within their niche.
Ensures Goal Alignment: Tracking the right metrics confirms your agency’s activities align with the client's goals, reassuring them that your efforts are focused and that no resources are wasted.
Enhances Accountability and Transparency: Metrics demonstrate the tangible results and return on the client’s marketing investment.
Guides Informed Decision-Making: Having data on hand means clients can say goodbye to guesswork and make informed decisions on next steps.
What’s the Difference Between Key Performance Indicators and Business Metrics?
Are KPIs the same as metrics? Not quite. A metric can be anything that measures some aspect of a client’s business, whereas a Key Performance Indicator (KPI) directly relates to the primary goals of a project.
KPIs like Marketing Qualified Leads (MQLs) or Sales Qualified Leads (SQLs) from an eBlast project gauge the campaign's effectiveness. These metrics provide more focused insights compared to broader business metrics.
Business metrics like Customer Lifetime Value, on the other hand, provide a comprehensive view of the financial health of the business and how operations are performing.

Tracking both key performance indicators and business metrics helps your agency maintain a view of the big picture while also ensuring that project objectives are met. Tracking the two ensures that you’re not just tracking vanity metrics that look like they indicate campaign performance, but that don't truly align with client business goals.
We reverse engineer everything based on business growth. If it isn't growing the business, we cease to be relevant in the market.
For paid strategies (specifically ecommerce) we track sales and ROAS, and for a lead generation campaign, we track everything from conversion, conversion rate, cost per conversion, and revenue. But we don't stop there. We monitor things like a lead/sale ratio, suggesting software, processes, and approaches that could improve the overall ROI, allowing a business to understand their Cost Per Customer Acquisition better.
Bodie Czeladka, Creative & Managing Director, Dilate Digital
5 Types of Business Metrics to Track for Your Agency Clients
Let's explore a few different types of business metrics to start tracking in your agency and what insights are derived from gathering these numbers.
1. Sales & Revenue Metrics
Sales and revenue metrics are financial metrics that assess the efficiency of sales teams, sales processes, or sales strategies.
Sales Revenue by Product or Service
Evaluating sales revenue by product or service helps the client understand which of their offerings are contributing the most to their overall revenue, in other words, which products or services are most in-demand for paying customers and which might be wasting resources.
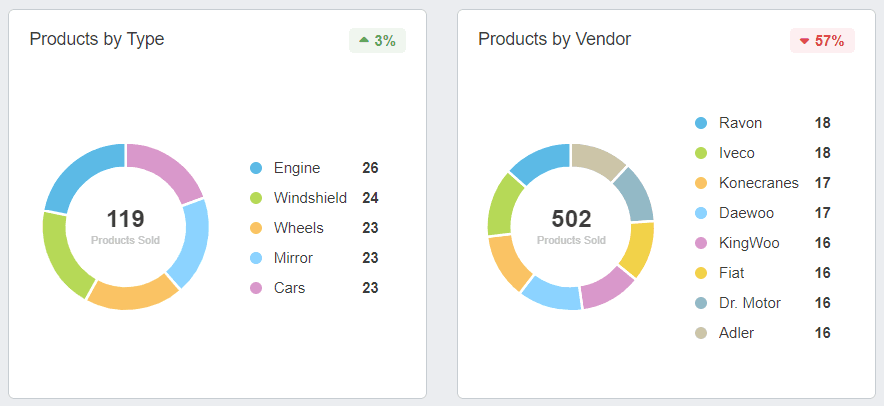
Tracking this metric empowers your agency to suggest tactics like:
Focusing marketing efforts on top-selling products.
Optimizing pricing strategies.
Bundling high-demand items with slower-moving ones.
Discontinuing or repositioning underperforming products.
All of these resulting suggestions help your agency demonstrate your expertise as a partner.
Monthly Recurring Revenue (MRR)
Monthly Recurring Revenue is a financial metric that shows how much steady income a business receives from subscriptions or ongoing services. A stable or growing MRR demonstrates customer satisfaction, while a decline signals the need for adjustments to strategy or offerings. Highlighting an increase in MRR in your client reports directly validates your agency's ROI.
Customer Retention Rate (CRR)
Customer Retention Rate measures the percentage of customers a business retains over a given period. It's a critical indicator of customer satisfaction and the effectiveness of ongoing engagement strategies. Tracking CRR helps clients understand how well they are maintaining their customer base and provides insights into loyalty trends. A higher retention rate often correlates with stronger brand loyalty, reduced marketing costs (since retaining customers is typically more cost-effective than acquiring new ones), and increased long-term revenue.
Demonstrating improvements in CRR positions your agency as a proactive partner, directly contributing to your client’s sustained growth and long-term success.
Net Revenue Retention (NRR)
Net Revenue Retention (NRR) tracks the revenue retained from existing customers over a given period, accounting for upsells, cross-sells, downgrades, and churn. It’s a key indicator of a company's long-term financial stability. A strong NRR suggests effective customer satisfaction and loyalty strategies, which are pivotal for sustainable growth. Highlighting NRR in your reports showcases long-term client value.
Customer Lifetime Value (CLV)
Customer Lifetime Value (CLV) is the total sales revenue a business receives from a customer throughout their entire relationship with the company. Reporting customer lifetime value to your clients helps them make marketing decisions on what products and services to develop or where to allocate marketing budgets to yield optimal results.
Impress clients and save hours with custom, automated reporting.
Join 7,000+ agencies that create reports in minutes instead of hours using AgencyAnalytics. Get started for free. No credit card required.
Cost Per Acquisition (CPA)
Cost Per Acquisition (CPA) is a key marketing metric that measures the average spend on advertising to generate a specific action, which could be anything from a purchase to a lead or any other desired conversion. This number tells you if your client’s marketing budgets are well spent. A lower CPA means the budget is being used wisely, whereas a high CPA means resources might be going to waste. Tracking CPA helps evaluate the most cost-effective channels, optimize budget allocation, and prove campaign ROI.
Client/Customer Acquisition Cost (CAC)
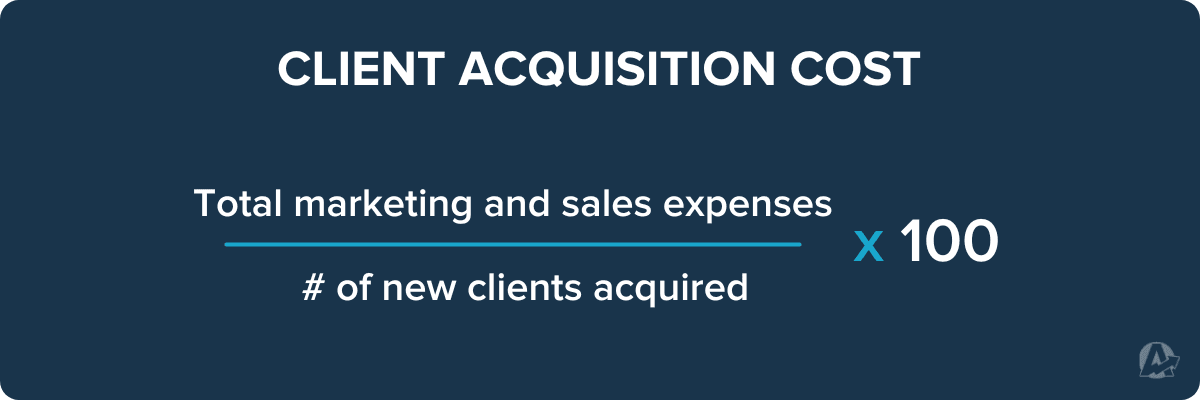
Client/Customer Acquisition Cost is the total cost your client spends to land a new customer. This metric focuses more on the customer as a whole rather than on the specific actions taken by those customers. It is a vital business metric to track for clients who are focused on efficient growth. A lower customer acquisition cost means that your client is acquiring customers cost-effectively whereas a high CAC should alarm your team that your proposed marketing strategy needs a revisit.
Net Promoter Score (NPS)
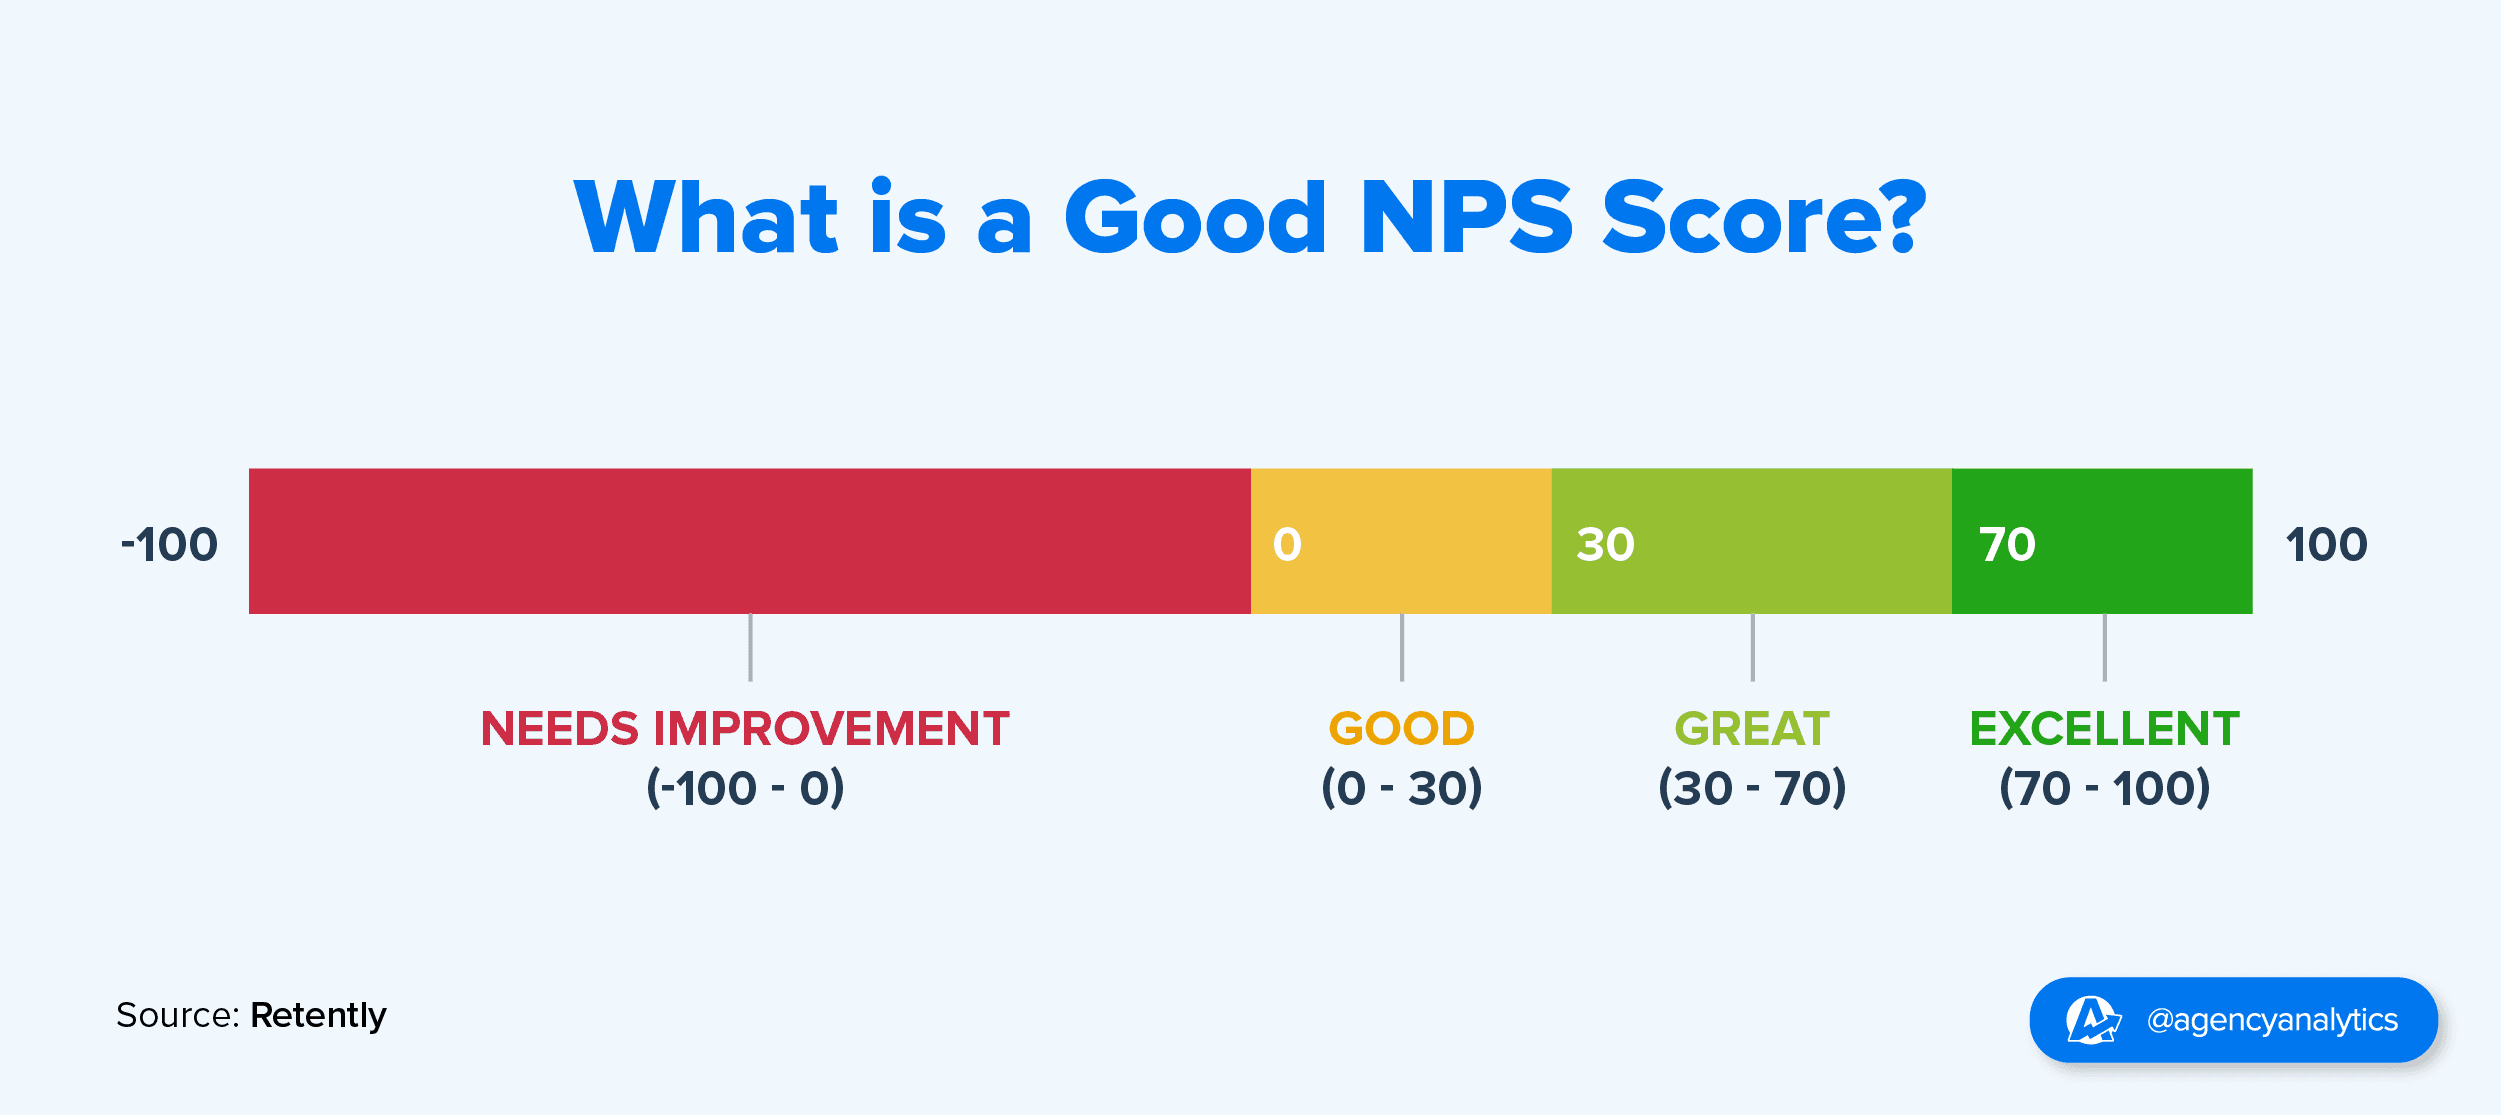
NPS measures how likely customers are to recommend your client’s products or services. This is a strong measure of a brand’s reputation and customer satisfaction. A high NPS demonstrates that your agency’s marketing efforts are creating positive customer experiences and boosting client retention.
Related: Key Marketing Metrics Your Agency Should Be Tracking
How To Easily Track Sales Metrics
Monitor sales metrics like MRR, CPA, net profit, and more in one centralized dashboard with AgencyAnalytics rather than manually pulling them from sales report spreadsheets and CRMs. Enforce security protocols with Multi-Factor Authentication and Single Sign-On to keep your clients’ sales data secure.
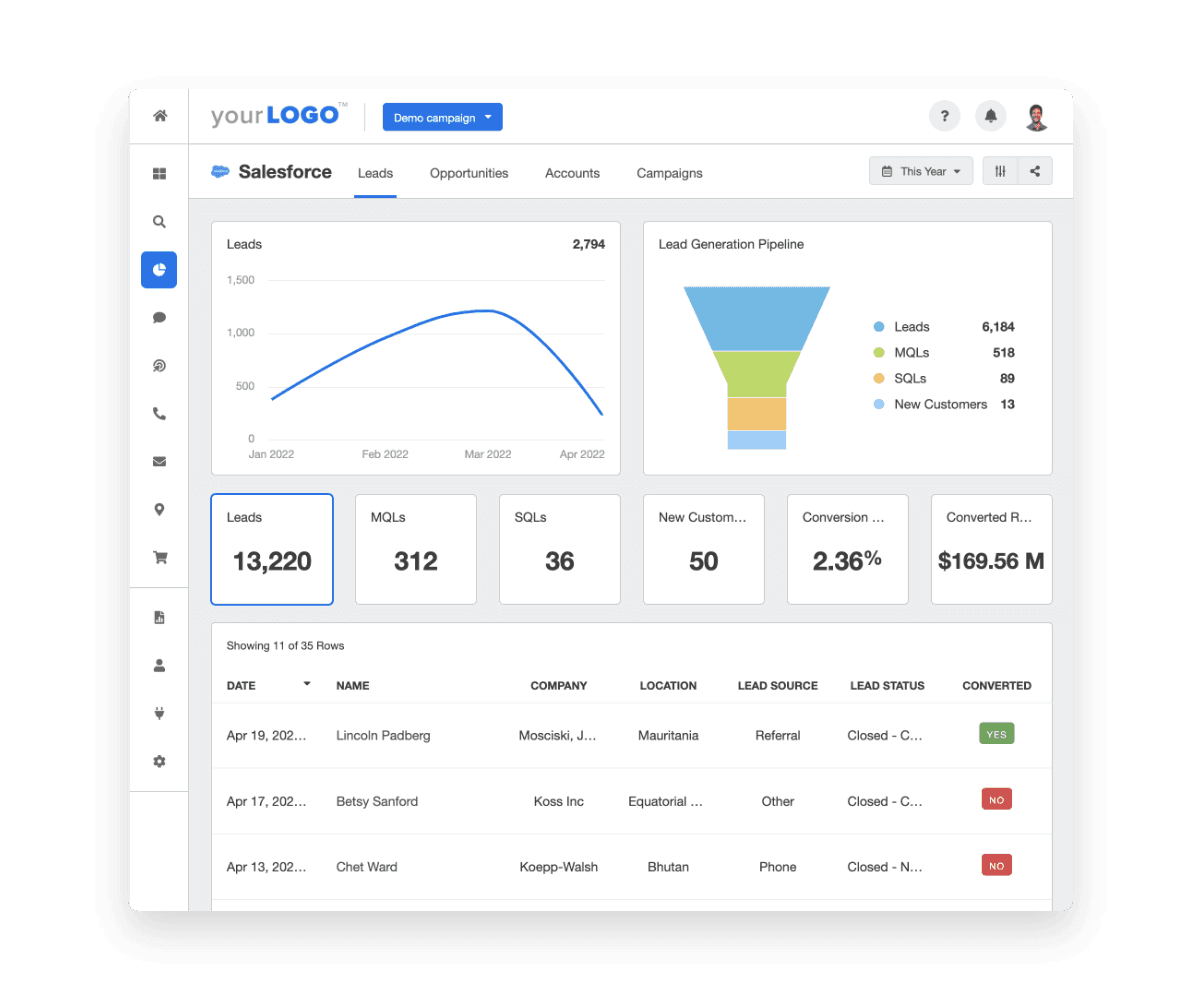
Use the Hubspot or Salesforce integrations from AgencyAnalytics to pull the most relevant metrics for your clients into digestible reports. Try it free for 14 days.
2. SEO Business Metrics
SEO metrics help you assess the effectiveness of your SEO strategies.
Click-Through Rate (CTR)
CTR measures the percentage of users who click on your client’s website's listing in search engine results. It shows how effective page titles and meta descriptions are at attracting clicks. Tracking CTR is also a useful way to assess the effectiveness of ad creatives, demonstrating whether your creative team’s visuals, messaging, or calls-to-action are resonating with the audience.

Conversions
Conversions refer to user actions on a website that align with business goals. These actions vary based on your client’s objectives but typically include completing a purchase, signing up for a newsletter, filling out a contact form, or downloading a resource. By analyzing conversion data, you’ll refine client campaigns and strategies to optimize the user, ultimately improving your client’s overall business performance.
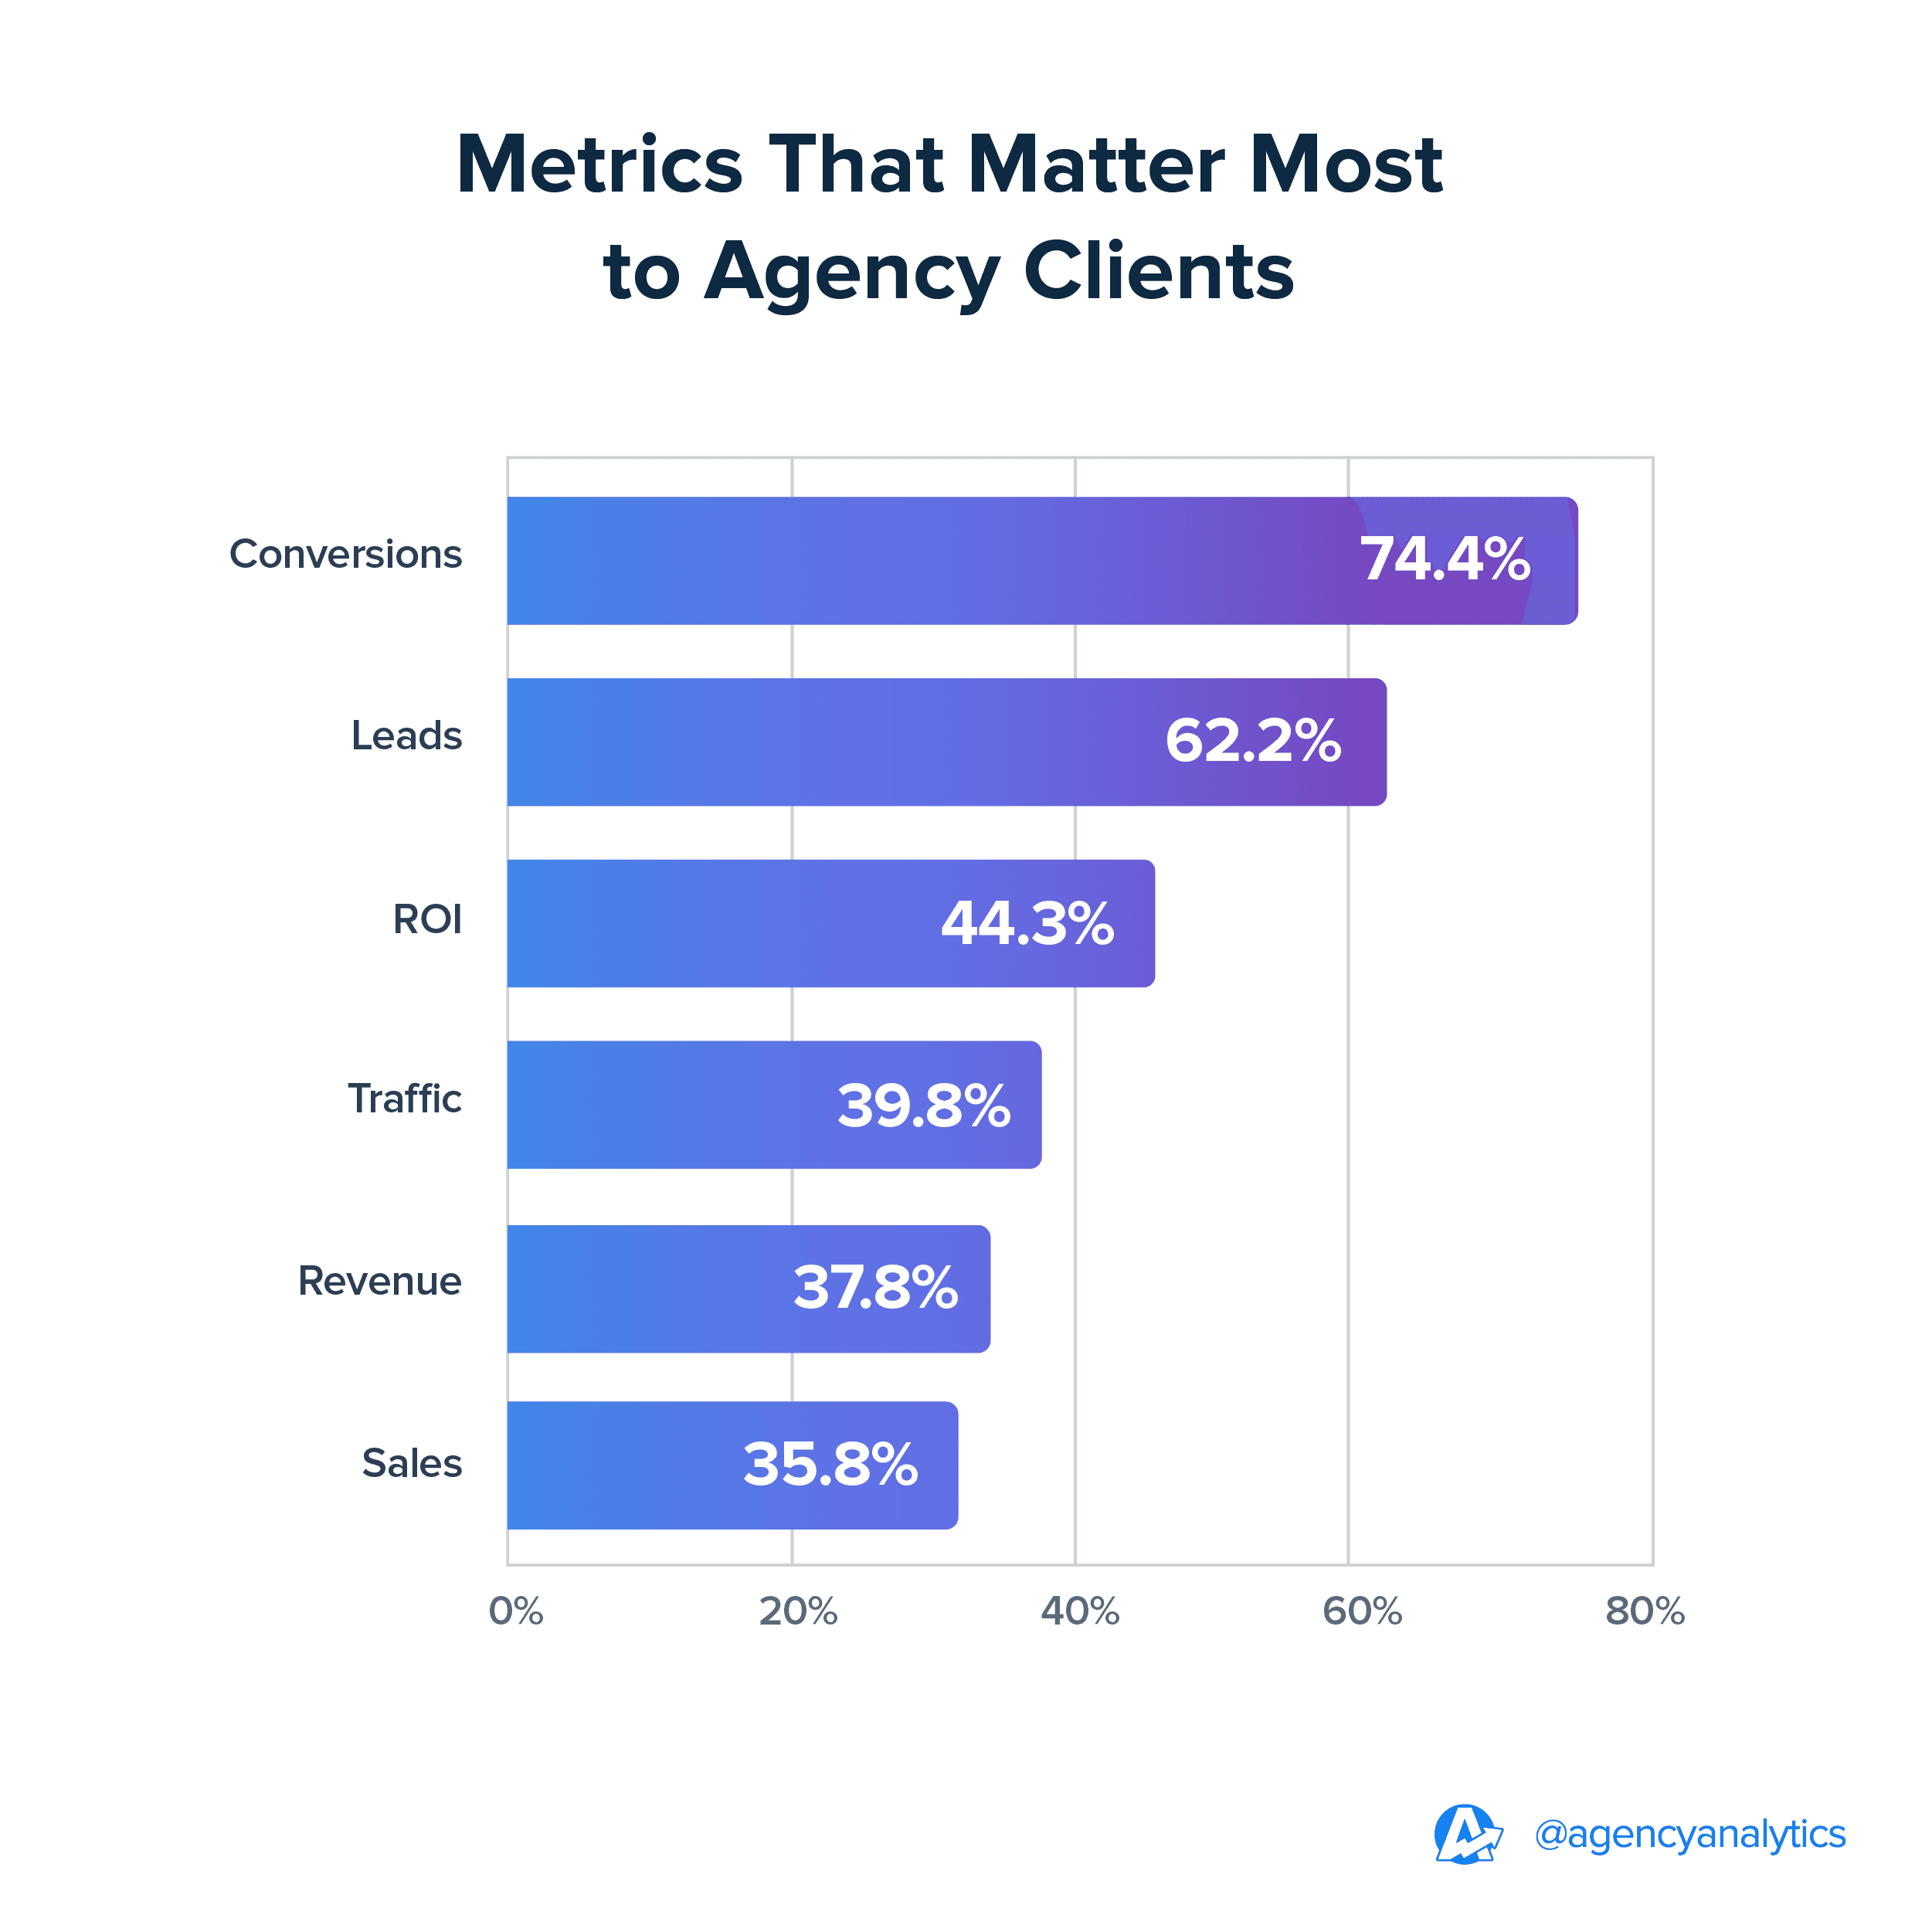
According to the AgencyAnalytics Benchmarks Survey, conversion metrics are the metrics that matter most to clients. This makes it all the more imperative to effectively showcase any progress your agency achieves in increasing your clients’ conversion rates.
Domain Authority (DA)
Domain Authority estimates how likely a website is to rank in search engines. It scores domains from 1 to 100, with higher scores indicating better ranking potential. Tracking DA is useful for shaping your agency’s SEO strategies, such as link-building and content optimization. Featuring increases in DA in your client reports emphasizes the value generated by your agency’s SEO campaigns.
Organic Traffic
Organic traffic refers to visitors who visit your client’s site through unpaid search engine results. High organic traffic indicates content quality and relevance, reflecting how well a site meets user needs and search intent. Tracking this metric helps you demonstrate the effectiveness of your agency’s SEO strategies and the ROI of investing in these projects.
Keyword Ranking
Keyword ranking shows the position of a specific keyword or phrase in search engine results. It is key to understanding how well your client’s website ranks for targeted terms. By improving keyword rankings, you’ll demonstrate your agency’s role in driving more organic traffic and increasing brand exposure.
How To Easily Track SEO Metrics
Monitor SEO metrics like CTR, conversions, and keyword rankings easily and in one central location with AgencyAnalytics. Enhance your reports with data visualization tools that present performance metrics to clients in a more clear and impactful way.
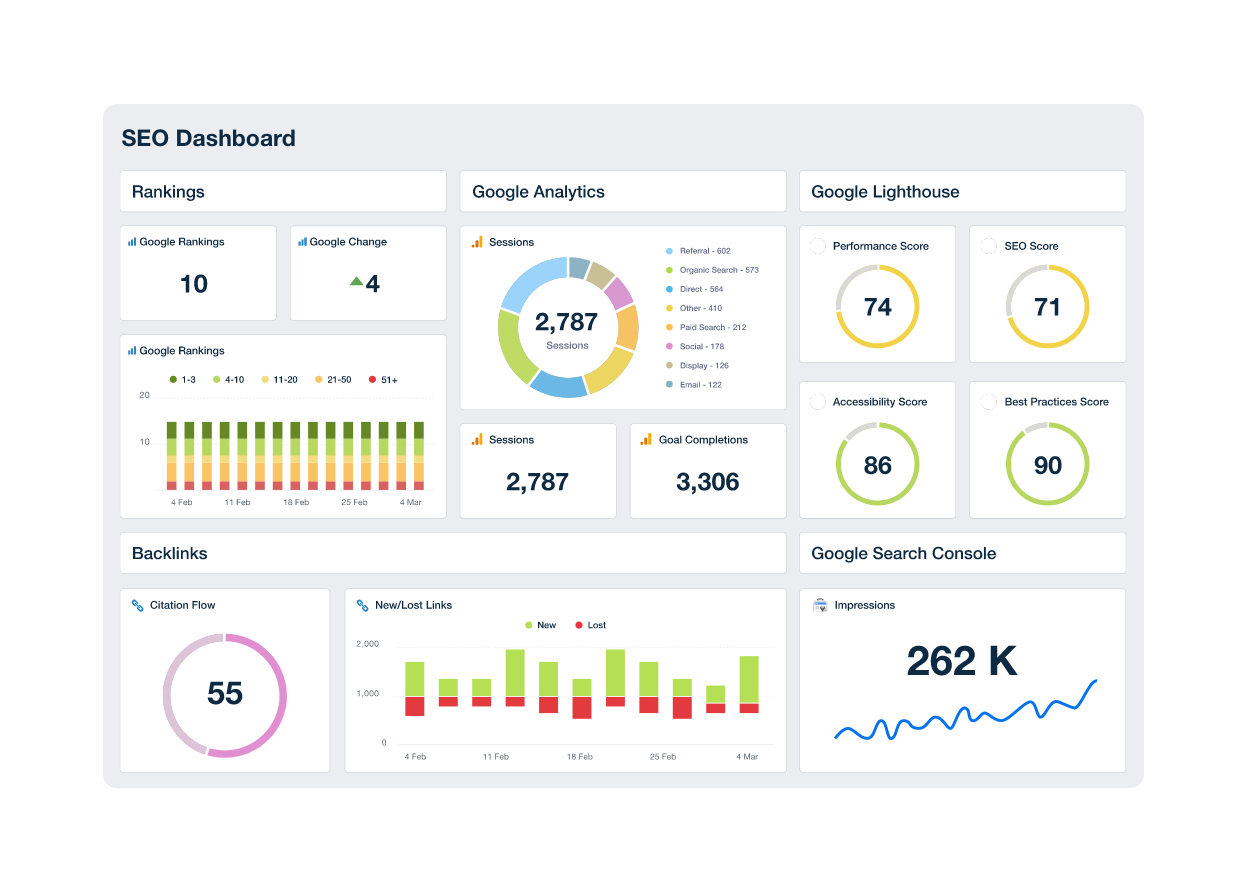
Create white label SEO reports that deliver polished, insightful SEO insights in just a few clicks. Try AgencyAnalytics free for 14 days.
3. Email Marketing Business Metrics
Email marketing metrics assess the overall health and effectiveness of your email marketing efforts while also giving you insight into customer engagement.
Unsubscribe Rate
Email unsubscribe rate is the percentage of recipients who opt out from your client’s email list after receiving a campaign. It’s an important metric that shows when an audience is losing interest, indicating when it’s time to adjust email content and strategies.
List Growth Rate
List growth rate is the rate at which your client’s email list grows over a specific period, measuring how quickly they’re gaining new subscribers. A growing list means successful outreach, effective lead generation, and engaging content. Hinting at future potential for conversions and sales revenue, it also helps ensure the long-term sustainability of email marketing efforts.
Email Open Rate
Email open rate is the percentage of recipients who open an email out of the total number of emails delivered. It indicates the effectiveness of your creative team’s subject lines and preheader text. High open rates are fantastic metrics to showcase as they aren’t just for show—they’re clear evidence that emails are standing out and making an impact.
Email Bounce Rate
Email bounce rate is the percentage of emails that cannot be delivered to the recipient’s inbox. It's a strong indicator of email list health, reflecting the quality of contact lists. Monitoring this metric lets your agency know if you need to spend resources cleaning up email lists to guarantee that your campaigns will reach the right audience.
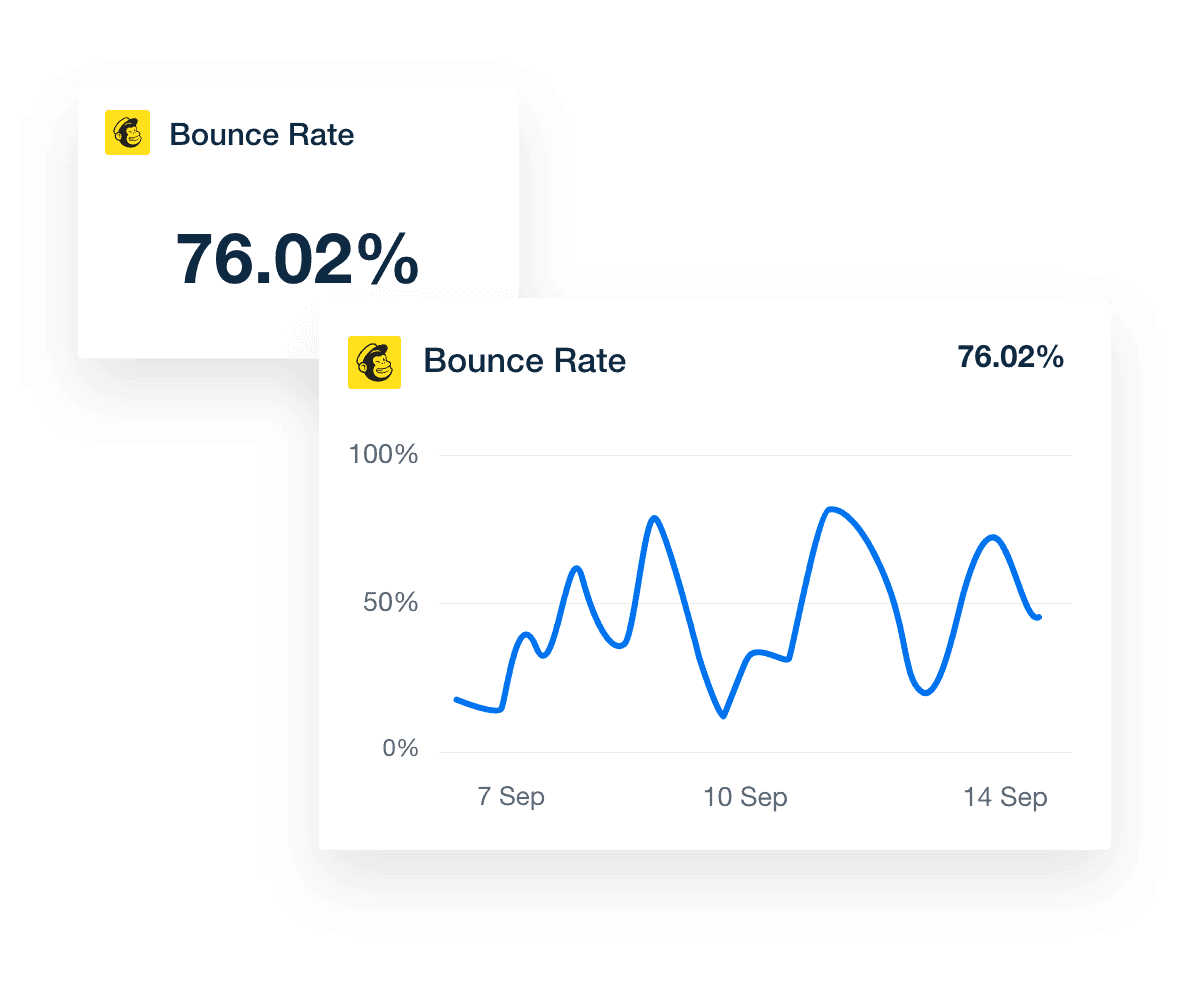
How To Easily Track Email Metrics
Monitor email metrics like unsubscribe rate, click-through rate, open rate, and bounce rate with AgencyAnalytics’ Mailchimp, Constant Contact, or Active Campaign integrations.
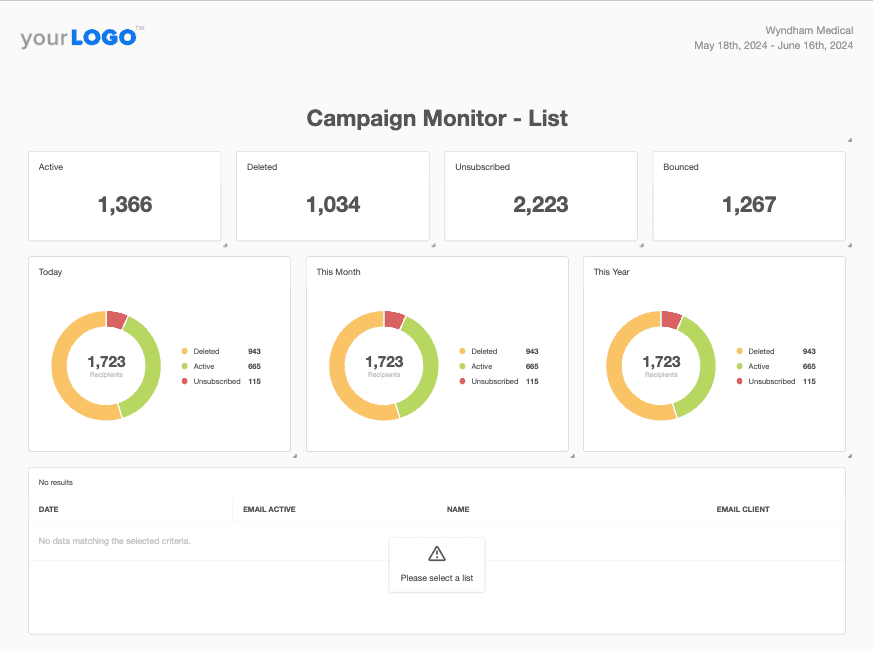
Create Automated Campaign Monitor reports for your clients and present robust email analytics in an engaging format. Try AgencyAnalytics free for 14 days.
4. Ecommerce Business Metrics
Ecommerce metrics offer a clear view of your client's online store performance, helping you understand user behavior, site effectiveness, and any barriers to sales revenue growth.
Total Sessions
Total sessions refer to the total number of visits to your client’s site within a specific period. Analyzing this measure pinpoints which campaigns or content are driving traffic, helps to spot potential issues if sessions decline, and assists in optimizing strategies to increase engagement. Tracking this metric also reveals patterns in user behavior.
New vs. Returning Visitors
This metric breaks down your clients’ visitors into two categories: those who visit their site for the first time and those who have visited the site before. A healthy mix of both indicates that the client is effectively attracting new customers while also retaining existing ones. Tracking the balance between the two provides valuable insights into a client’s growth as well as customer retention.
Average Order Value (AOV)
Average Order Value (AOV) is a business metric that indicates how much revenue your clients generate per transaction. A high average purchase value signifies that a client’s ecommerce store is driving quality sales without needing more traffic or higher conversion rates. This metric is extremely valuable in helping sales teams optimize their pricing strategies and upselling tactics (e.g. making price adjustments or promoting product bundles).

Cart Abandonment Rate
Cart abandonment rate is the percentage of users who add items to their shopping cart but don’t complete the purchase. A high cart abandonment rate indicates friction points in the shopping experience that lead to revenue losses and that must be addressed. Should it be high, your agency might then suggest tactics like improving the checkout UI, or sending out follow-up emails to incentivize purchases.
Refund and Return Rate
This is the percentage of orders that are returned or refunded by customers. By monitoring this metric, you’ll assist clients in identifying problems with the product, adjusting their product offerings, and improving the overall customer experience, ultimately leading to fewer lost sales.
How To Easily Track Ecommerce Metrics
Track ecommerce metrics like AOV, cart abandonment rate, and others from multiple ecommerce platforms into one centralized place with AgencyAnalytics.
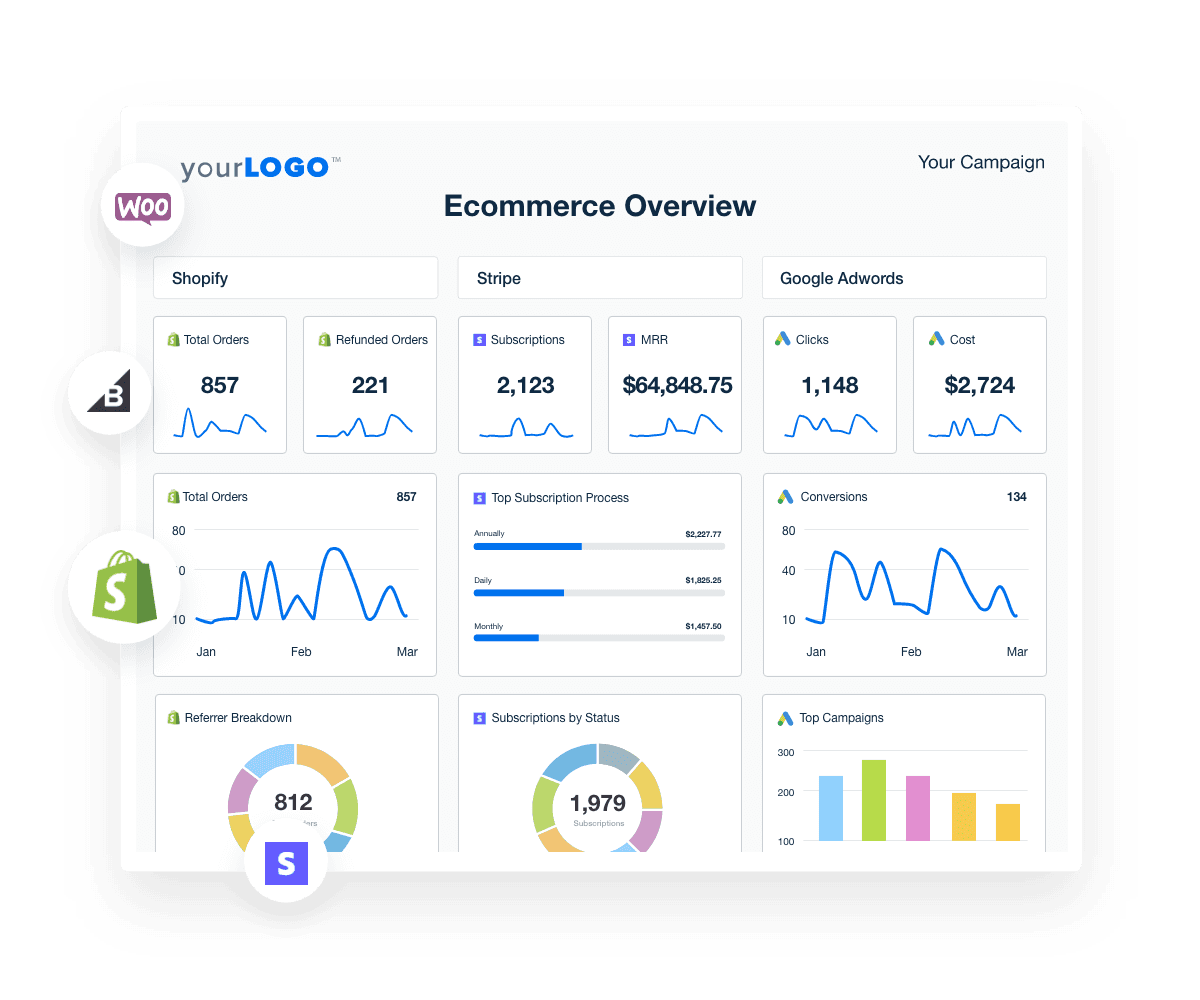
No more fishing for the metrics that matter–use AgencyAnalytics’ Shopify, Stripe, and Google Adwords integrations to consolidate ecommerce metrics into beautiful reports your clients easily understand. Try it free for 14 days.
5. Social Media Business Metrics
Social media business metrics tell you how well content is resonating with your clients’ audiences and how effectively your advertising campaigns are driving revenue.
Engagement Rate
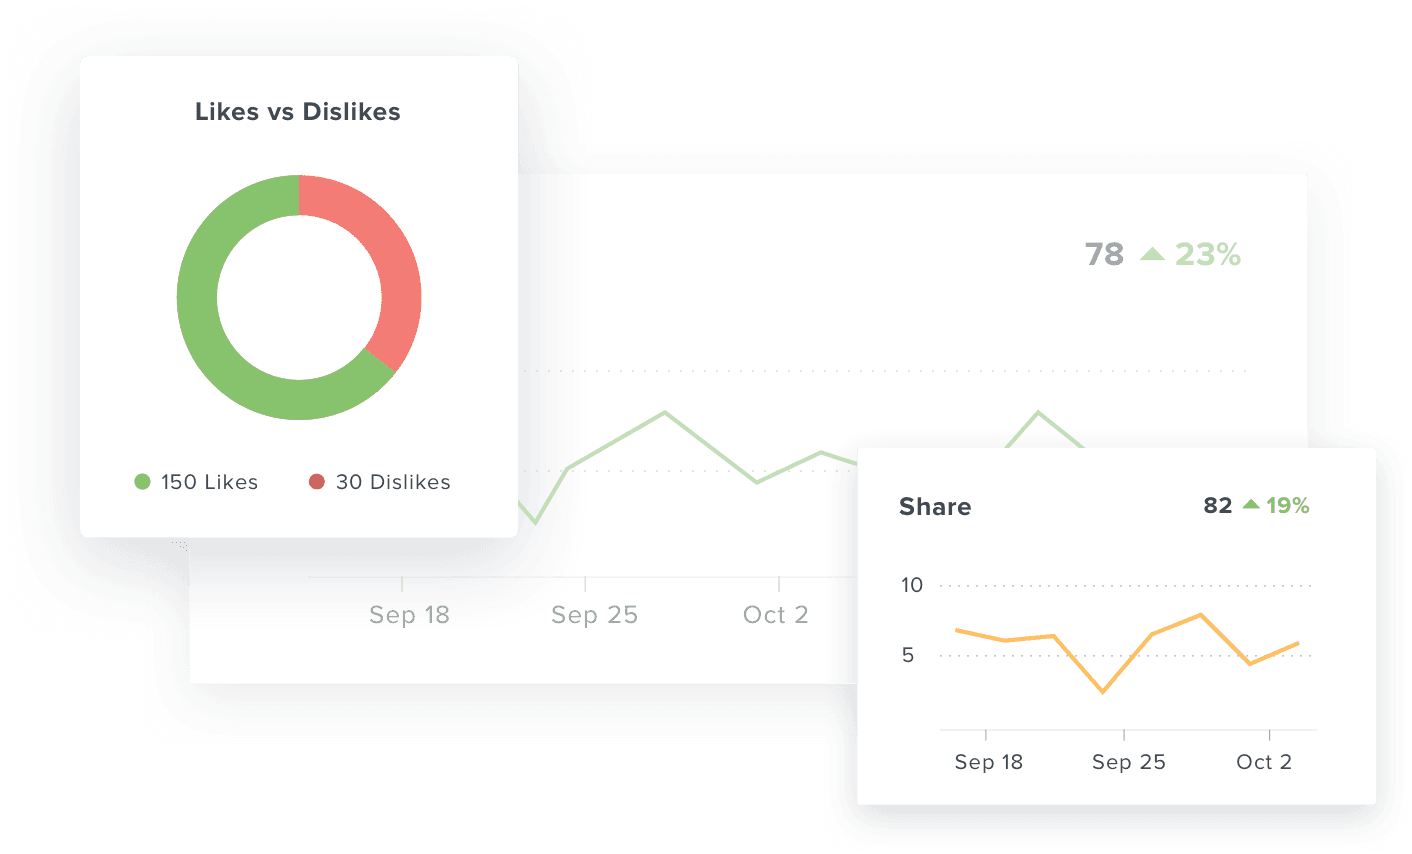
Engagement rate measures the level of interaction users have with your clients’ social media content. It includes actions such as likes, comments, shares, and clicks on posts. This measure demonstrates how connected the audience is to a brand. Tracking this metric helps your agency pinpoint what’s working in your campaigns and make quick changes to keep the client’s audience engaged.
Cost Per Reach
Cost Per Reach measures the cost of reaching each member of a target audience. A lower cost per reach shows that marketing strategies are working efficiently, while higher costs suggest there's room for improvement. This metric is important for budgeting because it helps ensure enough money is set aside to reach a wide audience and keep ads visible throughout your campaigns.
Follower Growth Rate
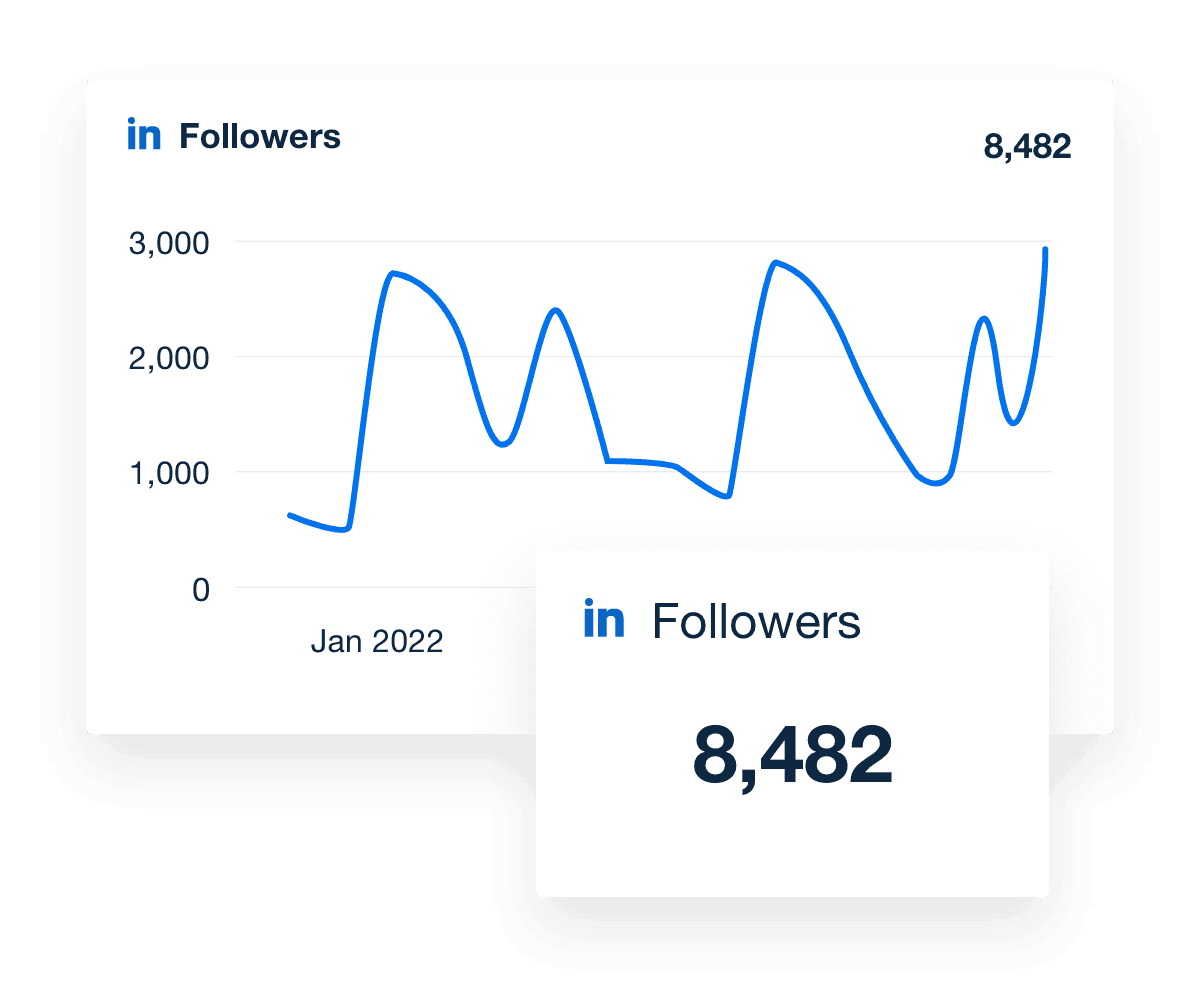
Follower growth rate is the rate at which a client’s followers increase over a specific period. A steady increase in followers shows that the content is engaging and appealing, while a slow growth rate may suggest the need for adjustments in content, timing, or targeting.
Return on Ad Spend (ROAS)
ROAS is a business metric that measures the revenue generated for every dollar spent on social media advertising. It indicates the effectiveness of your agency’s ad campaigns in generating revenue. It's important to track because it shows your agency if ad budgets are being used wisely. This metric gives your team a clear picture of how well the ads are working financially.
How To Easily Track Social Media Metrics
Track likes, comments, shares, clicks, and saves for each social media platform your client uses in one centralized location with AgencyAnalytics. Gain a bird’s eye view of client performance across multiple channels by pulling data from more than 80 marketing platform integrations.
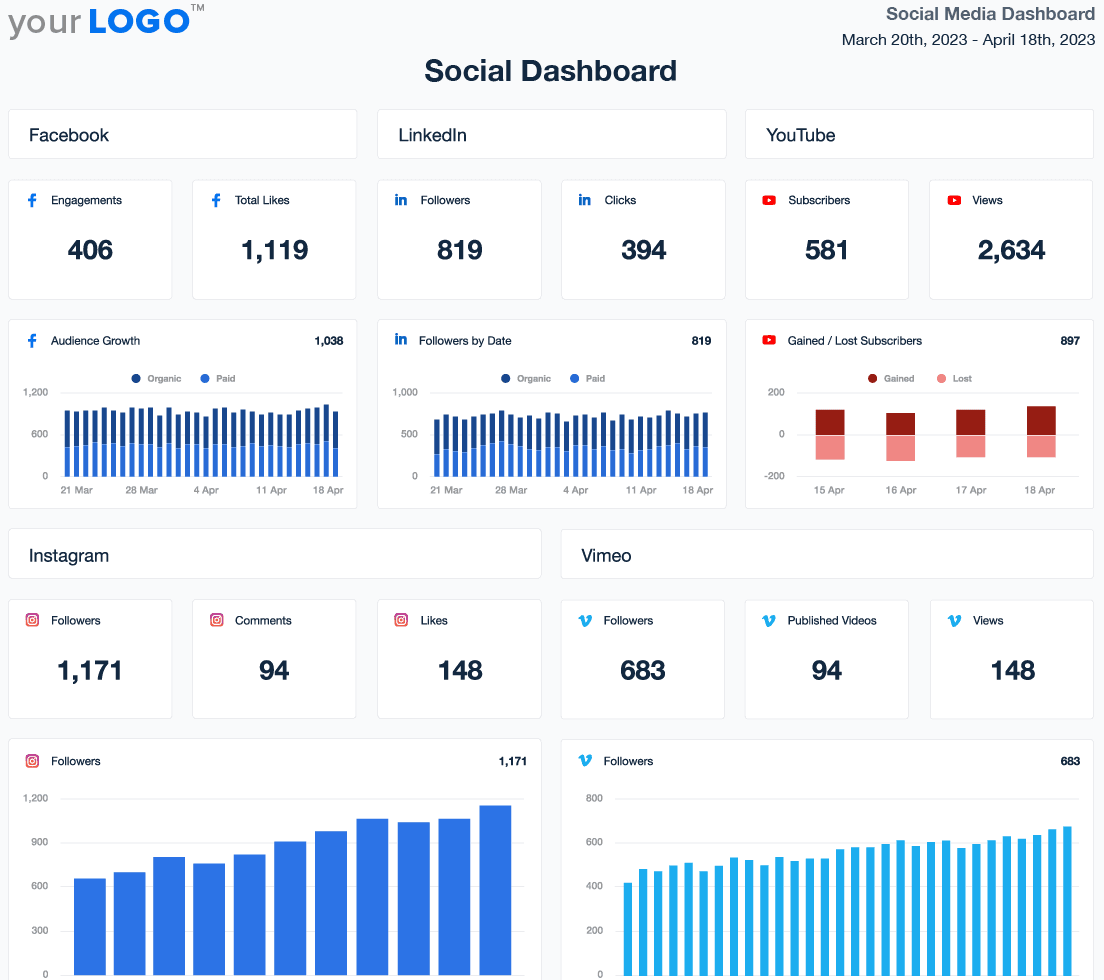
Create dedicated reports to showcase Instagram, Facebook, LinkedIn, or YouTube performance, or create your own social media dashboard to consolidate social media metrics from all platforms in just a few clicks. Try it free in AgencyAnalytics for 14 days.
The Best Way to Track Client Business Metrics
In this section, we'll walk you through a five-step process to ensure you're capturing the right data, reporting efficiently, and presenting insights that drive action and client satisfaction.
1. Define Shared Agency/Client Goals
Start by clearly defining goals that align with your client’s strategic objectives. Knowing the primary goals ensures that every business metric you monitor is relevant and directly contributes to the client’s business success.
When we begin working with a client we always make sure we understand what their goals are as a business first. This can sometimes be tough, especially if the goal is to "increase revenue" or "get new clients." It's important to get really clear and specific so that everyone is on the same page about what success looks like (no assumptions).
From there, we establish a set of lead and lag measures related to our efforts that directly support their business goals. For example, if they are trying to increase the number of clients they have and we're running a digital advertising campaign for them, we might track "request a consultation" form fills as our lag measure and website traffic as our lead measure. Both of these are driving us toward our goal (new customers) but tell us a different story about where we are on our way to achieving that goal.
Kerrie Luginbill, Chief Strategy Officer, Partner, OTM
2. Determine a Reporting Cadence
Establish a reporting timeline that balances frequency with usefulness (whether that means hosting reporting meetings weekly, monthly, or quarterly) so your clients receive timely updates with insights they can’t wait to dive into—without being overwhelmed. This ongoing dialogue helps maintain alignment with your client’s expectations and solidifies your collaborative approach to achieving their objectives.
3. Create Automated Metrics Reports
Rather than spending ages manually pulling business metrics from multiple data sources, turn to AgencyAnalytics as a one-stop reporting solution. Track and monitor all your chosen business metrics in one centralized platform with built-in integrations from over 80 marketing platforms—at no extra cost—you’ll easily collect, visualize, and analyze performance data, then present it in a way that clients digest with ease.
AgencyAnalytics is designed specifically for marketing agencies, offering an intuitive interface, advanced reporting, and automated scheduling. By automating data collection and reporting, you save significant time and gain back the freedom to focus on high-impact, strategic initiatives for your clients.
Related: How To Create a Metrics Dashboard for Clients
Using the AgencyAnalytics reporting platform has been a game-changer for our agency. It saves us time by automating manual reporting processes, allowing us to focus on strategy and delivering better results for our clients. Overall, the platform enhances our operational efficiency, elevates the quality of our reporting, and drives our agency's growth and reputation for excellence.
Joseph LeBlanc, Marketing Specialist, Studio Eighty-Eight
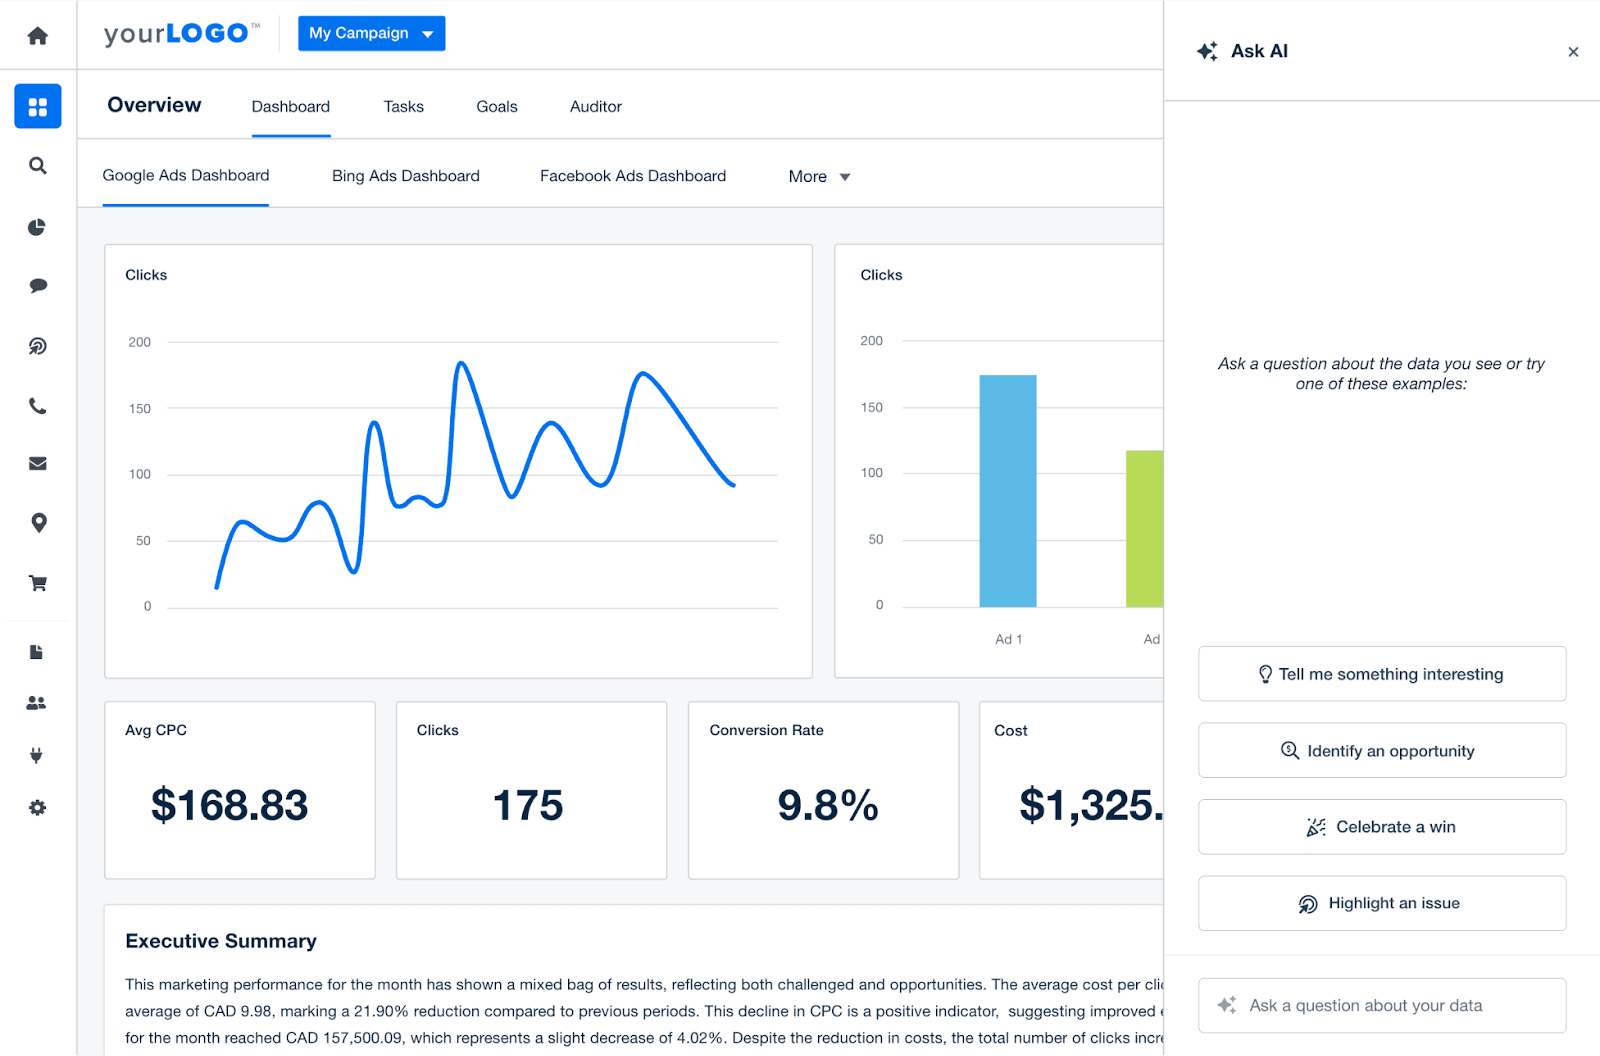
Use AgencyAnalytics’ AI features to automate complex data analysis, uncover hidden insights, and create personalized, actionable reports that impress clients and fuel growth. Try it free in AgencyAnalytics for 14 days.
4. Use Data Visualization in Your Reports
Presentation is everything. No client wants to get lost trying to decipher data in endless Excel spreadsheets! Instead, invest in tools that offer data visualization features like pie charts, progress bars, bar graphs, or geographic maps that transform complex data into digestible takeaways.
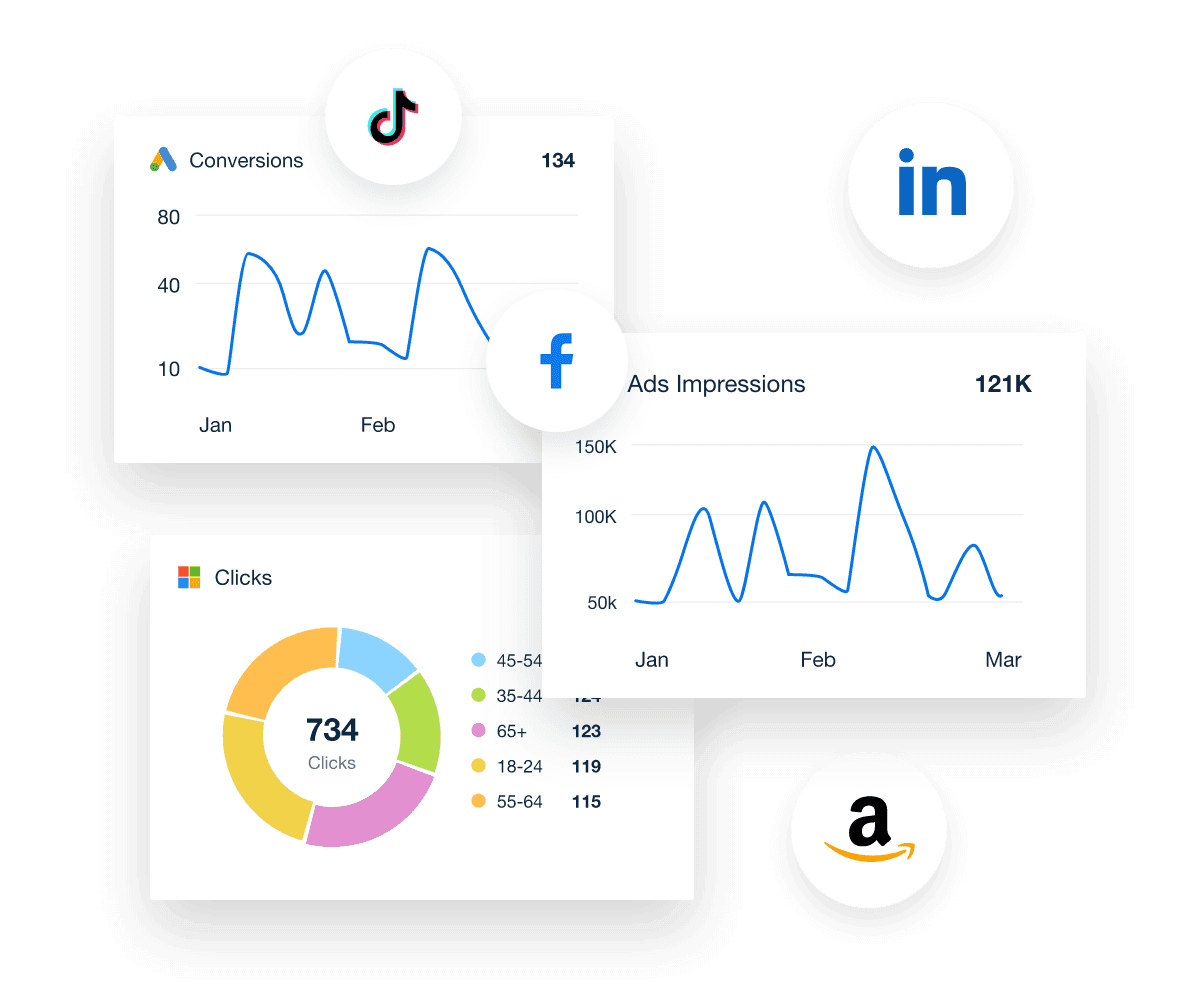
All AgencyAnalytics report templates include visualization tools to transform complex metrics into digestible insights clients love to see. Start your 14-day free trial to see what you can create.
5. Regularly Review and Adjust Your Key Metrics
Just like with any other agency process, you’ll want to check in with your clients regularly to gauge their satisfaction with the metrics you’re presenting. As priorities shift, projects come to a close, and new products are launched, they might have some ideas for new metrics they want to start tracking. Having regular check-ins helps you uncover any new needs and customize your business metrics to ensure you’re capturing the most relevant data as things change.
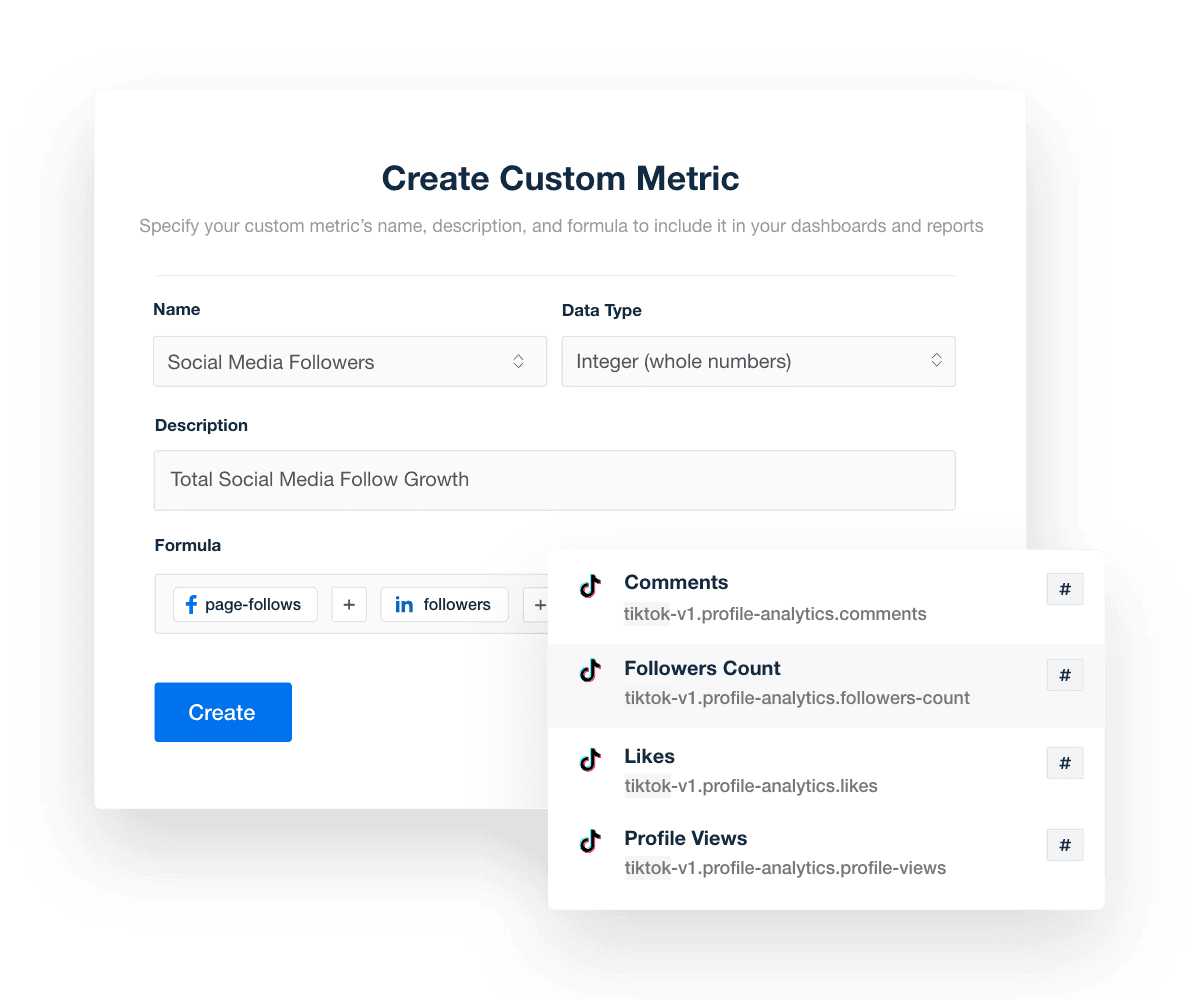
Combine data from multiple integrations into custom metrics to track the exact performance indicators you’re after. Start your 14-day free trial to test it out with AgencyAnalytics.
Final Thoughts on Tracking Business Metrics
Tracking business metrics is essential for understanding how your agency’s services are impacting the client’s bottom line and business operations. Including these data points in your reports guarantees you're providing valuable guidance to your clients on their next steps while simultaneously generating more demand for your services. It’s also helpful to follow up on these metrics by exploring industry benchmarks for business metrics to assess whether or not your client’s numbers are considered healthy for a business in that industry.
Rather than wasting time manually pulling these metrics from different data sources, using a dedicated reporting tool is a proven way to keep clients informed and spend more time strategizing on those exciting next steps.
Streamline your agency's client reporting system and confidently demonstrate your value. Start your free trial with AgencyAnalytics today.

Written by
Sylva is an expert content writer with over 10 years of experience in tech and SaaS, offering first-hand insight into agency needs from her background in advertising.
Read more posts by Sylva SivzattianSee how 7,000+ marketing agencies help clients win
Free 14-day trial. No credit card required.


