Cart Abandonment Rate
Retargeting
Segment audiences for focused retargeting ads to reduce cart abandonment.
Email Triggers
Activate personalized emails to incentivize completing the purchase.
Prove ROI
Highlight improved abandonment rates in client reports and validate capabilities.
A/B Testing
Determine which checkout flow or CTA variant reduces the Cart Abandonment Rate.
Why Shopping Cart Abandonment Rate Is Important
Cart Abandonment Rate is a critical metric that uncovers lost revenue opportunities for eCommerce stores. A high rate often indicates friction points within the shopping experience, such as a cumbersome checkout process or prohibitive shipping fees. Addressing these issues boosts revenue and improves the overall customer experience.
An improving rate serves as a positive indicator. It shows that recent optimizations in pricing strategies or website design are making customer transactions easier, thereby increasing conversions.

Stop Wasting Time on Manual Reports... Get Ecommerce Insights Faster With AgencyAnalytics
How Cart Abandonment Rate Relates To Other KPIs
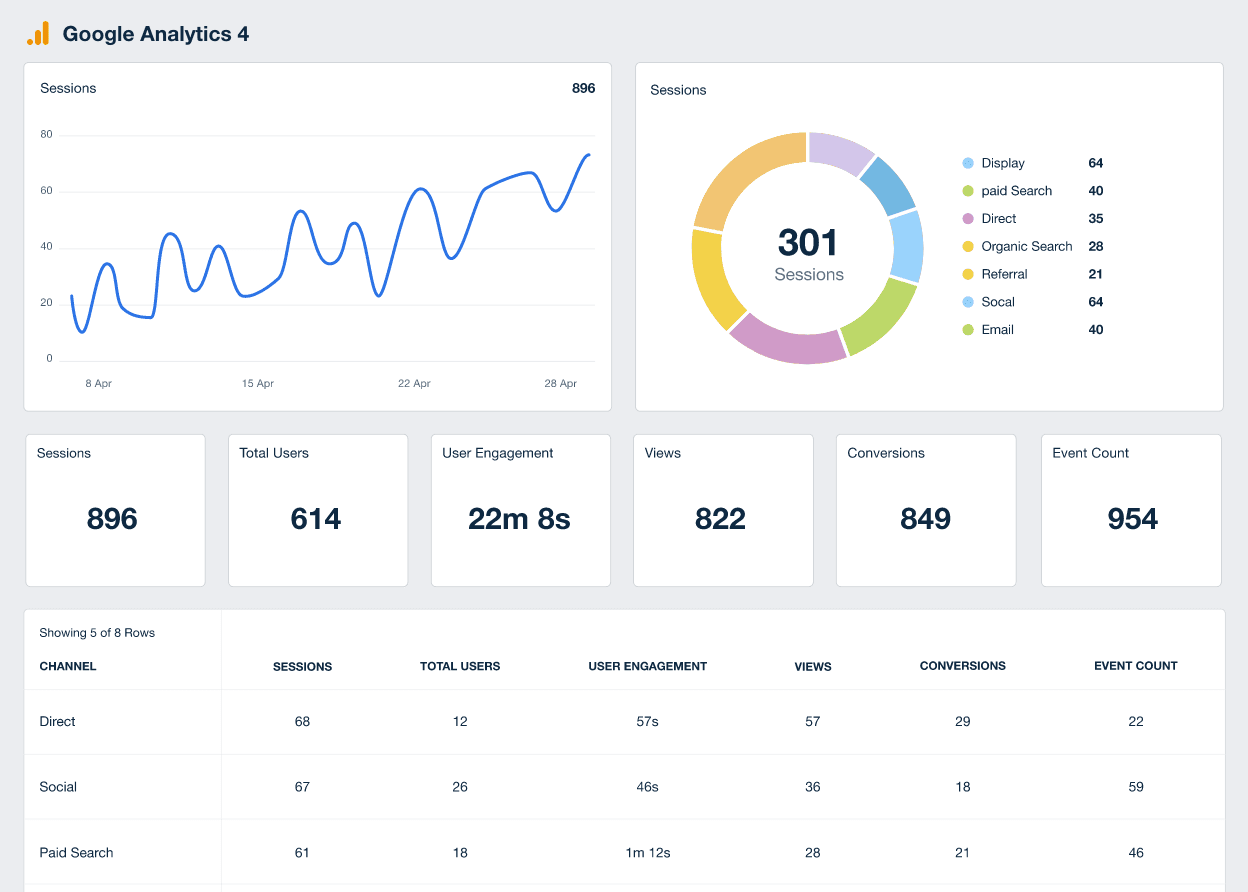
Cart Abandonment Rate gains added significance when analyzed alongside other key performance indicators. For example, in Google Analytics 4, to see data on those who have taken the first step in the checkout process, the Checkouts data point is where to look. If Checkouts are high, but Purchases are not keeping pace, the Cart Abandonment Rate is likely to blame as it indicates a breakdown between user intent and actual sales at an online store.
Ecommerce Conversion Rate takes a step back in the funnel and assesses the proportion of total site visitors who complete a purchase. A better Cart Abandonment Rate often results in a higher Ecommerce Conversion Rate, underlining the interconnectedness of these pivotal metrics.
Shopping Cart Usability in the Checkout Process
The shopping cart is more than a holding area for potential purchases; it's the gateway to conversion. When a visitor reaches this point, they're typically serious about buying. Therefore, shopping cart usability directly impacts the bottom line. A well-designed cart accelerates the checkout process, while a poorly designed one becomes a bottleneck that increases cart abandonment rates.
High rates indicate friction in the checkout process, costing an eCommerce business sales and revenue. By refining elements like navigation, edit options, and clear calls to action, the likelihood of successful conversions is increased. In short, a user-friendly shopping cart is not a nicety—it’s a necessity for closing sales.

Reduce Abandonment Rates and Turn Online Shoppers Into Buyers
It’s easy to overlook the shopping cart as just a functional tool. But make no mistake, it’s actually one of the most effective salespeople. A few tweaks to the shopping cart experience profoundly affect the bottom line. Given that global cart abandonment rates hover around 70%, the potential for revenue recovery is massive. Even minor improvements lower this percentage and reclaim lost sales, thereby converting more online shoppers into customers.
The impact of a well-optimized cart goes beyond immediate sales. It cultivates long-term customer loyalty. By making the purchasing process seamless and intuitive, shoppers are more likely to return for future purchases. They're also more likely to recommend a brand to others. By refining the shopping cart experience, agencies are not just securing the current sale—they're laying the groundwork for sustained growth.
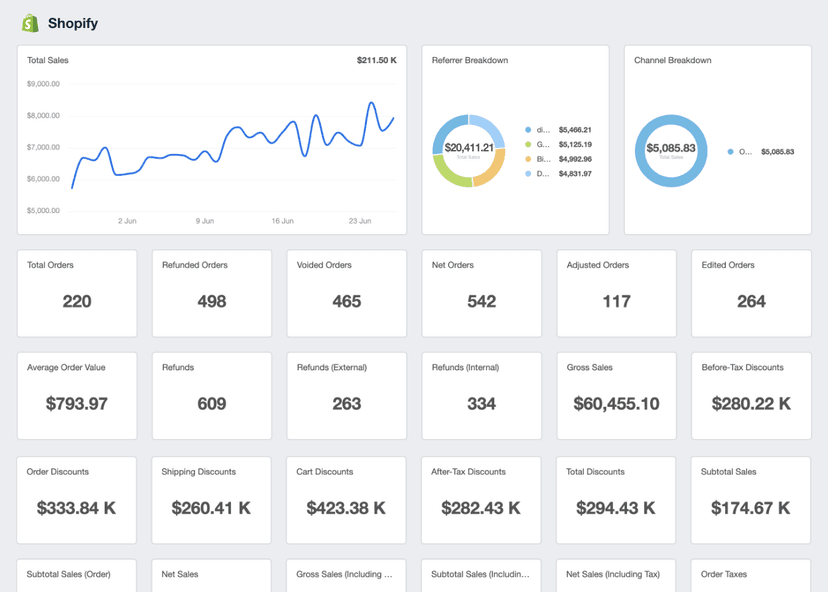
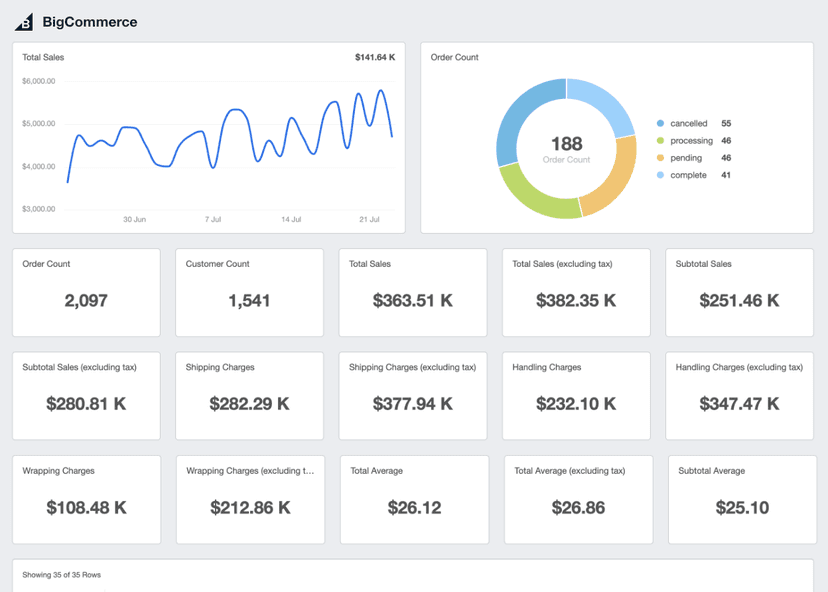
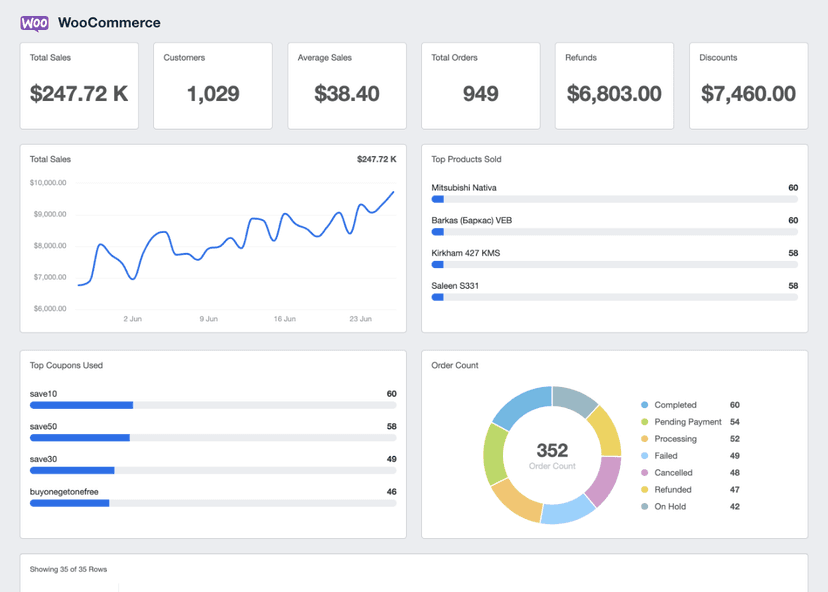
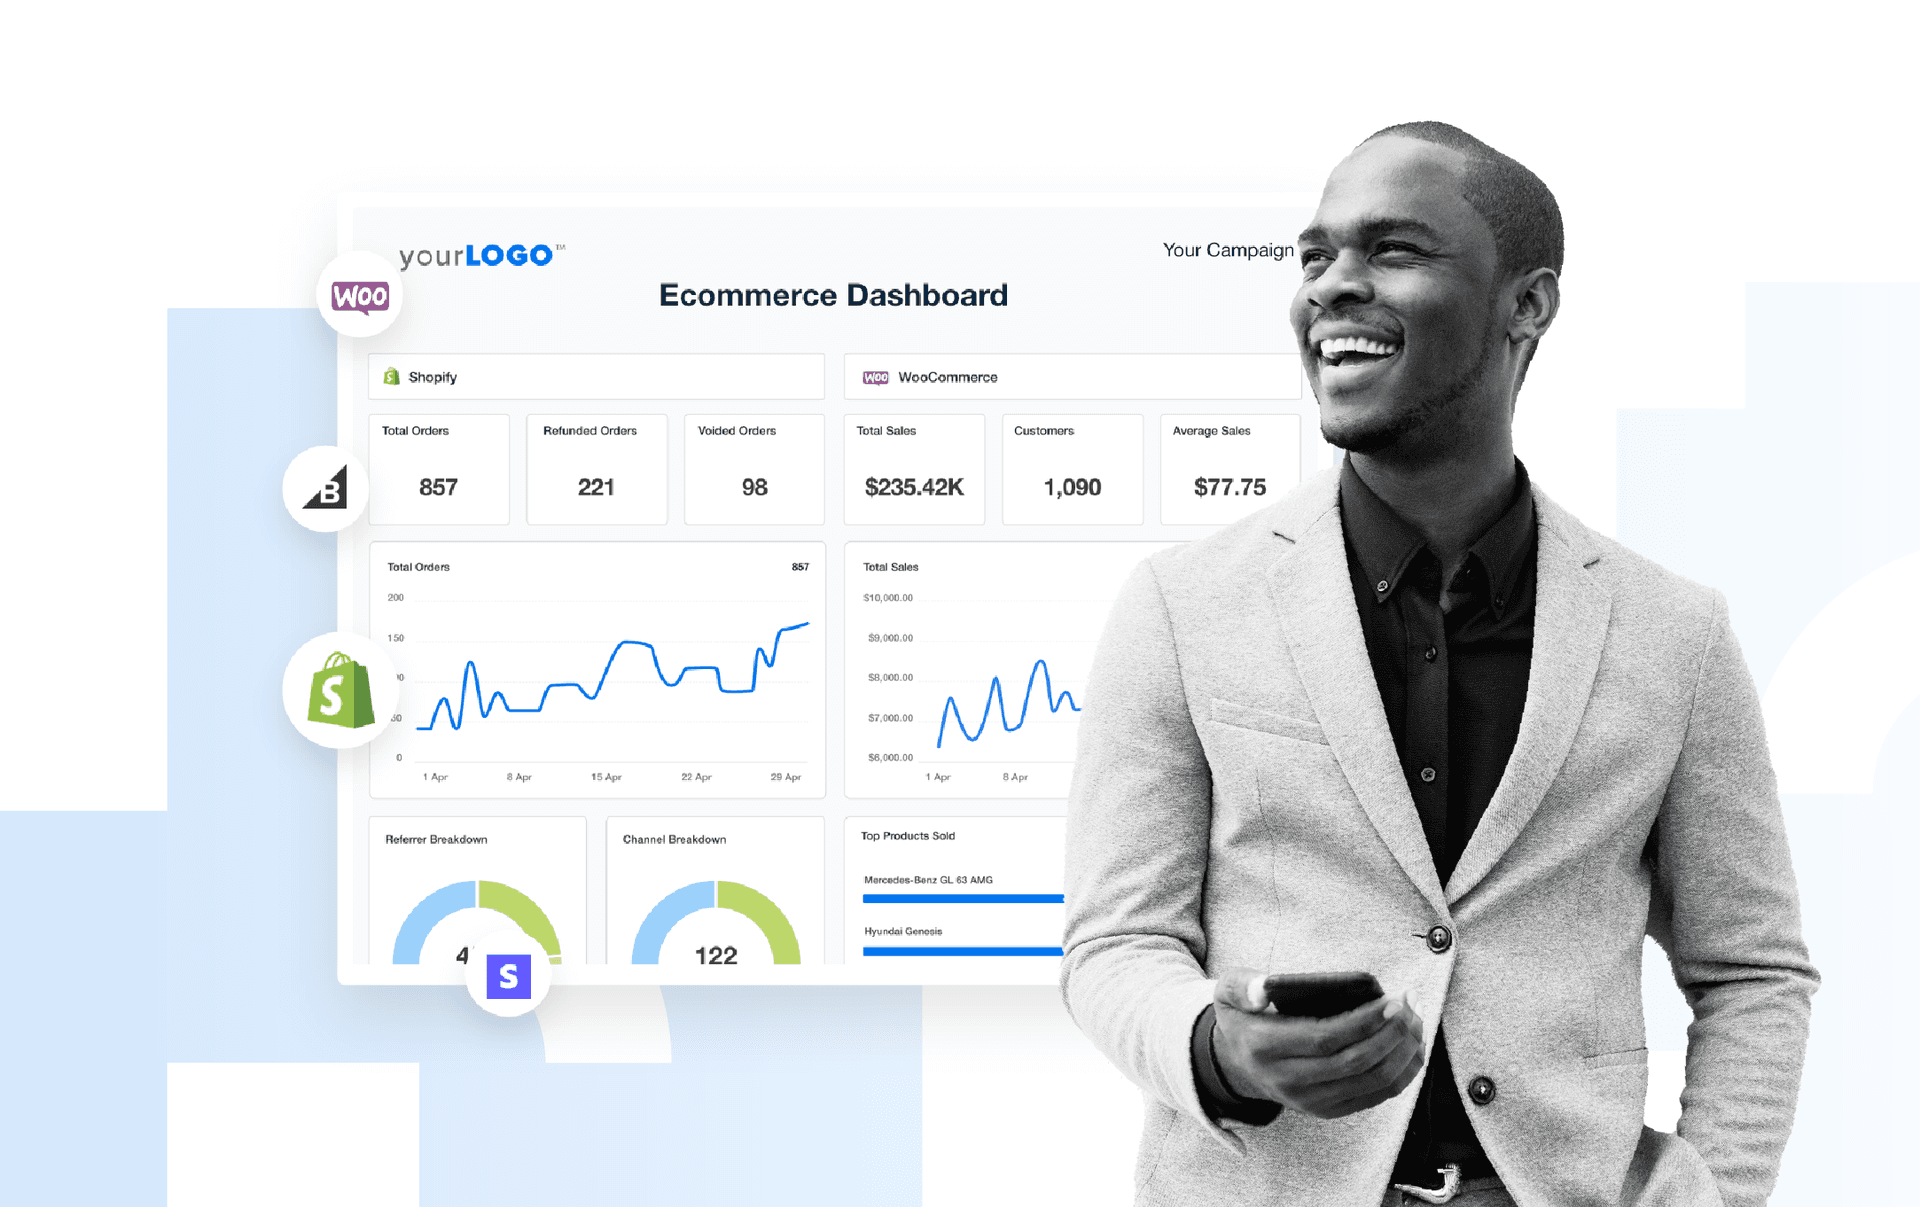
If the client runs an eCommerce site, then how many people are adding items to the cart and how many people are actually purchasing the items is the key KPI for us and the client. Displaying these KPIs is very easy by using the AgencyAnalytics dashboard.
How To Calculate Cart Abandonment Rate
Despite how critical this metric is to eCommerce success, it’s not always easy to find in native analytics platforms. eCommerce shopping carts are dynamic, as online shoppers frequently add or remove items from an existing cart. This fluidity makes a straightforward calculation of the Cart Abandonment Rate challenging.
For example, Google Analytics 4 default metrics only include the Add to Carts metric, which counts the number of times users trigger the add to cart event and not the distinct carts created. Shopify also offers an Added to Cart metric, which includes different items being added to a single cart during unique sessions.
Although Abandoned Checkouts are easier to measure, the Cart Abandonment Rate is still possible by looking at the items added to a cart during specific sessions compared to the checkouts completed. This provides visibility into how often people abandon their carts, influencing cart recovery campaigns.
Cart Abandonment Rate Formula Example
What Is a Good Cart Abandonment Rate?
A good average Cart Abandonment Rate typically ranges between 60% and 75%. While that might seem high–because window shoppers often use carts as a form of wish list or bookmarks–it's generally accepted in the eCommerce industry. Rates in this range indicate that checkout processes and customer experiences are relatively streamlined.
What Is a Bad Cart Abandonment Rate?
A Cart Abandonment Rate that exceeds 80% should be considered a red flag. Such a high percentage usually suggests multiple friction points in the customer journey, from convoluted checkout processes to unexpected costs like shipping and taxes.
How To Set Cart Abandonment Rate Benchmarks and Goals
When conventional benchmarks don't apply, agencies often use historical cart abandonment statistics to set their own. Looking at month-over-month or year-over-year Cart Abandonment Rates provides a clearer picture of performance.
Agencies also back-calculate the required rate improvements to meet specific revenue growth targets. As the Cart Abandonment Rate is a bottom-of-the-funnel metric, improvements here tie directly to increased revenue. This tailored approach makes the metric more actionable and aligned with client objectives.
Consider segmenting the Cart Abandonment Rate by different variables to gain more nuanced insights. For example, separating it by device type identifies whether mobile users abandon carts more frequently than desktop users.
Similarly, consider tracking this rate by various marketing channels to pinpoint if certain advertising efforts are falling short of the final purchase.
It's also essential to align with key stakeholders on how the Cart Abandonment Rate is calculated, whether based on sessions with an Add to Cart event or the total number of items added to carts within a specified time frame. This ensures a unified understanding of the metric and more accurate performance assessments.
Why Cart Abandonment Rate Is Crucial for Clients
Abandoned carts are a waste of potential that no client wants. When a customer adds an item to an online shopping cart but doesn't complete a purchase, that's revenue left on the table. But Cart Abandonment Rate does reveal crucial insights into customer behavior.
High rates typically indicate issues like high shipping costs or cumbersome checkout pages, stopping purchasers in their tracks. Cart abandonment data helps clients reassess cart and checkout strategies, such as confusing fields, security concerns, payment options, or shipping charges. For example, if abandonment occurs at the payment stage, there’s likely a gap in preferred payment methods, security concerns, or an unclear return policy.

Why Cart Abandonment Rate Is Vital for Agencies
Agencies use the Cart Abandonment Rate as a performance indicator. Analyzing why consumers abandon carts allows for strategic refinements. Agencies then develop A/B tests on different cart and checkout stages to identify and remove friction points in the checkout process.
Agencies also employ abandoned cart data for targeted marketing. Crafting specific campaigns for those who almost made a purchase often includes retargeting ads or emails to reduce shopping cart abandonment and improve ROI.

Best Practices for Analyzing and Reporting Cart Abandonment Rate
A thorough analysis of Cart Abandonment Rate sets the stage for optimizing websites, checkout flows, and marketing campaigns. By peeling back the layers of this metric, agencies identify weaknesses and opportunities that shape the overall strategy, from adjusting shipping costs to reevaluating payment methods to launching cart recovery email programs.
Analyze Over Time
Examine Cart Abandonment Rate on a timeline to detect seasonal trends or the impact of changes in an eCommerce store's return policy, payment methods, checkout page, or other enhancements.
Interpret Trends and Anomalies
Look for sudden spikes or drops. These often indicate issues with payment processing or flag opportunities for using special promotions to reduce abandonment during competitive cycles.
Put KPIs in Context with Other Metrics
Cart Abandonment Rate gains clarity and significance when viewed alongside other KPIs. For instance, Add to Cart rate is another metric directly connected to online shopping carts.
Visualize Performance
Charts, graphs, or heatmaps make data easily digestible and actionable. Visual trends often reveal patterns and anomalies quicker than spreadsheets.
Highlight Contribution to Client Goals
Relate Cart Abandonment Rate to broader client objectives like revenue growth or market penetration. This contextualizes the metric, making it more relevant for strategic alignment.
Provide Actionable Recommendations
End reports with concrete steps. For example, if the rate spikes at the credit card details page, suggest implementing a range of preferred payment options to mitigate this issue.
Google Analytics 4 Dashboard Example
Related Integrations
How To Improve Cart Abandonment Rate
Cart abandonment is a lost revenue opportunity. Online retailers and marketing agencies use these tips to directly impact the bottom line by encouraging shoppers to complete their purchases.
Expand Payment Options
Meet shoppers where they are by offering their preferred payment method. Multiple payment methods help prevent cart abandonment on eCommerce sites and increase revenue.
Streamline Checkout
A convoluted checkout frustrates shoppers, causing them to abandon their cart. Make the process swift and user-friendly, such as including guest checkout or free shipping options, to drive eCommerce store purchases.
Offer Discount Codes
When shoppers add an item but hesitate to make a purchase, the business hasn't sold them on value. Entice them with strategically developed discount codes that help tip the scale.
Related Blog Posts
See how 7,000+ marketing agencies help clients win
Free 14-day trial. No credit card required.


