Table of Contents
QUICK SUMMARY:
eCommerce goals focus on optimizing online retail performance. These goals typically include increasing website traffic, enhancing customer engagement, boosting conversion rates, and driving sales growth. eCommerce goals and objectives also involve improving customer experience, leveraging digital marketing strategies, and utilizing data analytics to inform decision-making and track progress against key performance indicators.
It seems that as digital marketers, metrics often rule our world. They are abundantly available, giving us insights into what’s working for our clients–and what we need to improve upon. At the same time, tracking them correctly and effectively takes skill and preparation. That’s where tracking eCommerce goals comes in.
Data may be abundant–but it’s not always important, and focusing on the wrong goals can cost you and your clients business. This is especially true in the world of eCommerce goals, where clients are often focused on the volume of their online sales while also trying to build their brands for the future.
At 42connect, a digital marketing agency that works with a variety of eCommerce clients, insight-driven data and experience helped increase monthly online sales by 27% and increase unique monthly purchases by 29%, including increasing a client’s conversion rates by 135%.
In the world of eCommerce–without a personal salesperson to take you through the process that traditionally happens in a brick-and-mortar store–your clients’ websites need to do some heavy lifting: encouraging not only visits but sales. So how did 42connect provide clients like Caruso’s Coffee and Watercheck with improved numbers like these?
It often comes down to studying the available metrics, establishing key goals to track, and customizing a data-driven marketing plan for clients and their target customers.
Offering Custom Ecommerce Goal-tracking Solutions for Clients
eCommerce sites aren’t one-size-fits-all, and neither are our goal-tracking solutions. We educate our clients along the way, using data to help them and us understand what needs to happen and where opportunities exist.
Often, the most used eCommerce goal metrics to track fall into one of three buckets:
Sales-related: What are sales numbers like in the short- and long-term?
Customer-related: Who is visiting the site, and how often?
Traffic-related: How is the site performing?
These categories provide the framework. They allow clients to digest information more easily and report it to their C-level if necessary.
As an agency, you’ll need to consider BOTH points of view. This means capturing and reporting on the metrics that your client needs (like KPIs and sales) while also reinforcing the results you’re bringing to the table in order to reach their eCommerce goals.
While no one solution or data pool will work for every client, some KPIs are critical for almost everyone within these categories. By tracking toward these 12 goals, you’ll be able to more accurately pinpoint the data that will ensure that you’re consistently taking the necessary steps toward success.
Agency Tip: There are various ways to reveal and track these goals. Your client’s eCommerce platform of choice will typically provide them in abundance. If not, all you need to do is browse through Google Analytics 4 for the required data.
Sales-related Ecommerce Goal Metrics
1. Sales Conversion Rates (Per Traffic Channel)
When discussing key eCommerce metrics, both agencies and clients often place conversion rates in the top bracket.
But this is where educating clients becomes critical. Not all conversion rates, at all times of year, can be measured equally. Is there an increase in traffic, and why? If you’re selling snowblower parts online, chances are July will not be your busy season. People may look, but the urgency to buy isn’t there. Are you selling coffee? Conversion rates here may remain steady throughout the year.
This is why overlaying conversion rates with the channels where people find you is important. Is your Instagram ad campaign driving more traffic to your site, but your conversion rates are down? Is your Google organic traffic up along with your conversion rates?
In helping our clients with eCommerce conversion rate optimization (CRO) we always explore how simplifying the user experience to social proof and trust badges can make a difference. And we report on this data in a way that clients can see causation as well as trends over time.
2. Average Order Value (AOV)
Brick-and-mortar retailers have always used metrics related to the number of items purchased per customer. Units per transaction (UPT) can demonstrate how complete a customer’s basket is. In eCommerce, this language is known as the average order value, or AOV.
Instead of the number of items in the customer’s basket, AOV gets to the total ticket. Tracking this metric allows you to gauge the number of sales required to meet your client’s overall sales goals. Target AOVs are often dependent on the client’s product pricing. A site selling coffee will likely have a lower AOV goal than one selling engine parts.
Strategies to drive up your customer’s AOV can be built into the website design and tracked as well. Consider how the site suggests additional or complementary products. Also, does the site offer free shipping once a customer’s cart reaches a specific threshold? Tactical items like these aren’t just niceties–they can help your clients maximize their AOV.
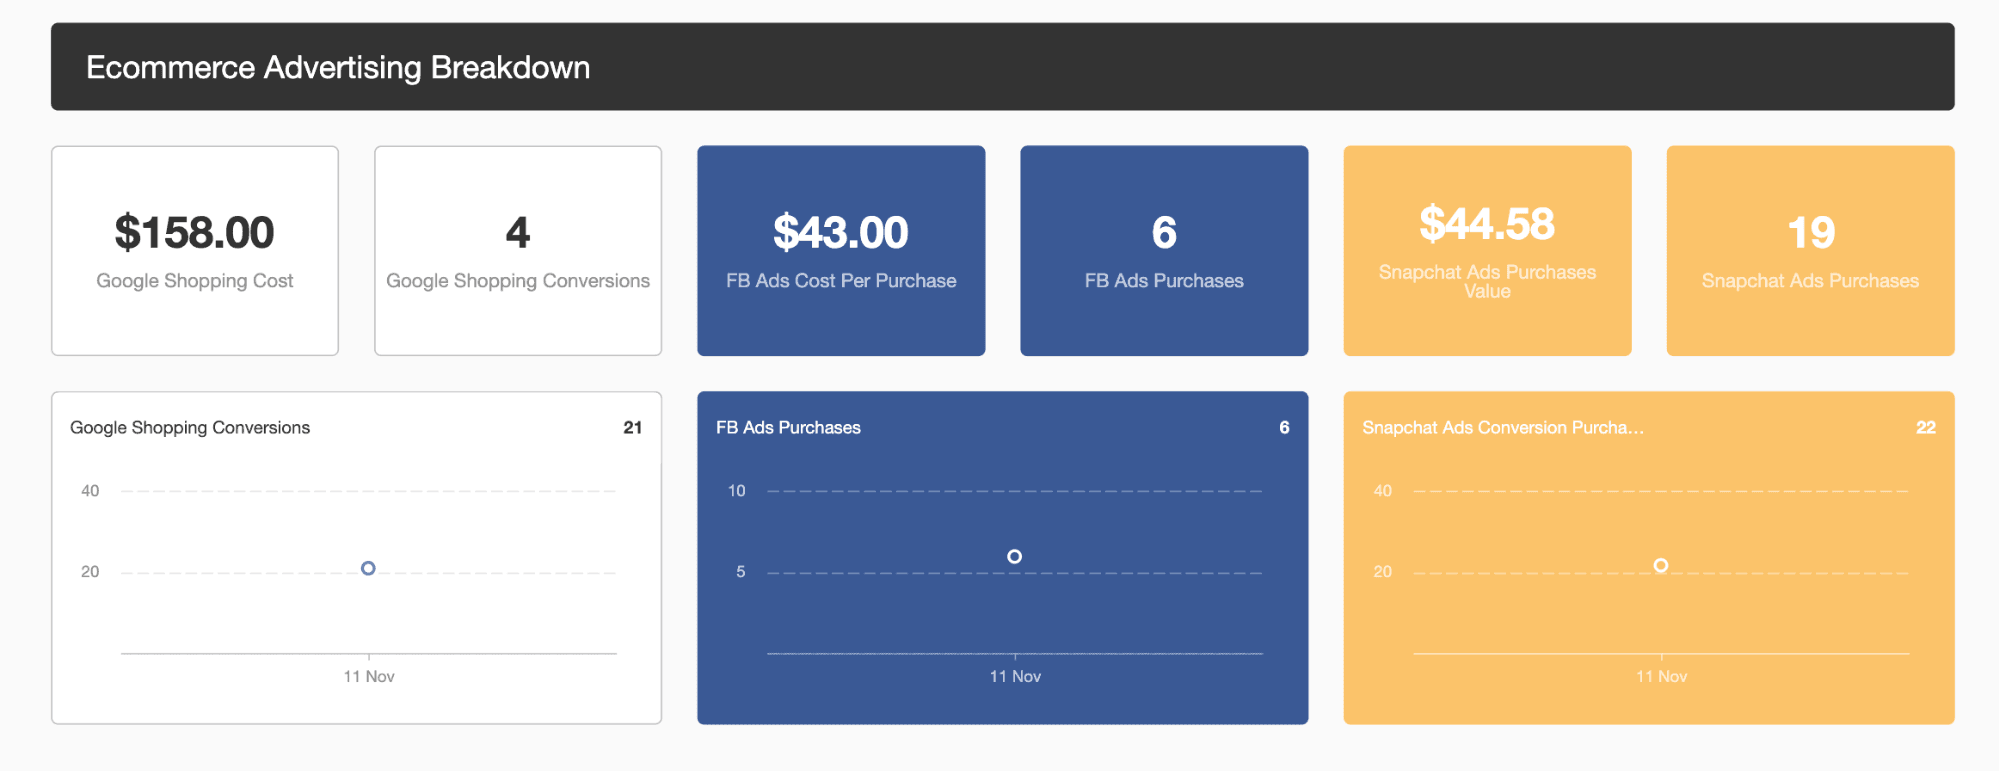
Put all your clients' metrics in a live eCommerce dashboard to save time and make data-backed decisions from one platform. Start your free 14-day trial today!
3. Shopping Cart Abandonment Rate
Sometimes customers don't complete their purchases. They browse your client’s website, add one or two products to their cart, and then simply disappear–abandoning their cart.
Although this problem is something every eCommerce business experiences, the goal is to reduce abandonment rates. The average rate for cart abandonment sits a tad under 70%. So, don’t worry too much if your store’s percentage is on the high side; however, you’ll have to put on your investigating hat if it starts hitting the 90%+ range.
If your client’s cart abandonment rate is excessive but alongside a high add-to-cart rate, it suggests serious issues with your checkout process–whether due to a confusing interface or having second thoughts about an item.
As a digital agency, it’s paramount to have a skilled team of developers who know that the overall user experience needs to be consistent and easy-to-use at every step in the purchase funnel. From the initial build to optimizing an online store for speed and mobile-friendly responsive design, look at any areas where people leave the process and refine them.
Informative product pages with well-written product descriptions, product photos, and product reviews, as well as coding that maximizes major eCommerce platforms such as Shopify, BigCommerce, WooCommerce, and Magento can be the first steps in fixing cart abandonment issues. Even robust reviews can help customers feel more confident about the items they put in their cart–helping to reduce cart abandonment.
4. Checkout Abandonment Rate
Checkout abandonment rate is a different stage during the purchase journey than cart abandonment. Rather than leaving your site after putting items in their cart, the customer has decided to leave after starting the checkout process.
When potential customers have reached the payment page, they are usually committed to completing their purchase. If there is a high checkout abandonment rate, there could be an off-putting aspect of the payment process, including variables such as high delivery costs, added processing fees, or a poor interface. It can also be due to the design and number of clicks needed to complete the process.
In some cases, customers leave because they believe they’ve already completed the purchase, even though they haven’t. That’s a sign that the user experience is unclear.
Work with clients to determine how digital variables such as these can be adjusted to help customers checkout quickly so there’s less chance of abandonment.
5. Repeat Purchasers
All businesses love returning customers. New clients are expensive and tricky to acquire, whereas existing ones are already invested in your company. That’s why it’s crucial to measure repeat purchasers.
Also known as the returning customer rate, a target to aim for is 20-30%. If it’s less than this, it suggests you should invest more in your retargeting efforts. Should it be higher than average, you can spend more time–and resources–growing your client’s customer base.
We’ve found that email is still a high converter when it comes to eCommerce and works particularly well bringing previous customers back for more business. Is your client using email campaigns or email automation with their current online store? eCommerce email marketing is a great way to keep loyal customers in the loop on trends, sales, new products, store expansions, and more.
How To Interpret Sales-related Goal Metrics and Use Them To Make Improvements
By studying sales-related goal metrics, you’ll learn what’s needed to enhance the sales side of your client’s online store. Let’s recap:
Goals | Issue | What To Do |
|---|---|---|
Increase Sales Conversion Rate | Conversion rates are well below target | Start at the very bottom of the funnel and work your way backward to identify any leaks in the purchase path. |
Increase Average Order Value | AOV is below industry standards | Is there an opportunity to include “add on” suggestions throughout the shopping process? Consider how these are presented and the frequency of the suggestions. |
Reduce Cart Abandonment | Customers frequently leave the purchase funnel | Determine what pages within the site are causing the most issues and evaluate them for responsiveness, mobile-friendliness, and information. |
Reduce Checkout Abandonment | Customers fail to complete their purchase | Unexpected costs (such as shipping and handling fees) during the checkout flow is still the leading cause of abandonment. If free shipping is not an option, make sure these costs are presented as early as possible in the shopping funnel. |
Increase Repeat Purchasers | Your client is interested in improving customer loyalty. | Consider the merits of email campaigns to drive traffic. |
Customer-related Goal Metrics
6. Customer Retention Rate
The customer retention rate is similar to the rate of repeat purchasers. However, the difference with this metric is that you track the percentage of existing customers following a given period. This is particularly important to measure if you run a subscription service, for example, where recurring sales are part of the process.
While the importance of the retention rate differs depending on your client’s industry and business type, it is still wise for business owners to track this KPI.
If your clients seem to be losing repeat customers, consider how their site and your messaging can help them stay or bring them back. Can they reduce the frequency of email communications vs. stopping them entirely? Can they “pause” a product subscription or spread out the frequency of deliveries instead of canceling it outright? This metric can be a great indicator of opportunities to improve how you reward a client’s loyal customers and adapt to their evolving needs.
7. Email Opt-ins
Email campaigns will no doubt be a key part of your marketing efforts. Yet you cannot simply run these campaigns without measuring performance. Fortunately, there are various metrics available for email marketing. One is the opt-in rate: the number of people willing to share their contact info with your client.
Email delivery rate, open rate, click-through rate, conversion numbers–all of these are built on your email list. Still, collecting these emails is not straightforward; you need a strong opt-in strategy, which can include getting a potential customer’s email soon after they visit your client’s website.
Think about what you can offer them in return. Discounts and unique information (ebooks or blog content) can entice participation. By tracking these opt-ins based on different offers, you can see if your efforts are getting people to hand over their email addresses or if you need to focus more on this area of your client’s business.
8. Customer Acquisition Cost (CAC) & Customer Lifetime Value (CLV)
Many businesses have marketing data related to their customers, and this can include information on the cost it takes to acquire each customer–known as CAC. This data looks at all the costs associated with marketing a business and gaining traction–employing sales teams, agency costs, personnel costs, etc.
On the other side of this equation is the amount the company expects to earn from that customer throughout their relationship. Businesses need to maximize their customer lifetime value (CLV) metrics to be successful.
It's important to understand your client’s ideal CLV to CAC ratio and apply this to your piece of their marketing budget. How many new clients are you attracting for them? And what’s the cost of acquiring each one? Throughout the client/agency relationship, it’s beneficial to demonstrate the longevity of these relationships as well.
Paying close attention to these KPIs helps your clients avoid spending too much on their promotional strategy unnecessarily. If the customer lifetime value is $500, for instance, and you’re spending over a thousand dollars getting a new customer onboard, these figures don’t equal profits.
9. Repeat Purchase Frequency
Metrics revolving around repeat purchases have been covered in other areas, and for good reason: it costs more for your clients to bring in new customers. Loyal customers can drive most of your client’s business, as indicated by the old 80/20 rule: 20% of your customers will bring in 80% of your business. That’s why paying attention to repeat purchase frequency is important.
How often are customers coming back for more?
Suppose a customer returns once a year. They continue to enjoy what your client’s business offers, as evidenced by their repeat custom. However, it would be even better if they repeated their purchase every month or every quarter. By monitoring this metric, you can see if there’s room to gain more sales from each repeat customer.
This is another area where email campaigns can help improve customer loyalty. Reminding customers of what you offer on a more frequent basis can drive improved purchase frequency. It’s also a smart idea to test A/B email and ad campaigns to determine if certain messages drive more traffic and purchases.
How To Interpret Customer-related Goal Metrics and Use Them To Make Improvements
These eCommerce goals improve the customer experience and, ultimately, drive more sales for your client’s business. You can refine your marketing efforts, appeal better to new and existing customers, and boost profit margins. Here’s a recap:
Goal | Issue | What To Do |
|---|---|---|
Increase Customer Retention Rate | Your client is losing their automatic reorder subscribers | Are customers given the opportunity to pause subscriptions or receive offers less frequently? Consider implementing variety and choice to make customers feel more comfortable with the commitment. |
Increase Email Opt-ins | The client would like to grow their email opt-in rate faster | Test various offers to determine what motivates prospects most. |
Increase Customer Acquisition Cost & Lifetime Value | Cost to acquire is too high | Manage expectations with your client based on the actual total lifetime value of the client. Are their numbers realistic? Where can you help them streamline their marketing dollars? |
Increase Repeat Purchase Rate | Frequency of purchase isn’t as much as the customer would like | Consider more targeted email and marketing campaigns to boost engagement. |
Traffic-related Goal Metrics
10. Sessions by Traffic Source
It is vital to keep an eye on the number of website visitors. However, you should delve deeper still and not simply focus on overall numbers. Instead, tracking sessions by traffic source details where your visitors are coming from.
If your client receives more visitors from emails than Google search results, for example, this suggests their search engine optimization (SEO) requires work. By analyzing the traffic source, you can pinpoint areas for improvement.
Drilling into this a step deeper–by looking at engagement and conversion by traffic source–will unearth a lot of valuable data regarding which channels are driving the right kind of visitor to your client’s website.
11. Average Time on Site
The ‘average time on site’ metric is used to see how long a visitor remains on your client’s website. In general, you want this duration to be high. A potential customer that sticks around is interested in the content–and products–your clients are supplying.
On the other hand, if the average time is low, it suggests something is lacking and that you’re not doing enough to keep people on your client’s site. Or that the campaigns bringing the customers to the site, such as PPC, SEO, or email, are not being supported by the content on the page.
The reasons they don’t spend time on your site could vary, whether due to a lack of content or interest in your products or perhaps issues with your website’s performance, with slow loading times and poor optimization being major culprits.
Work with your clients to develop more robust content, re-evaluate product descriptions, reviews, videos, and information, and track how new content performs.
12. Bounce Rate
A bit of a mirror metric to Time on Site, Bounce Rate often indicates that the user simply didn’t find what they were looking for. You never want a potential customer to leave a website without converting. If their visit doesn’t lead to a sale, you still want them to fill out a form, sign up for a newsletter, look at a product listing, or even click on a different page. With that in mind, the bounce rate reveals how many users visited your client’s site and then left before doing anything.
Obviously, you want as low a bounce rate as possible, which can be achieved by focusing on numerous facets. How responsive is your website? Are users getting hung up on certain pages or at certain points in the process. Speed optimization, an appealing design, and an easy-to-navigate platform are all factors that can help reduce the bounce rate.
Read More About How is Bounce Rate Changing in Google Analytics 4
How To Interpret Traffic-related Goal Metrics and Use Them To Make Improvements
With these metrics, you learn more about your client’s website performance and see if visitors are engaging and enjoying your content. You also find out if people are leaving before acting. Here’s what to consider:
Goal | Issue | What To Do |
|---|---|---|
Increase Sessions by Traffic Source | Organic traffic has dropped significantly over the last three months. | Start with an SEO site audit to check for technical errors that could be impacting the client site’s indexability. |
Increase Average Time on Site | Customers and potential customers aren’t spending much time on your client’s site–or average time has decreased. | Audit site content to determine if there are areas where more information would help people stick around. |
Reduce Bounce Rate | Too many customers are leaving without making a purchase or registering for information. | Audit site usability to determine if technical issues are causing customers to leave prematurely. Also check the keywords and ads to ensure they are relevant to the page. |
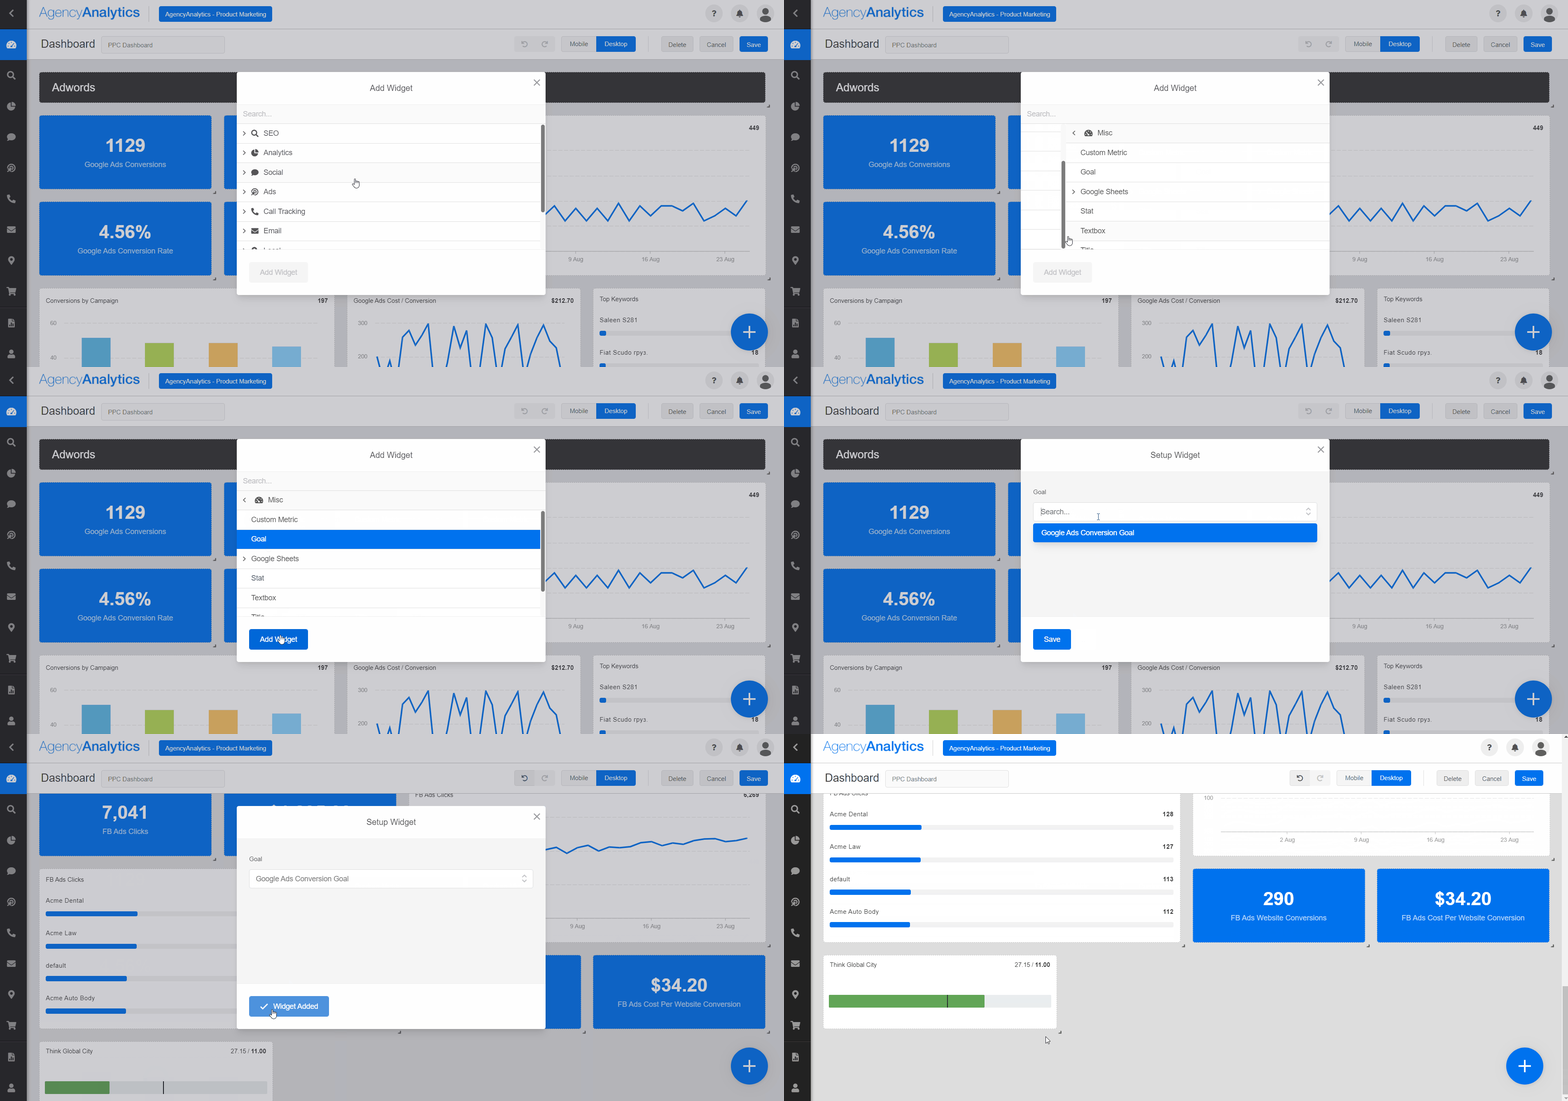
Use the custom goals feature in AgencyAnalytics to show how you’re progressing against your clients’ business objectives. Keep all your clients’ eCommerce goals in one place with comprehensive dashboards that update in real-time. Try AgencyAnalytics free for 14 days.
Why Tracking Ecommerce Goals Is Important for Your Client’s Business
It’s clear that monitoring the metrics and KPIs covered in this guide is crucial for modern business owners who wish to achieve greater levels of eCommerce success.
Whether your clients want to generate more sales, improve customer experience, refine their marketing spend, enhance their website content, or facilitate repeat custom and a loyal customer base, utilizing these metrics and the important data they provide will guide your marketing and sales strategies.
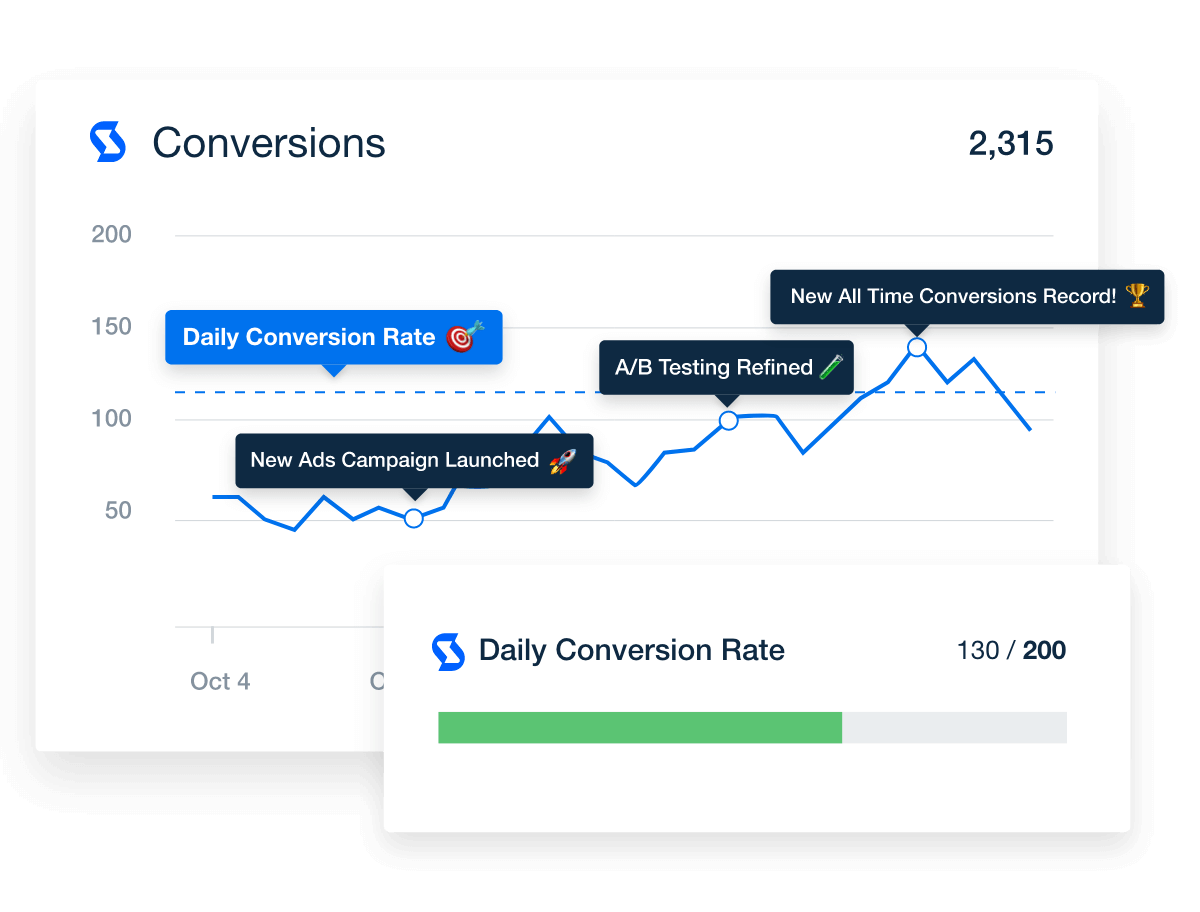
Add custom commentary and goal tracking to your client reports to instantly communicate campaign progress. Try it free in AgencyAnalytics for 14 days!
Ecommerce goals are the informed guidance your agency needs to help clients catapult their company to new heights – and help it stay there as their business grows, evolves, and develops.
Wrapping Up Your Results Into a Clear Report
Ecommerce KPIs are imperative for the continued growth and development of your client’s online store. By tracking–and effectively reporting on–the key eCommerce goals listed above, you are in a position to take your clients’ businesses to the next level.
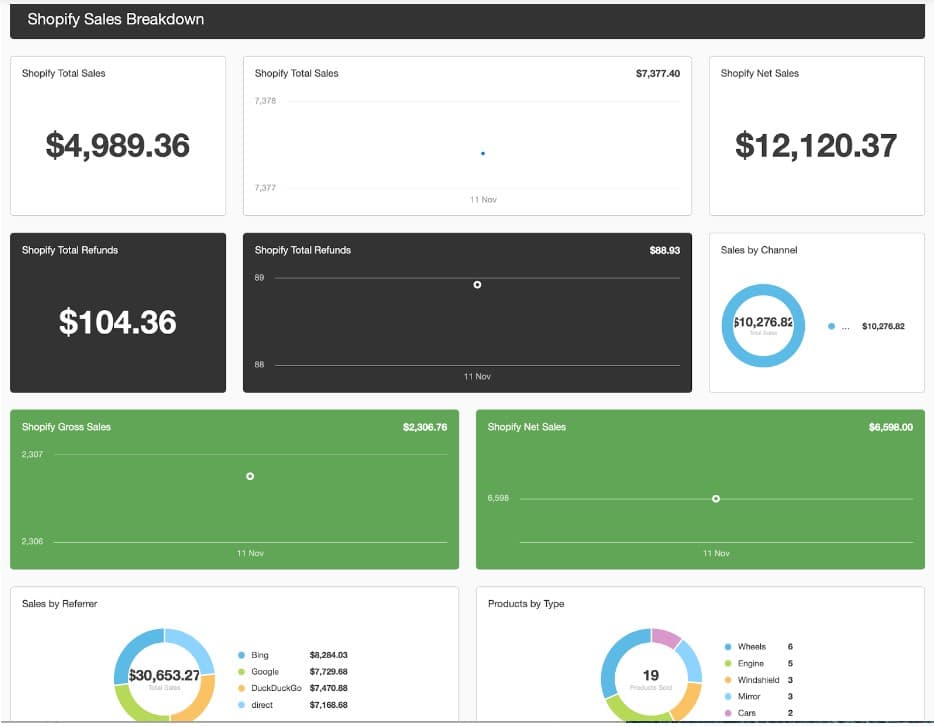
Combine Shopify, Keap, and WooCommerce metrics alongside Google Analytics data and over 80 marketing channels into comprehensive client reports. Try AgencyAnalytics free for 14 days!

Written by
Brian Ferritto is a Partner and Digital Marketing Director at 42connect, an agency that helps clients grow their businesses through digital marketing tactics. Brian has been in the business for over 20 years and has worked on various projects for well-known brands such as Tiger Woods, Sergio Garcia, GE, Eaton, Moen, and more.
See how 7,000+ marketing agencies help clients win
Free 14-day trial. No credit card required.


