Checkout Abandonment Rate
Identify Friction
Use the Checkout Abandonment Rate to identify bottlenecks in the checkout process.
UI/UX Optimization
This metric measures the effectiveness of A/B tests and the resulting checkout flow improvements.
Client Reports
Use this KPI as a transparent indicator of where the agency's efforts have led to improvements.
Campaign Impact
Fluctuating rates after new campaign launches guide future targeting adjustments.
Why Tracking Checkout Abandonment Rate Is Crucial
When running an online store, few things sting more than seeing potential sales slip through the cracks at the final step. High Checkout Abandonment Rates are a red flag, signaling issues on the checkout pages such as complicated forms, hidden fees, or the lack of a guest checkout option.
By paying attention to this KPI, online retailers and their agency partners arm themselves with the data needed to refine the checkout process and bring those potential customers back into the fold.
This KPI also offers a direct line of sight into lost revenue. While deploying cart recovery strategies coax customers back, understanding the Checkout Abandonment Rate completes the first crucial step in tackling the issue.
Stop Wasting Time on Manual Reports... Get Ecommerce Insights Faster With AgencyAnalytics
How Checkout Abandonment Rate Relates to Other KPIs
One of the first connections to make is between the Checkout Abandonment Rate and Cart Abandonment Rate. While both metrics provide insight into lost sales opportunities, they occur at different stages. An abandoned cart means the user has left items behind, whether or not they began the checkout, meaning they may not quite be ready to buy. It is common to calculate cart abandonment rate alongside checkout abandonment to understand end-of-funnel eCommerce behavior.
The checkout Abandonment Rate also directly impacts sales revenue. When examined alongside the average checkout value, it’s possible to calculate how much money is left on the table. For instance, if both the average checkout value and the Checkout Abandonment Rate are high, it could mean that customers are considering the product but hesitant to complete the purchase.
Segment Data For In-Depth Insights
Segmenting the Checkout Abandonment Rate is essential to understanding the impact on the customer segment on this metric. Break it down by new vs. returning customers to start. New customers might lack trust or find the return policy unclear. Returning customers abandoning carts usually signals issues in the existing buying process, such as a slow checkout page or better offers elsewhere.
Devices also play a crucial role in understanding this metric. Mobile users often abandon carts due to poor mobile site navigation or slow load times. Compare metrics between mobile and desktop to identify gaps in user experience. If desktop numbers are steady but mobile rates are high, the mobile UX needs work.

Common Pitfalls and How to Avoid Them
It's easy to dive headfirst into analyzing Checkout Abandonment Rate—but remember that not all abandonment is the same, and understanding the key differences will keep an agency from making rookie mistakes.
For starters, don't chase the impossible dream of a zero-percent abandonment rate. Instead, use tools like heatmaps and session replays to pinpoint the avoidable reasons behind abandonment.
Seasonality is another factor that trips up even an experienced digital marketer. A spike in abandonment rates during holiday seasons or big sales is often temporary. Always rely on long-term data when making significant adjustments to the strategy.
The double-edged sword of retargeting and cart abandonment emails. Yes, it helps recover lost sales—but go overboard, because this is more likely to irritate than to entice. Base retargeting efforts on solid data and consumer behavior patterns to avoid driving potential customers away.
If the client runs an eCommerce site, then how many people are adding items to the cart and how many people are actually purchasing the items is the key KPI for us & client. Displaying these KPIs is very easy by using the AgencyAnalytics dashboard.
How To Calculate Checkout Abandonment Rate
Calculating this metric is a reasonably straightforward exercise, although the devil—as they say—is in the details. For an eCommerce store, data is usually tracked when customers hit the checkout page and when they complete a purchase. These two sets of numbers form the backbone of the calculation. To determine this KPI, subtract the total number of completed transactions from the total number of users who initiated checkout. Then, divide that figure by the total number of users who started checkout. Finally, multiply by 100 to get a percentage.
Checkout Abandonment Rate Formula
What Is a Good Checkout Abandonment Rate?
A good average hovers around 55-65%. Rates within this range usually signify a relatively frictionless checkout process that encourages shoppers to complete the purchase and not abandon their cart.
What Is a Bad Checkout Abandonment Rate?
If the rate is above 75%, consider that a red flag. High abandonment rates indicate significant bottlenecks or deterrents within the online shopping cart and checkout experience that need immediate attention.
How To Set Checkout Abandonment Rate Benchmarks & Goals
Remember that many factors influence what could be considered a good or bad checkout abandonment rate for a specific client. When standard benchmarks are not applicable, agencies turn to existing data and business objectives.
For example, if the aim is to increase sales revenue by 10%, quickly back-calculate the needed improvement in the Checkout Abandonment Rate to hit that target. This gives a customized benchmark to aim for. The same process can be applied to the average cart abandonment rate.
Another reliable approach is to examine historical trends of Checkout Abandonment Rates over different time frames–weekly, monthly, and quarterly–to establish a baseline for future performance goals.
Why Checkout Abandonment Rate Matters to Clients
The checkout Abandonment Rate is a precise gauge of untapped revenue. For example, when a shopper abandons their cart at the credit card stage, it signals inefficiencies in the payment process. However, high abandonment rates point to multiple areas for improvement, from shipping costs to a complex return policy.
The metric is critical for clients because it directly impacts profitability. They use it to make essential adjustments, such as streamlining or removing the requirement to create an account during the checkout, offering free shipping, or expanding payment methods.

Why Checkout Abandonment Rate Matters to Agencies
For agencies, this metric measures the effectiveness of the online sales funnel. A high Checkout Abandonment Rate flags problem areas where shoppers abandon their carts. By adjusting these elements, agencies demonstrate their contribution to reducing online shopping cart abandonment and increasing revenue.
The rate allows for strategic interventions like retargeting campaigns and emails to recover abandoned carts, thereby solidifying the agency's role in boosting revenue and profitability.

Win Back Billable Hours by Automating Your Client Reporting
Best Practices When Analyzing & Reporting On Checkout Abandonment Rates
A comprehensive analysis of the Checkout Abandonment Rate offers critical insights that drive website optimizations and targeted advertising campaigns. Understanding the intricacies and variations in this metric helps agencies strategize more effectively, saving both time and resources.
Analyze Over Time
Review the Checkout Abandonment Rate to establish positive or negative trends. This helps identify seasonality and assess the long-term effectiveness of changes made to the checkout flow.
Examine Across Channels
Different channels like paid search, social media, or email impact the Checkout Abandonment Rate. Compare results to identify where campaign targeting and messaging adjustments are needed.
Spot Trends and Anomalies
Sudden spikes or dips require immediate attention. Knowing the “why” behind these movements provides actionable insights for real-time adjustments.
Context Matters
Never look at the Checkout Abandonment Rate in isolation. Comparing it to other KPIs like conversion rate or average cart value provides a more complete picture of the opportunity to drive more revenue.
Visualize Performance
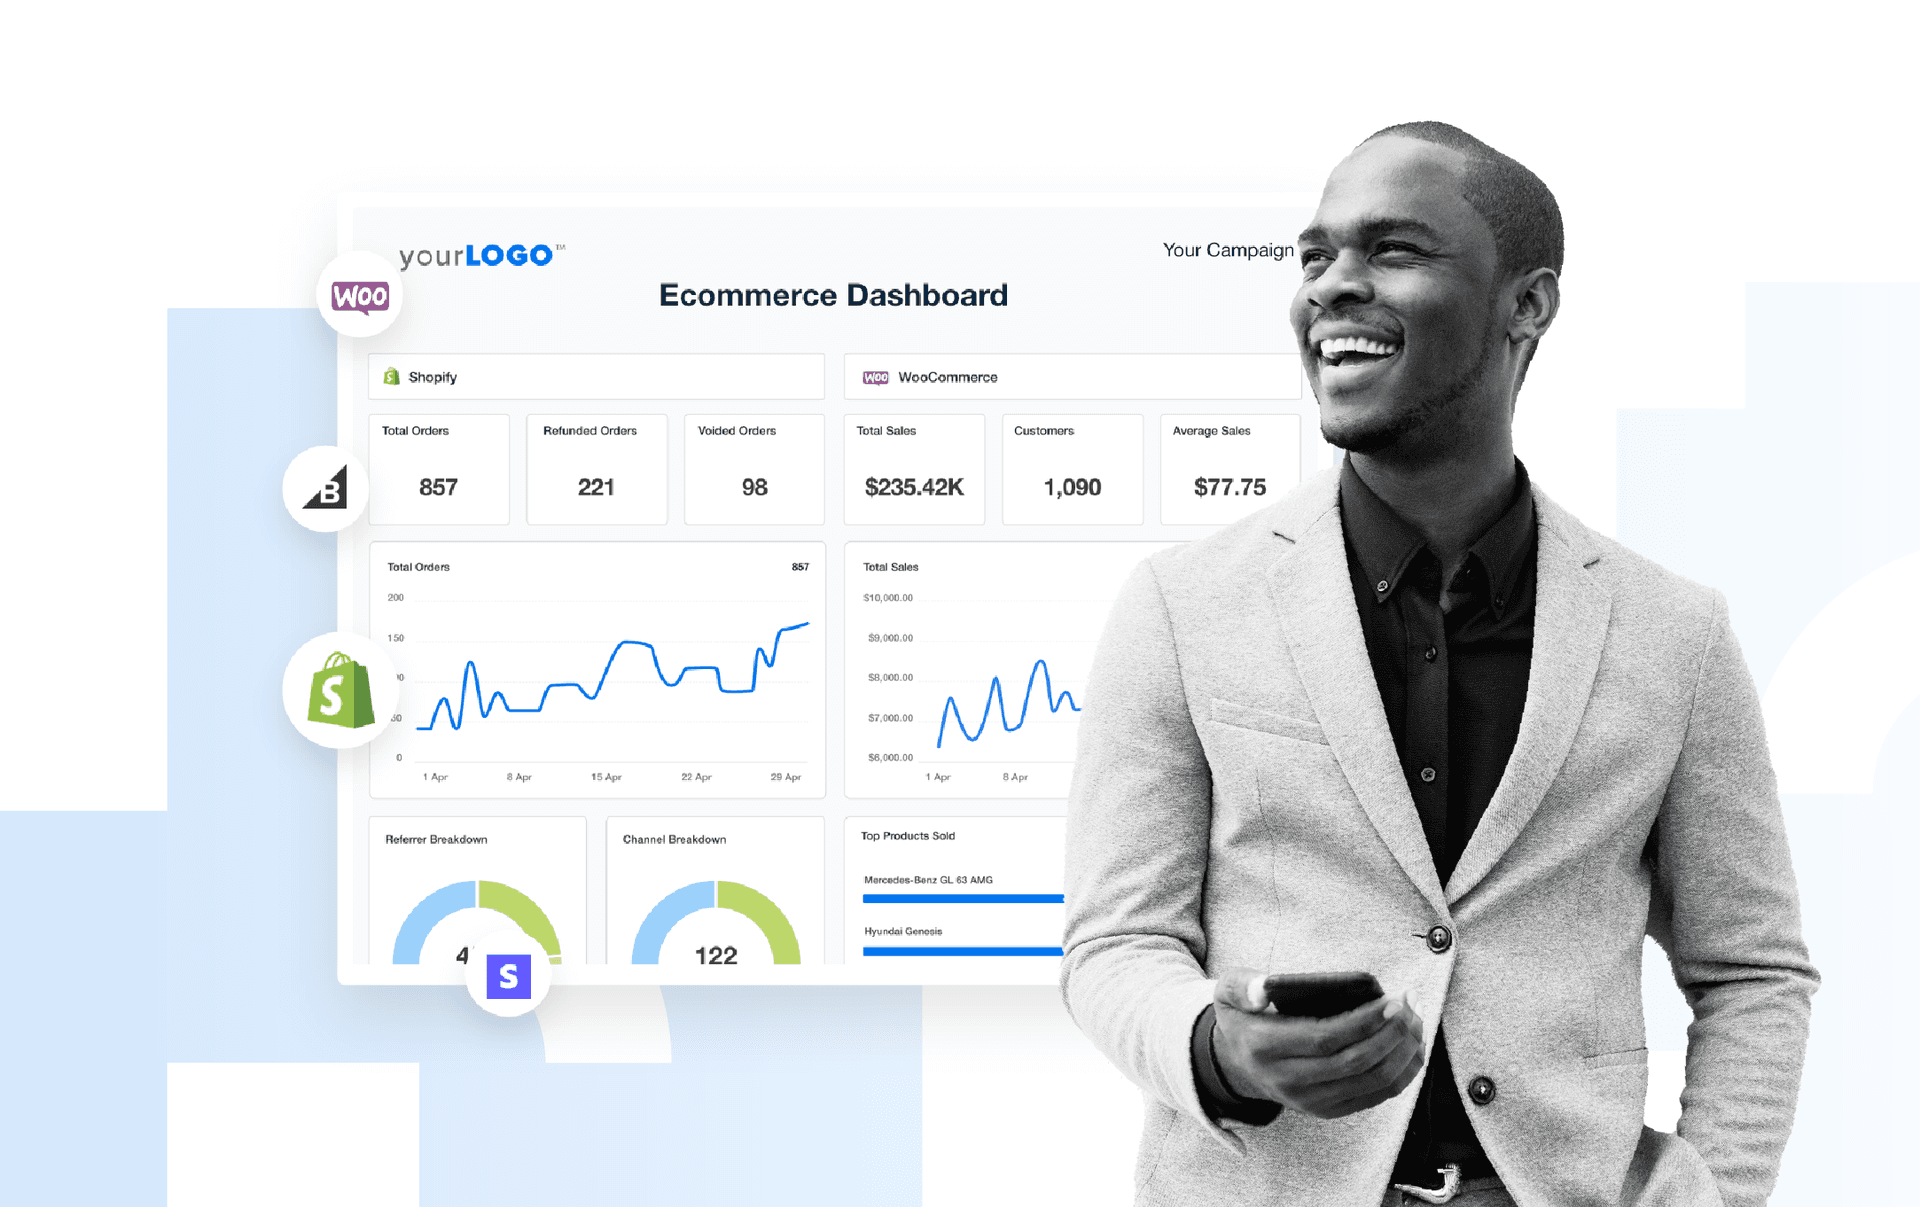
Use charts and graphs to create an at-a-glance view of Checkout Abandonment Rate trends, helping to communicate complex data simply.
Align With Client Goals
Demonstrate how lowering the Checkout Abandonment Rate directly correlates to client objectives such as increased sales or more significant market share.
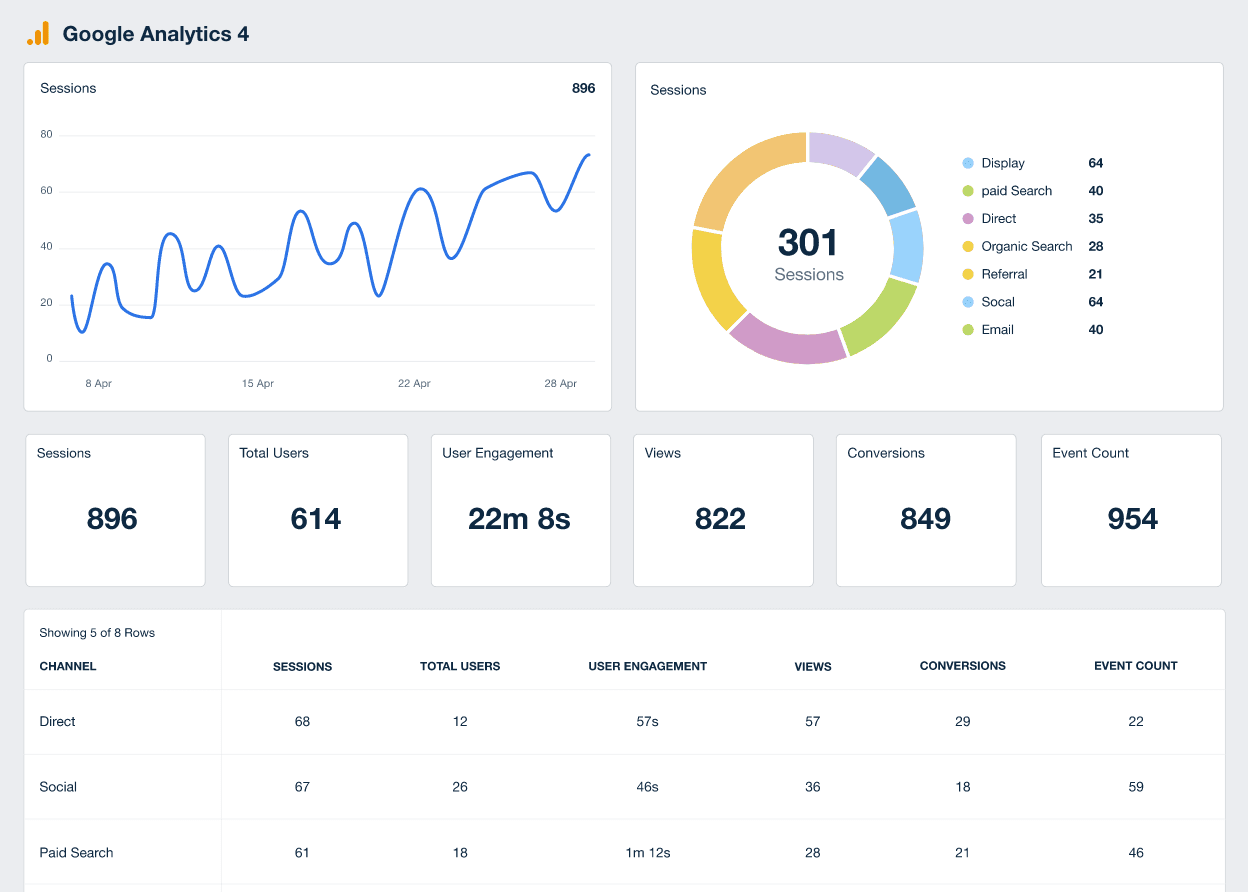
Google Analytics 4 Dashboard Example
Related Integrations
How To Improve Checkout Abandonment Rate
Tired of watching customers vanish at the final hurdle? Optimizing the checkout process makes a big difference. A high Checkout Abandonment Rate signals more than lost sales; it also indicates missed opportunities to build customer loyalty. Here are some actionable tips to turn things around.
Streamline Checkout
Minimize the number of steps. Each extra page or field increases customers’ likelihood of abandoning shopping carts. Keep it simple and user-friendly.
Show Costs Early
Customers hate last-minute hidden fees. Be upfront about shipping costs and taxes to reduce reasons for shopping cart abandonment.
Offer Guest Checkout
Don’t force customers to create an account. Offer a guest checkout option to reduce friction and improve shopping cart abandonment rate.
Related Blog Posts
See how 7,000+ marketing agencies help clients win
Free 14-day trial. No credit card required.


